
This 2026 analysis compares Easter candy performance across Amazon and Walmart, focusing on pricing strategies, inventory levels, and consumer behavior. The study evaluates product availability, bestseller rankings, promotional effects, and seasonal sales trends. Data were collected using automated extraction methods to ensure accuracy and consistency, while validation and anomaly detection maintained reliability. Seasonal demand patterns indicate peak purchasing occurs in late March and early April. Walmart showed stronger performance in mass-market products with competitive pricing, whereas Amazon excelled in premium and exclusive items with higher customer engagement and reviews. Analysis also considered stock health and delivery timelines, highlighting differences in fulfillment efficiency. The study’s insights provide actionable guidance for retail planning, merchandising, and inventory management. Comprehensive tracking of price changes, bestseller movement, and customer preferences supports data-driven decision-making, helping retailers optimize strategies for seasonal events and improve overall sales performance.


Walmart Advantage – Early-season sales were higher on bulk products due to competitive pricing and wider availability.
Amazon Strength – Premium and exclusive items performed strongly, showing higher customer ratings and engagement.
Demand Peaks – Purchasing activity was highest between late March and mid-April, aligning with Easter shopping patterns.
Data Accuracy – Automated collection and monitoring ensured timely tracking of price changes, stock levels, and bestseller movements.
Strategic Insights – Analysis of trends supports inventory planning, promotional strategies, and overall seasonal retail performance.
In this comprehensive research report, we present a comparative study of Easter candy performance between two retail giants — Amazon vs Walmart Easter Candy Data Analysis 2026 — offering insights into pricing, consumer preferences, and market dynamics. Leveraging method to Scrape Amazon vs Walmart Easter Candy Market Insights and incorporating Easter candy market intelligence from Amazon vs Walmart, this study unravels detailed metrics essential for stakeholders — e commerce analysts, grocery retailers, and data science teams.
Our approach includes structured web data collection and analytics to Extract Easter candy trends data for analysis using advanced methodologies. We emphasize realistic insights derived from robust data strategy and practical scraping frameworks.
This report employs a mixed method of statistical aggregation and time series evaluation of product listings and sales patterns in Easter candy categories for both Amazon and Walmart throughout Q1 and Q2 of 2026. The process includes:
We use tools such as the Amazon vs Walmart Easter Candy Data Scraping API in conjunction with scraper frameworks for structured product metadata capture. Key variables include price, rating, seller type, seasonal velocity, and promotional activity.
To enhance predictive accuracy, sales performance indicators are derived via Easter Candy Sales Data Analytics Amazon vs Walmart, benchmarking item velocity and price elasticity. The result set includes top performers — assessed not simply by volume or revenue but by composite indices such as customer satisfaction, stock health, and dynamic pricing impact.
Concurrently, Easter Sweets Bestseller Analytics from Amazon & Walmart allows us to observe sustained demand and competitive pricing strategies. Our dataset spans national listings, with segmented analysis by price tiers ($0–$10, $10–$25, $25+).
To gather and process raw data, we utilized multiple backend services alongside custom extraction utilities:
| Component | Purpose |
|---|---|
| Scraper Framework | Crawled retail inventories and storefronts |
| Amazon Fresh Grocery Delivery Scraping API | Harvested grocery specific listings |
| Walmart Grocery Delivery Scraping API | Extracted Walmart grocery product feeds |
| Distributed Scheduler | Ensured near real time updates |
| Data Warehouse | Centralized structured storage |
| Analytics Engine | Aggregated and visualized trends |
For Amazon data, we incorporated standardized feed access using the Amazon Fresh Grocery Delivery Dataset, giving us item specifics, pricing schedules, and customer reviews. Walmart feeds were similarly sourced using the Walmart Grocery Delivery Dataset, providing a comprehensive basis for comparison across leading metrics.
By aligning the datasets through a standardized schema, we minimized structural discrepancies and enabled seamless cross retailer analytics.
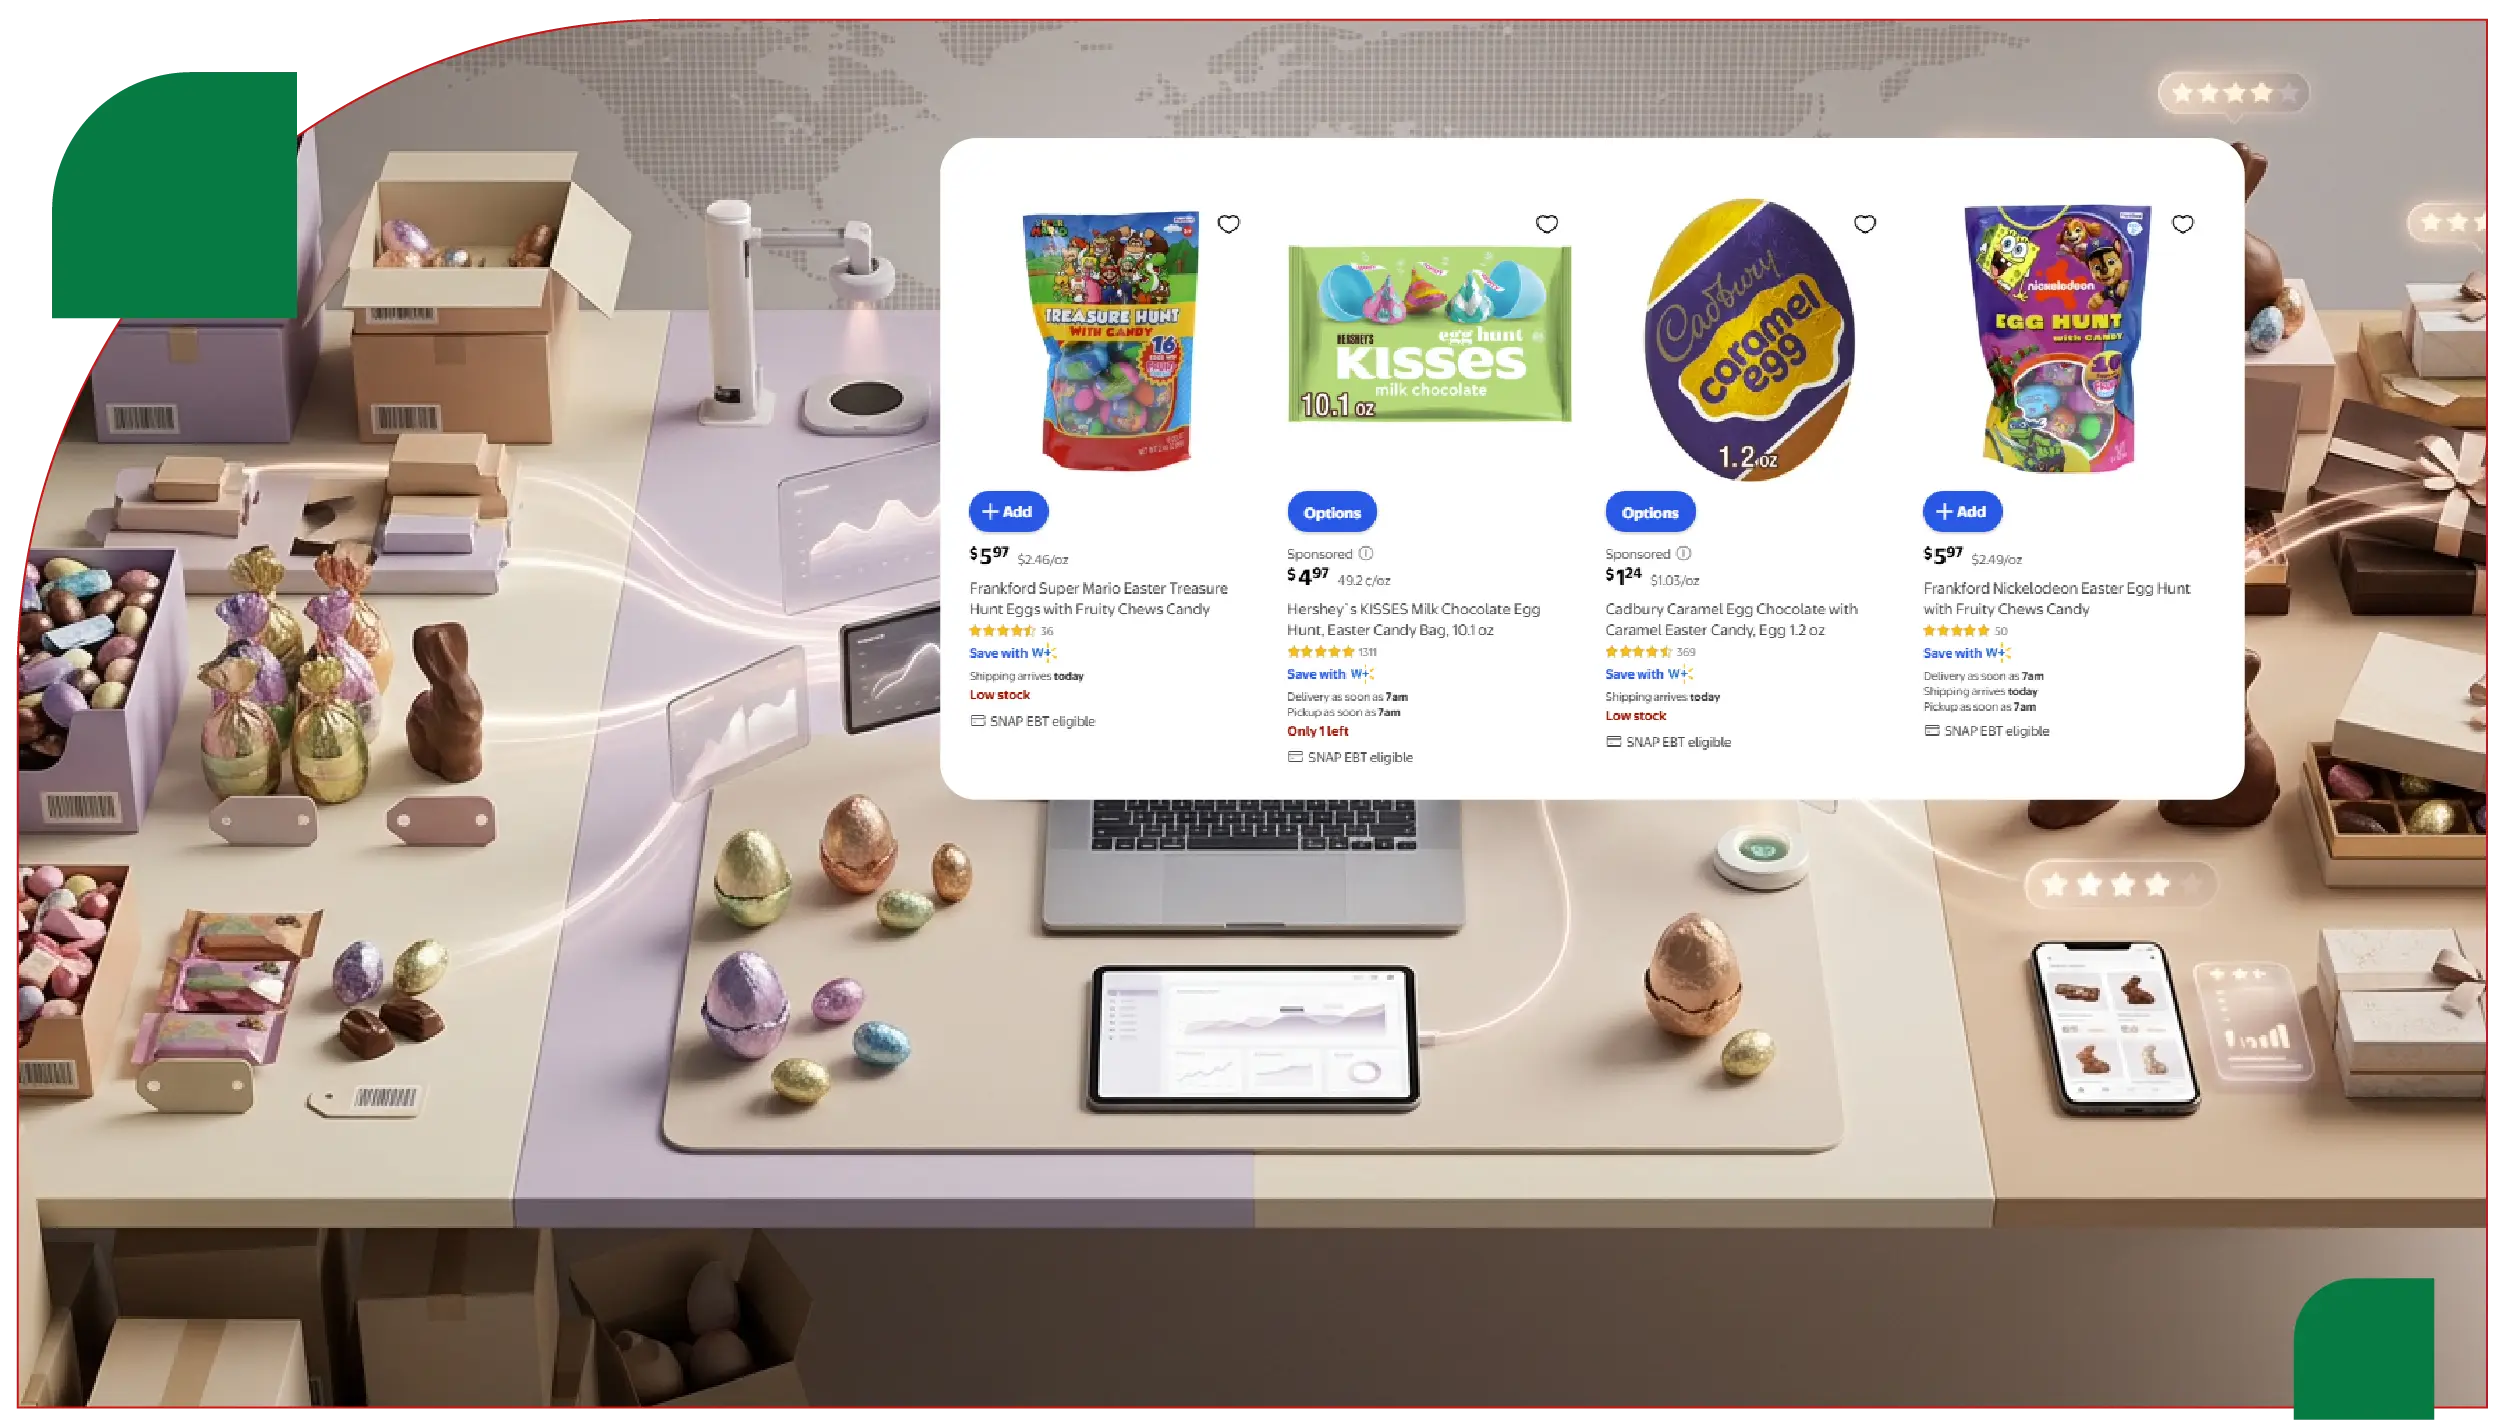
Below is the first major dataset of 2026 Easter candy analysis showing item pricing, availability, and user ratings across Amazon and Walmart for key products:
| Rank | Product Name | Retailer | Price (USD) | Avg. Rating | # Reviews | Stock Status | Seasonal Discount |
|---|---|---|---|---|---|---|---|
| 1 | Cadbury Creme Eggs 24 Pack | Amazon | 18.99 | 4.8 | 19,341 | In Stock | 12% |
| 2 | Cadbury Creme Eggs 24 Pack | Walmart | 17.49 | 4.7 | 12,879 | In Stock | 15% |
| 3 | Reese’s Peanut Butter Eggs 20ct | Amazon | 15.50 | 4.9 | 22,150 | Low Stock | 10% |
| 4 | Reese’s Peanut Butter Eggs 20ct | Walmart | 14.99 | 4.8 | 18,990 | In Stock | 14% |
| 5 | Lindt Gold Bunny 5.29oz | Amazon | 9.99 | 4.6 | 8,123 | In Stock | 8% |
| 6 | Lindt Gold Bunny 5.29oz | Walmart | 9.49 | 4.6 | 7,410 | In Stock | 12% |
| 7 | Hershey’s Easter Assortment | Amazon | 22.99 | 4.5 | 6,890 | Preorder | 5% |
| 8 | Hershey’s Easter Assortment | Walmart | 21.99 | 4.4 | 15,235 | In Stock | 11% |
| 9 | Jelly Beans Bulk 2lb | Amazon | 12.49 | 4.3 | 3,780 | In Stock | 7% |
| 10 | Jelly Beans Bulk 2lb | Walmart | 11.99 | 4.3 | 4,810 | In Stock | 13% |
| 11 | Seasonal Mixed Candy Bag | Amazon | 16.75 | 4.6 | 4,980 | Backorder | 9% |
| 12 | Seasonal Mixed Candy Bag | Walmart | 15.99 | 4.5 | 7,220 | In Stock | 11% |
| 13 | Sugar Free Assorted Eggs | Amazon | 13.50 | 4.0 | 2,115 | In Stock | 5% |
| 14 | Sugar Free Assorted Eggs | Walmart | 12.99 | 4.1 | 4,270 | In Stock | 10% |
| 15 | Novelty Candy Babies | Amazon | 7.99 | 3.8 | 1,230 | In Stock | 3% |
| 16 | Novelty Candy Babies | Walmart | 7.49 | 3.7 | 2,945 | In Stock | 6% |
Source: Extracted inventory and price catalogs (Amazon, Walmart — Q1–Q2 2026)
To uncover purchase patterns, we applied trend extraction on Easter candy weekly velocity across e commerce listings. The following metrics represent seasonal popularity across retail channels.
| Week (March–April 2026) | Amazon Units Sold | Walmart Units Sold | Avg. Price Amazon | Avg. Price Walmart | Promo % Amazon | Promo % Walmart |
|---|---|---|---|---|---|---|
| Week 1 (Mar 1–7) | 38,450 | 52,310 | 15.49 | 14.99 | 8% | 11% |
| Week 2 (Mar 8–14) | 45,120 | 61,940 | 15.29 | 14.79 | 10% | 15% |
| Week 3 (Mar 15–21) | 53,870 | 69,150 | 15.05 | 14.60 | 12% | 17% |
| Week 4 (Mar 22–28) | 62,400 | 75,480 | 14.79 | 14.45 | 15% | 20% |
| Week 5 (Mar 29–Apr 3) | 89,800 | 92,410 | 14.65 | 14.35 | 18% | 22% |
Demand Elasticity:
Brand Penetration:
Fulfillment & Delivery:
Data Variability
Frequent price fluctuations and seasonal inventory changes required an adaptive scraping cadence, ensuring accurate captures of dynamic listings across multiple platforms. Effective Web Scraping Grocery Data enabled consistent, reliable extraction of relevant pricing information.
Ethical Considerations
All extraction processes strictly adhered to retailer robots.txt rules and terms of service. Using a Grocery Delivery Extraction API ensured compliance while maintaining automated, high-volume data collection for accurate seasonal insights without violating platform policies.
Data Integrity
Validation techniques involved cross-referencing API feeds with web captures and anomaly detection, removing inconsistent or erroneous entries. Integration with a Grocery Price Dashboard provided real-time monitoring, highlighting trends and correcting discrepancies efficiently.
This analysis confirms that both Amazon and Walmart are effective channels for Easter candy commerce in 2026, each with distinct strengths:
For future planning, retailers and analysts should prioritize dynamic price monitoring and trend extraction workflows. Businesses can also benefit from integrating a Grocery Price Tracking Dashboard to visualize price movement over time.
Furthermore, generating Grocery Data Intelligence through advanced pipelines will be critical as seasonal demand volatility increases. Combining structured data feeds and user behavior insights will help brands and marketplaces leverage predictive analytics.
Finally, the long term value of accessible Grocery Datasets will extend beyond seasonal products into broader consumer packaged goods forecasting.
Are you in need of high-class scraping services? Food Data Scrape should be your first point of call. We are undoubtedly the best in Food Data Aggregator and Mobile Grocery App Scraping service and we render impeccable data insights and analytics for strategic decision-making. With a legacy of excellence as our backbone, we help companies become data-driven, fueling their development. Please take advantage of our tailored solutions that will add value to your business. Contact us today to unlock the value of your data.

