Whether cozy cafés or large-scale roasteries, coffee businesses can benefit significantly from data analysis. Scraping coffee sales data can help you make informed decisions to boost sales, optimize inventory, and tailor your offerings to customer preferences. Microsoft Excel is a versatile and widely accessible tool for this purpose. In this guide, we'll explore the process of analyzing coffee sales data using Excel and creating a sales dashboard to visualize your insights.
Section 1: Analyzing Coffee Sales with Excel
Step 1: Data Collection and Entry
Analyze coffee sales through data visualization in Excel by gathering your coffee sales data, including the date of sale, coffee type, quantity sold, price, and customer details. Once you've collected the data, enter it into an Excel spreadsheet. Make sure to organize your data with clear headers for each column and remove any duplicates or errors. Let's start by filling in the order sheet with information sourced from the customer and product sheets. We focus on essential details such as the customer's name, email, country, type of coffee, roast level, size, and unit price. To accomplish this, restaurant data scraping uses functions like INDEX and IF to efficiently compile this information.
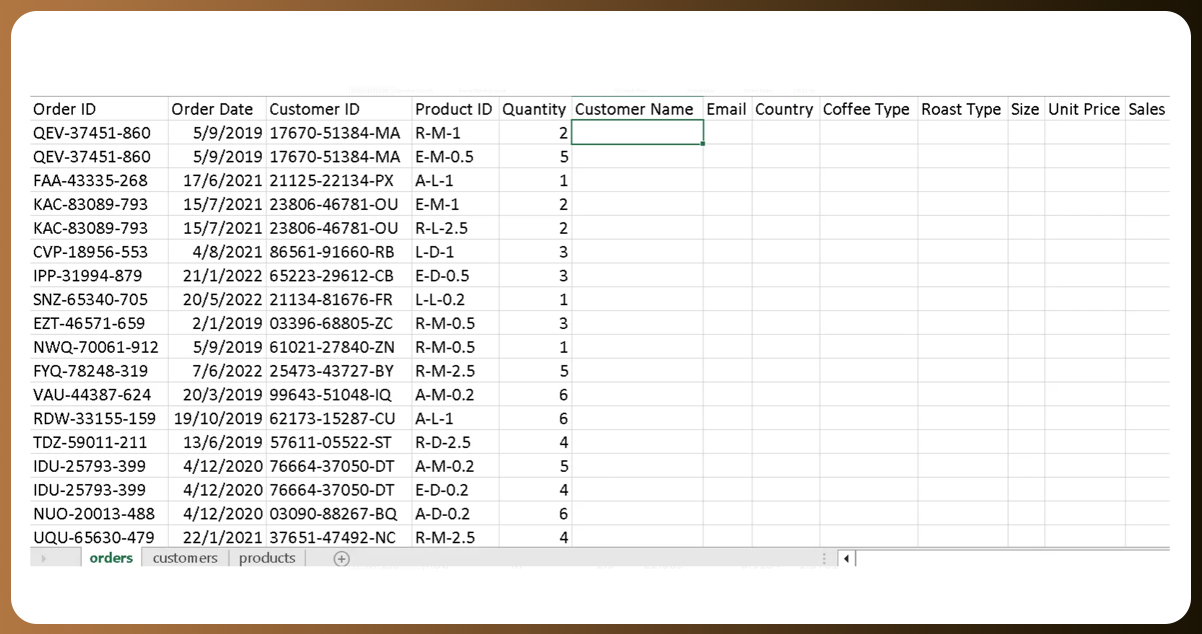
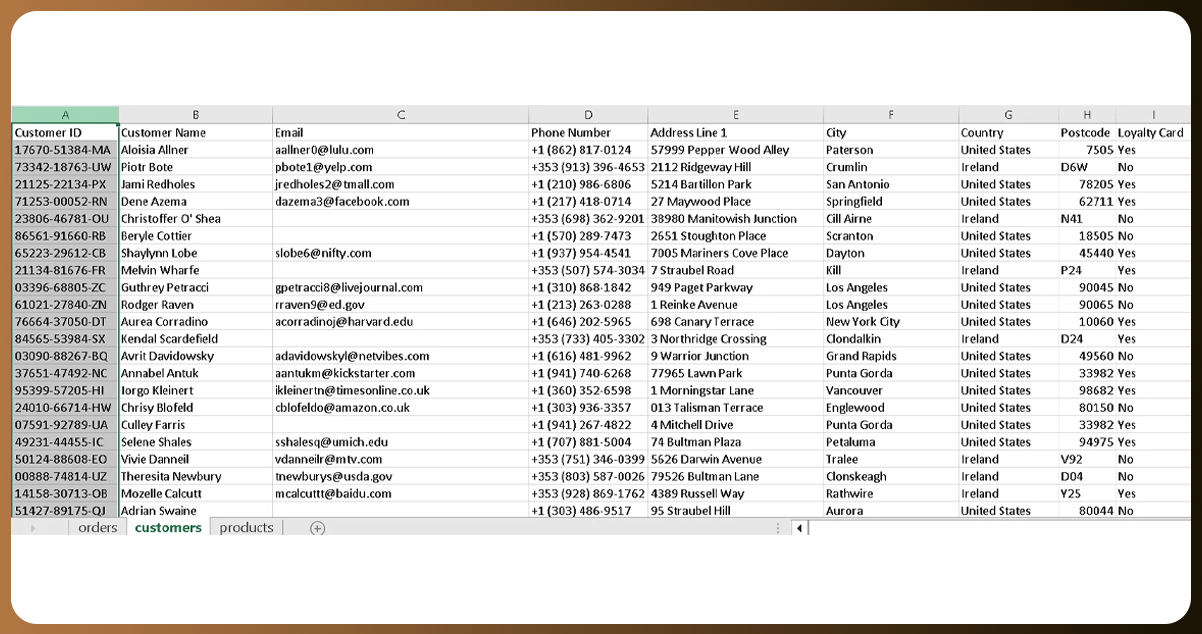
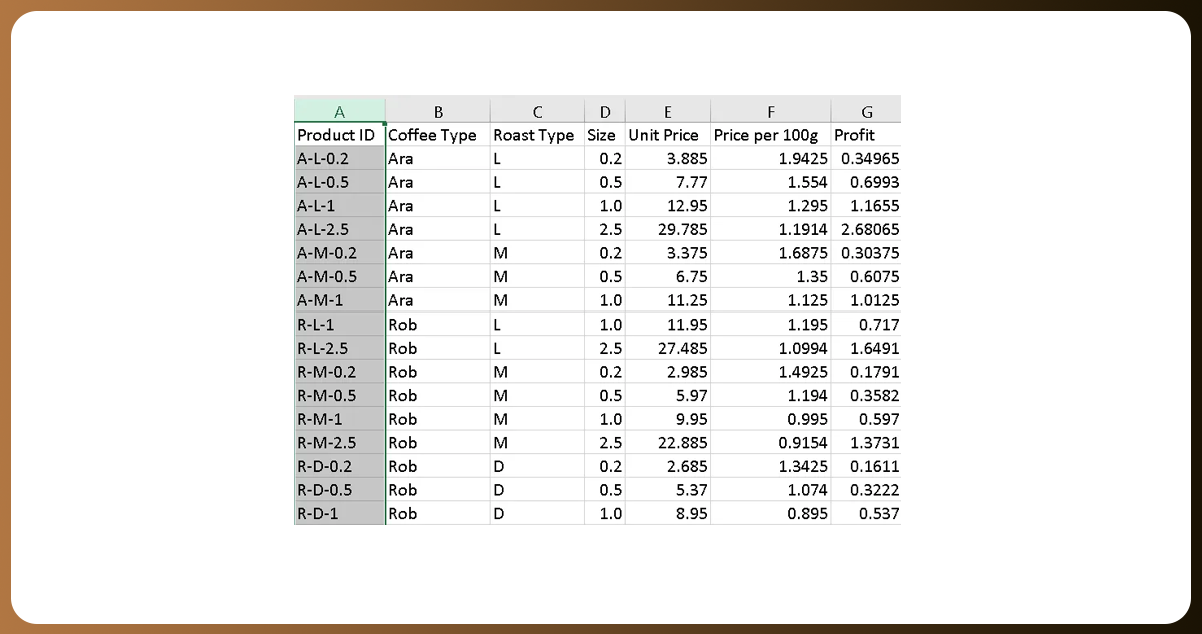
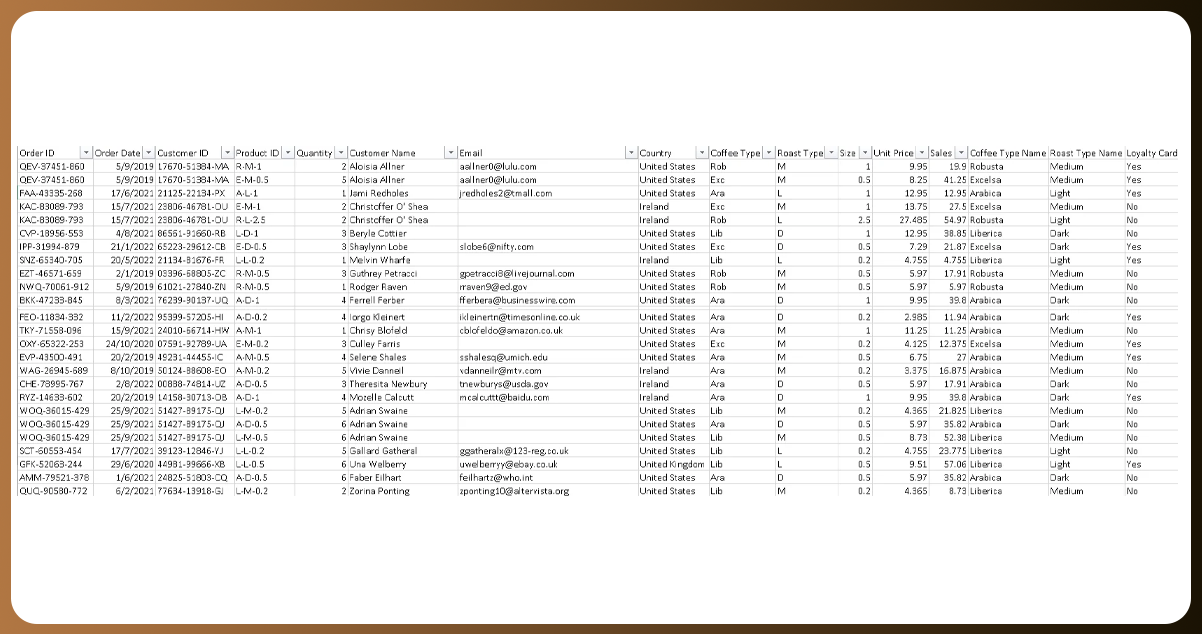
Furthermore, we will compute the sales total by multiplying the quantity by the unit price. To ensure a well-organized dataset, we'll replace any 0 values in the email column with empty fields. Moreover, we'll provide full names for the coffee and roast types to enhance readability. And let's not overlook the loyalty card column; we'll use the INDEX MATCH method to fill it in from the customer sheet, adding more depth to our dataset.
Step 2: Data Cleaning and Formatting
Data accuracy is crucial. Scrape restaurant API data and clean by checking for errors or inconsistencies and format the data consistently. Ensure that dates, currency, and numbers are in the same format throughout the dataset.
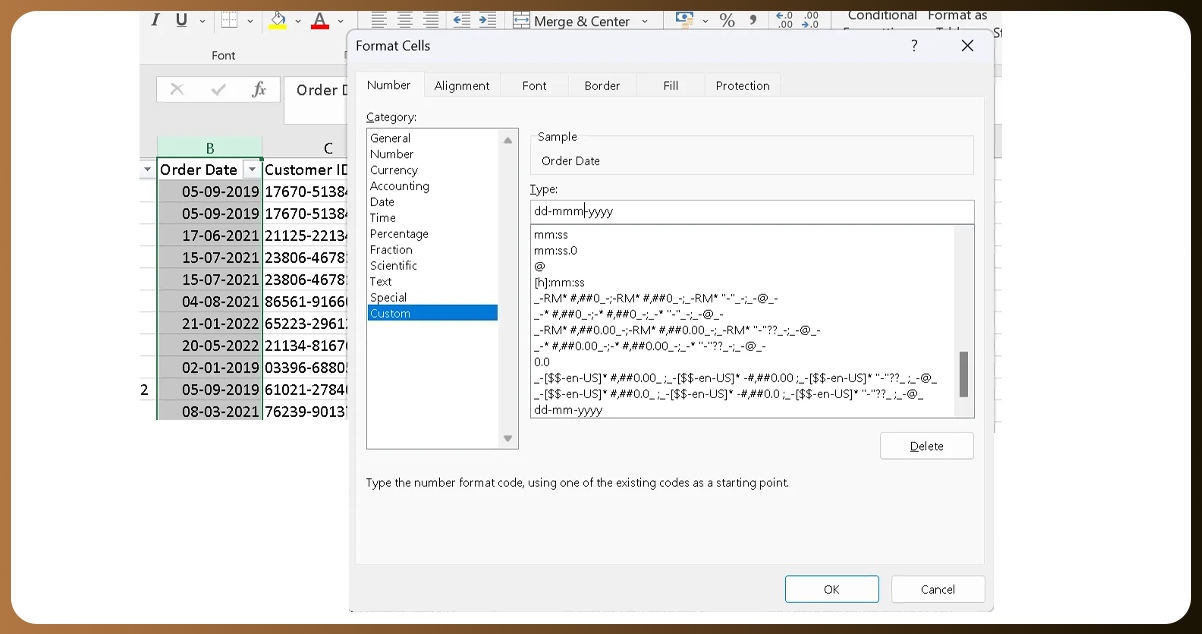
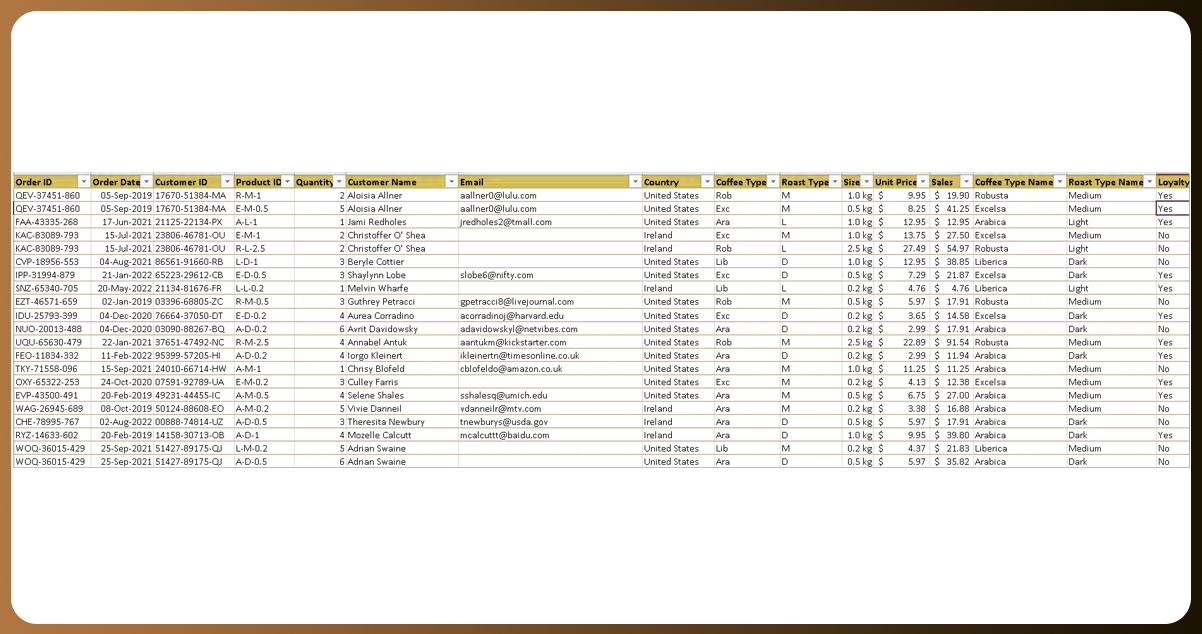
Formatting is crucial! We will arrange the date column in an appealing format (dd-mm-yyyy) and affix "kg" to the size column for clarity. We'll include a currency sign ($) in the unit price and sales columns to give our data a professional appearance.
Step 3: Creating Pivot Tables
Pivot tables are a powerful feature in Excel for data analysis. They allow you to summarize and extract insights from your data quickly. Here's how to create a pivot table:
- Select your data range.
- Go to the "Insert" tab and click on "PivotTable."
- Choose the fields you want to analyze, such as date, coffee type, and quantity sold.
Drag these selected fields into the PivotTable Fields' Rows, Columns, and Values areas.
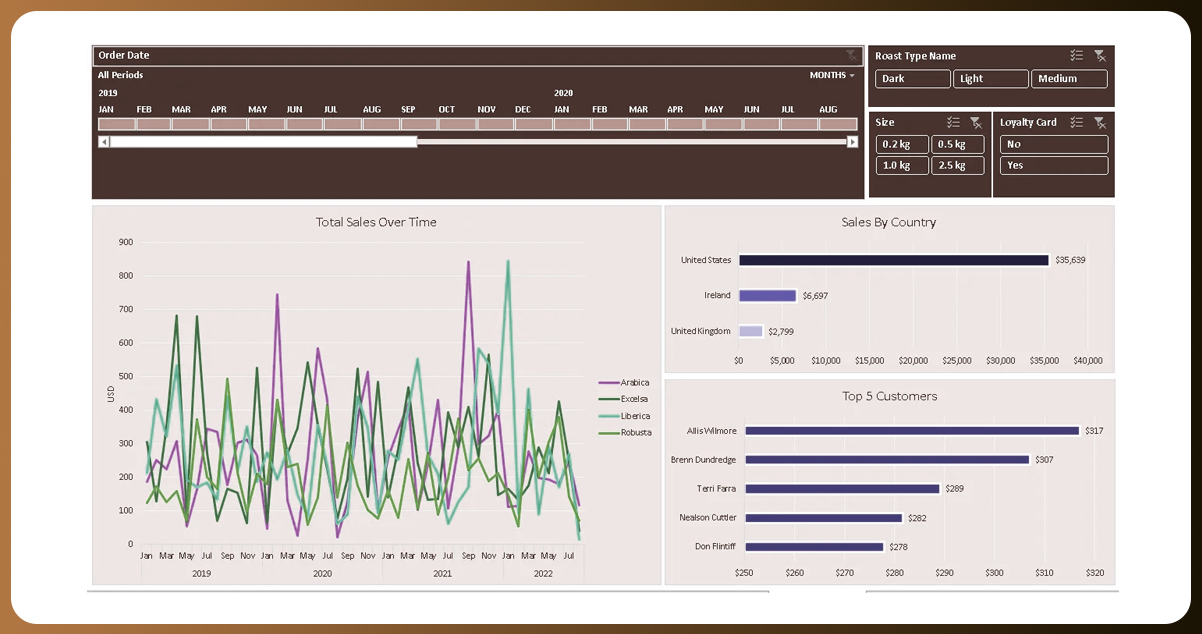
Tracking Total Sales Across Time 📈
Let's create a line graph that displays the cumulative sales for four coffee varieties (Arabica, Excelsa, Liberica, and Robusta) from 2019 to 2022. We'll prioritize interactivity by incorporating date slicers, roast type options, size variations, and loyalty card preferences. This interactive setup allows you to dissect the data and reveal concealed trends.
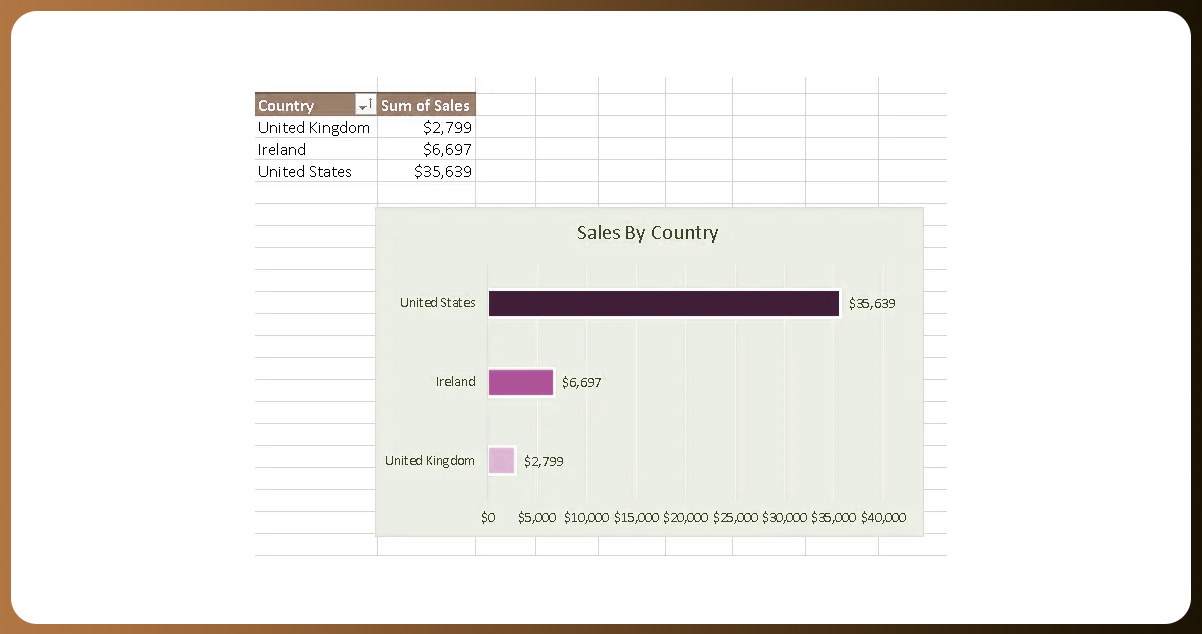
Coffee Sales Across Nations
Our next step involves creating a bar chart highlighting the overall sales in three coffee-enthusiastic countries: the United States, Ireland, and the United Kingdom. This chart provides a quick overview of the coffee consumption patterns in each nation.
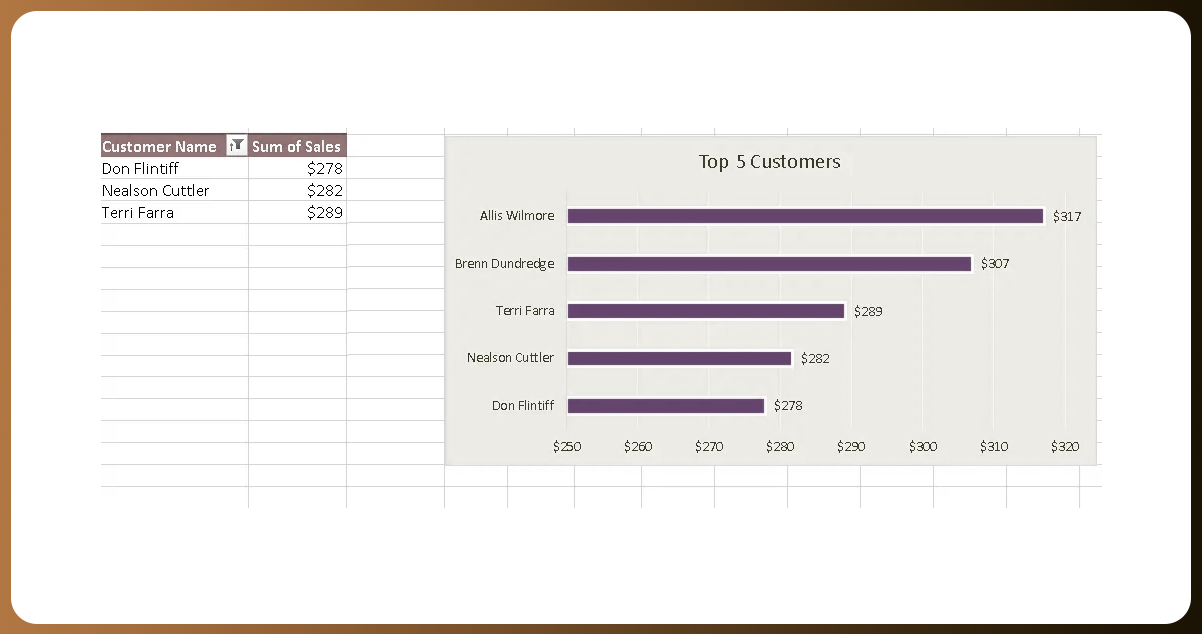
Top 5 Coffee Connoisseurs
Curious about the most dedicated coffee lovers? Our bar chart, showcasing the top 5 customers based on their total coffee purchases, will introduce you to those who have genuinely embraced the coffee culture.
Step 4: Data Visualization
Now that you have a pivot table, it's time to visualize your data. Excel offers various chart types like bar, line, and pie charts. For coffee sales, you can create:
- A bar chart to visualize which coffee types sell the most.
- A line chart to illustrate sales trends over time.
- A pie chart to show the distribution of different coffee types sold.
Step 5: Sales Trends
Use Excel functions like AVERAGE, SUM, or COUNTIF to calculate sales trends over time. For example, calculate the average daily or monthly sales to identify seasonality and adjust inventory accordingly.
Step 6: Customer Analysis
Excel can help you analyze your customers. You can group and segment customers based on their buying patterns and preferences. Identify your top customers and understand what drives their loyalty, which can guide marketing and customer retention strategies.
Step 7: Profit Analysis
Scrape restaurant menu data and calculate profits by multiplying the quantity sold by the price per unit. Excel's SUM function can find the total profit generated during a specific period.
Step 8: Forecasting
Excel offers forecasting tools to predict future sales based on historical data. It can help you prepare for seasonal variations and make informed decisions on inventory and marketing.
Step 9: Filter and Sort
Use Excel's filter and sort functions to focus on specific aspects of your data. You can sort data by sales volume, filter data to see sales from a particular date range or isolate the best-selling coffee types.
Step 10: Conclusion and Recommendations
After conducting your analysis, conclude and make data-driven recommendations. For example, advertise the best-selling coffee type or optimize your stock levels based on sales trends.
Section 2: Building a Sales Dashboard
Creating a sales dashboard in Excel can help you monitor your coffee business's performance at a glance. Here's how to do it:
Step 1: Determine Key Metrics
Identify the key performance indicators (KPIs) you want to track on your dashboard. Common coffee sales KPIs include total revenue, sales by coffee type, and customer demographics.
Step 2: Set Up Data Tables
Organize your data into tables in Excel. Create separate tables for sales, customer data, and other relevant information. It will make it easier to update your dashboard with new data.
Step 3: Design the Dashboard
Use Excel's features to design your dashboard. You can insert charts, graphs, and tables displaying your vital metrics. You can also add slicers and filters to allow for interactive data exploration.
Infusing Creativity, we'll orchestrate our trio of visualizations and their slicers in a harmonious data symphony. This cohesive dashboard will offer an interactive and all-encompassing perspective of the coffee sales landscape.
Step 4: Automate Data Updates
To keep your dashboard current, automate data updates. You can use Excel's data connection features to link your dashboard to your data tables. It ensures that your dashboard reflects real-time data.
Step 5: Test and Refine
Before deploying your dashboard, thoroughly test it to ensure it's accurate and user-friendly. Make any necessary refinements based on feedback and usability.
Step 6: Share and Collaborate
Once your sales dashboard is complete, you can share it with your team for collaborative decision-making. You can also schedule regular updates to keep everyone informed.
Conclusion: Excel is a versatile tool for analyzing coffee sales data and building a sales dashboard. By following the steps outlined in this guide, you can gain valuable insights, make data-driven decisions, and monitor your coffee business's performance dynamically and visually appealingly. It can lead to increased sales, improved customer satisfaction, and a more competitive edge in the coffee market.
For in-depth information, please feel free to contact Food Data Scrape. We serve as your all-in-one solution for Food Data Aggregator and Mobile Grocery App Scraping service. Our cutting-edge insights and analytics empower well-informed decision-making, taking your business strategies to the next level. Don't hesitate to contact us today for success driven by data!
Get a Free Food Data Sample in 48 Hours.
Tell us your platforms, target markets and required fields — we'll map exactly what's possible with food data scraping, recommend the right approach, and send a working sample so you can verify quality before any commitment.
Request a strategy call
Thanks — our data team will reach out within 48 hours with your sample.

