
The Brief: Suburb-Level Resolution for Suburb-Level Decisions
The client — a global QSR brand with established Australian presence — had identified suburb-level expansion as its next growth chapter. Capital-city centres were already saturated; the real opportunity sat in outer suburbs, secondary cities, and regional centres where demographic growth and digital ordering adoption were outpacing restaurant supply.
The challenge was visibility. Standard Australian hospitality data was overwhelmingly Sydney-and-Melbourne-CBD focused. Coverage thinned dramatically beyond inner-ring suburbs and was effectively non-existent in regional centres. Without suburb-level intelligence, the franchise team could not credibly answer the questions that mattered: How many direct and indirect competitors operated in each candidate suburb? Where were the white-space pockets? What pricing was realistic in Penrith versus Surry Hills, or in Joondalup versus Cottesloe? Which regional centres had restaurant supply that lagged residential growth?
Standard sources failed at suburb resolution. National chain directories listed locations but ignored independents. Capital-city research firms offered CBD-quality coverage but limited suburban reach. Existing internal franchise databases were inconsistent across states. The client needed an Australia-wide restaurant database with genuine suburb-level coverage — every outlet in every suburb in every state, attributed and harmonized.
Restaurant Data Intelligence and Food Delivery Intelligence were critical to closing these gaps, enabling suburb-level competitor mapping, pricing analysis, and white-space identification across both metropolitan and regional Australia.
Methodology: How the Suburb-Level Database Was Built

The database rested on a multi-source aggregation and suburb-anchored geocoding methodology specifically designed for the Australian market's vast geographic footprint and mix of metro density and regional sparsity.
- Multi-source aggregation.
Public restaurant listings, delivery platform listings (Uber Eats, DoorDash, Menulog), chain corporate directories, mapping service data, and review platform records were combined into a single harmonized layer. Each source was tagged so analysts could trace any record back to its origin. - Suburb-level geocoding.
Every outlet was geocoded to a specific suburb using Australian Bureau of Statistics suburb boundaries rather than free-text address parsing. This deliberate choice ensured that "Burwood" in Sydney did not collide with "Burwood" in Melbourne, and that suburb-level analytics were statistically clean. - Outlet-level deduplication.
A four-stage deduplication pipeline matched outlets by name similarity, address parsing, GPS proximity within a defined radius, and operating-hours overlap. Duplicates from multi-source aggregation were collapsed into a single canonical record per physical location. - Operator and chain attribution.
Each outlet was matched to a parent operator where applicable. Recognized national chains, state-level chains, multi-site independents, and standalone independents were each classified explicitly — enabling chain-versus-independent analysis at suburb resolution. - Menu capture.
Where menu data was publicly available, dish-level records — name, description, price in AUD, category, dietary flags — were captured and linked to the parent outlet. - Cuisine taxonomy.
Each outlet was mapped into a harmonized cuisine taxonomy spanning Australian modern, Italian, Asian (with regional sub-categories — Chinese, Japanese, Korean, Thai, Vietnamese, Indian), Mediterranean, Middle Eastern, American casual, cafe and bakery, dessert and beverage specialists, fine dining, and emerging categories. - Refresh cadence.
Top-velocity outlets and recent openings refreshed weekly; long-tail and regional outlets refreshed monthly. New openings and closures triggered near-real-time updates where signal strength allowed. - Quality assurance.
Every record passed schema validation, suburb-boundary verification, operator-attribution audit, menu-link verification, and outlier detection before reaching client systems.
Sample Data: What the Database Captured
The following sample tables illustrate the structure and depth of the Australian Restaurant Database.
Sample 1: Restaurant Density by State / Territory
| State / Territory | Total Outlets | Chains | Independents | Independent Share |
|---|---|---|---|---|
| New South Wales | 28,400 | 8,900 | 19,500 | 68.7% |
| Victoria | 24,100 | 7,800 | 16,300 | 67.6% |
| Queensland | 17,300 | 5,900 | 11,400 | 65.9% |
| Western Australia | 9,800 | 3,400 | 6,400 | 65.3% |
| South Australia | 7,200 | 2,500 | 4,700 | 65.3% |
| Tasmania | 1,900 | 600 | 1,300 | 68.4% |
| ACT | 1,500 | 500 | 1,000 | 66.7% |
| Northern Territory | 800 | 300 | 500 | 62.5% |
Sample 2: Cuisine Mix Across Australia
| Cuisine Category | Active Outlets | Share of Total |
|---|---|---|
| Australian Modern / Cafe | 18,900 | 22.0% |
| Italian / Pizza | 11,200 | 13.0% |
| Chinese | 9,400 | 10.9% |
| Asian (Pan-Asian / Fusion) | 7,800 | 9.1% |
| Indian | 6,100 | 7.1% |
| Japanese / Sushi | 5,600 | 6.5% |
| Thai | 4,800 | 5.6% |
| Vietnamese | 3,700 | 4.3% |
| Middle Eastern | 3,200 | 3.7% |
| Korean | 2,100 | 2.4% |
| Other | 13,200 | 15.4% |
Sample 3: Suburb-Level Pricing Benchmarks (Casual-Dining Main Course in AUD)
| Suburb Type | Sydney | Melbourne | Brisbane | Perth |
|---|---|---|---|---|
| CBD | $26.40 | $24.80 | $22.60 | $23.10 |
| Inner-Ring Suburb | $24.20 | $22.90 | $20.40 | $21.30 |
| Middle-Ring Suburb | $20.10 | $19.40 | $17.80 | $18.20 |
| Outer Suburb | $17.50 | $16.90 | $16.20 | $16.50 |
| Regional Centre | $19.20 | $18.40 | $17.10 | $17.40 |
Sample 4: Outer-Suburb White-Space Sample (Sydney)
| Suburb | Outlet Count | Cuisine Concentration | Opportunity Signal |
|---|---|---|---|
| Penrith | 184 | Australian + Italian heavy | Emerging — Asian gap |
| Liverpool | 220 | Asian-heavy | Saturated Asian, café gap |
| Campbelltown | 152 | Australian + Cafe | Opportunity — QSR gap |
| Blacktown | 198 | Asian + Italian | Emerging — cafe gap |
| Hornsby | 168 | Australian + Cafe | Opportunity — Asian gap |
Sample 5: Regional Centre Coverage Sample
| Regional Centre | State | Outlets | Independent Share |
|---|---|---|---|
| Newcastle | NSW | 1,420 | 71% |
| Wollongong | NSW | 1,180 | 70% |
| Gold Coast | QLD | 3,200 | 64% |
| Sunshine Coast | QLD | 1,850 | 68% |
| Geelong | VIC | 980 | 70% |
| Hobart | TAS | 720 | 69% |
| Cairns | QLD | 540 | 67% |
These tables represent a portion of the full Australian dataset, which captured outlet, operator, menu, pricing, and suburb-level detail across every state and territory.
Key Findings
The database surfaced several findings that directly shaped the client's franchise expansion strategy.
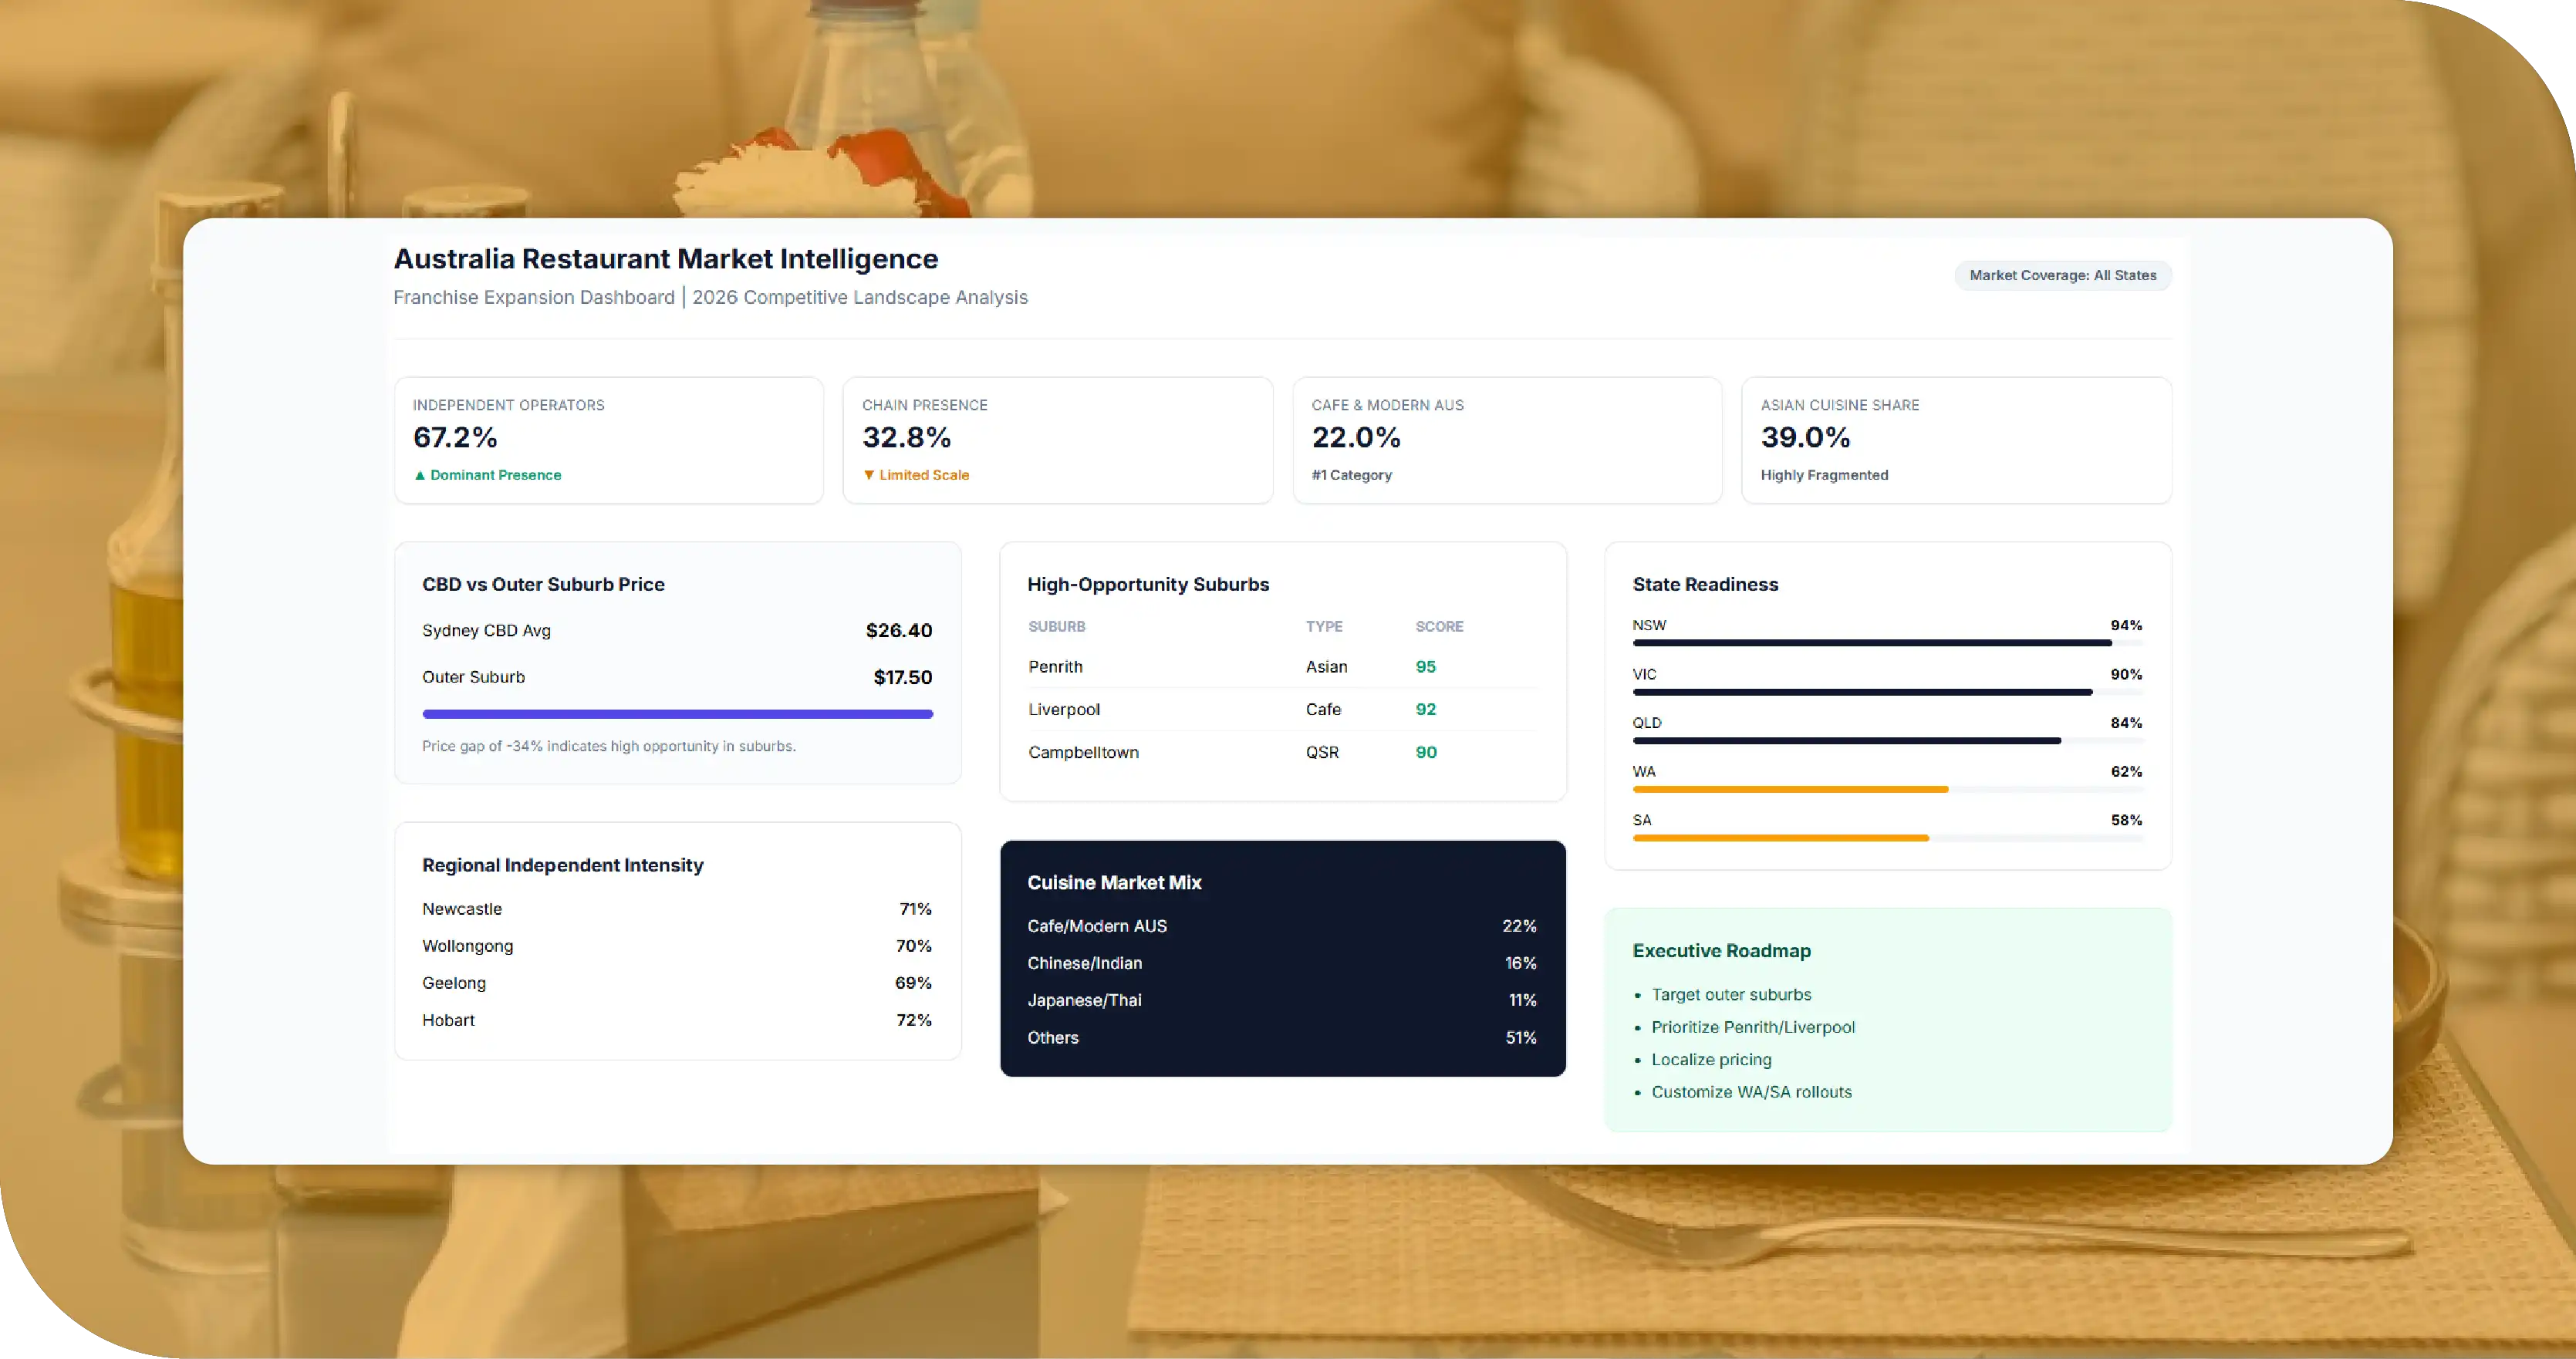
- Independent operators dominate every Australian state. Independent shares clustered around 65 to 69 percent nationally — meaningfully higher than visible chain presence suggested. For a QSR brand entering new suburbs, independents formed the real competitive set, not other chains.
- Pricing falls sharply from CBD to outer suburbs. Sydney casual-dining mains averaged $26.40 in the CBD versus $17.50 in outer suburbs — a 34 percent drop. Melbourne and Brisbane showed similar gradients. The data confirmed that outer-suburb pricing strategy could not be imported from CBD pricing assumptions.
- Outer-suburb cuisine gaps are sharp and exploitable. The database flagged consistent cuisine gaps in outer-Sydney suburbs (Asian-cuisine gap in Penrith, café gap in Liverpool, QSR gap in Campbelltown). For a QSR brand, these gaps represented direct opportunity to enter under-served suburbs at favourable competitive economics.
- Regional centres outpace expectations on independent share. Newcastle, Wollongong, Geelong, and Hobart all showed independent shares above 69 percent — higher than equivalent capital-city outer suburbs. This signalled deeper local-operator presence and stronger competitive intensity than the chain saw on first inspection.
- Cafe and Australian modern is the dominant national category. With 22 percent of total outlets, cafe and Australian modern was Australia's distinctive category fingerprint — a structural feature with no direct equivalent in most other markets the client operates in.
- Asian categories are more fragmented than expected. Chinese, Pan-Asian, Indian, Japanese, Thai, and Vietnamese together formed nearly 39 percent of outlets, but no single Asian category had a dominant national chain. This signalled strong local operator depth and meaningful pricing differentiation within categories.
- Western Australia and South Australia warrant a different operational model. Both states had lower chain density and longer distances between candidate suburbs, suggesting that the client's standard franchise rollout cadence would need adjustment for these markets.
How the Client Used the Findings
Armed with the Australian Restaurant Database, the client made three concrete decisions.
First, they re-sequenced expansion priorities away from CBD-adjacent locations toward outer-suburb cuisine gaps. The franchise team built its 36-month rollout around these suburbs first.
Second, they built suburb-tier pricing rather than CBD-led pricing. Recognizing the 30-plus percent gap between CBD and outer-suburb pricing, the client designed a tiered menu pricing structure that protected margin in CBD locations and stayed competitive in outer suburbs.
Third, they adjusted Western Australia and South Australia rollout cadence. Instead of forcing eastern-state cadence on WA and SA, the client built state-specific rollout plans aligned to local restaurant market structure.
The result was a franchise expansion program anchored to suburb-level competitive evidence rather than CBD-led assumptions — exactly the outcome the engagement was designed to deliver.
Why the Data Approach Mattered
The alternative to a suburb-resolution database would have been the traditional approach: capital-city-CBD-led research, broker estimates, and franchisee anecdote. That approach would have led the client toward saturated inner-ring locations and away from genuinely under-served outer suburbs and regional centres.
The Australian Restaurant Database changed the decision entirely. By providing suburb-level resolution across every state, the database identified opportunities and risks no amount of CBD-led research would have surfaced. This is the core value of suburb-precise restaurant data: it replaces metro-level averages with the granularity that suburb-level franchise decisions actually require.
Lessons for Other Markets
While this engagement focused on Australia, the methodology and its lessons transfer directly to any geographically dispersed national market.
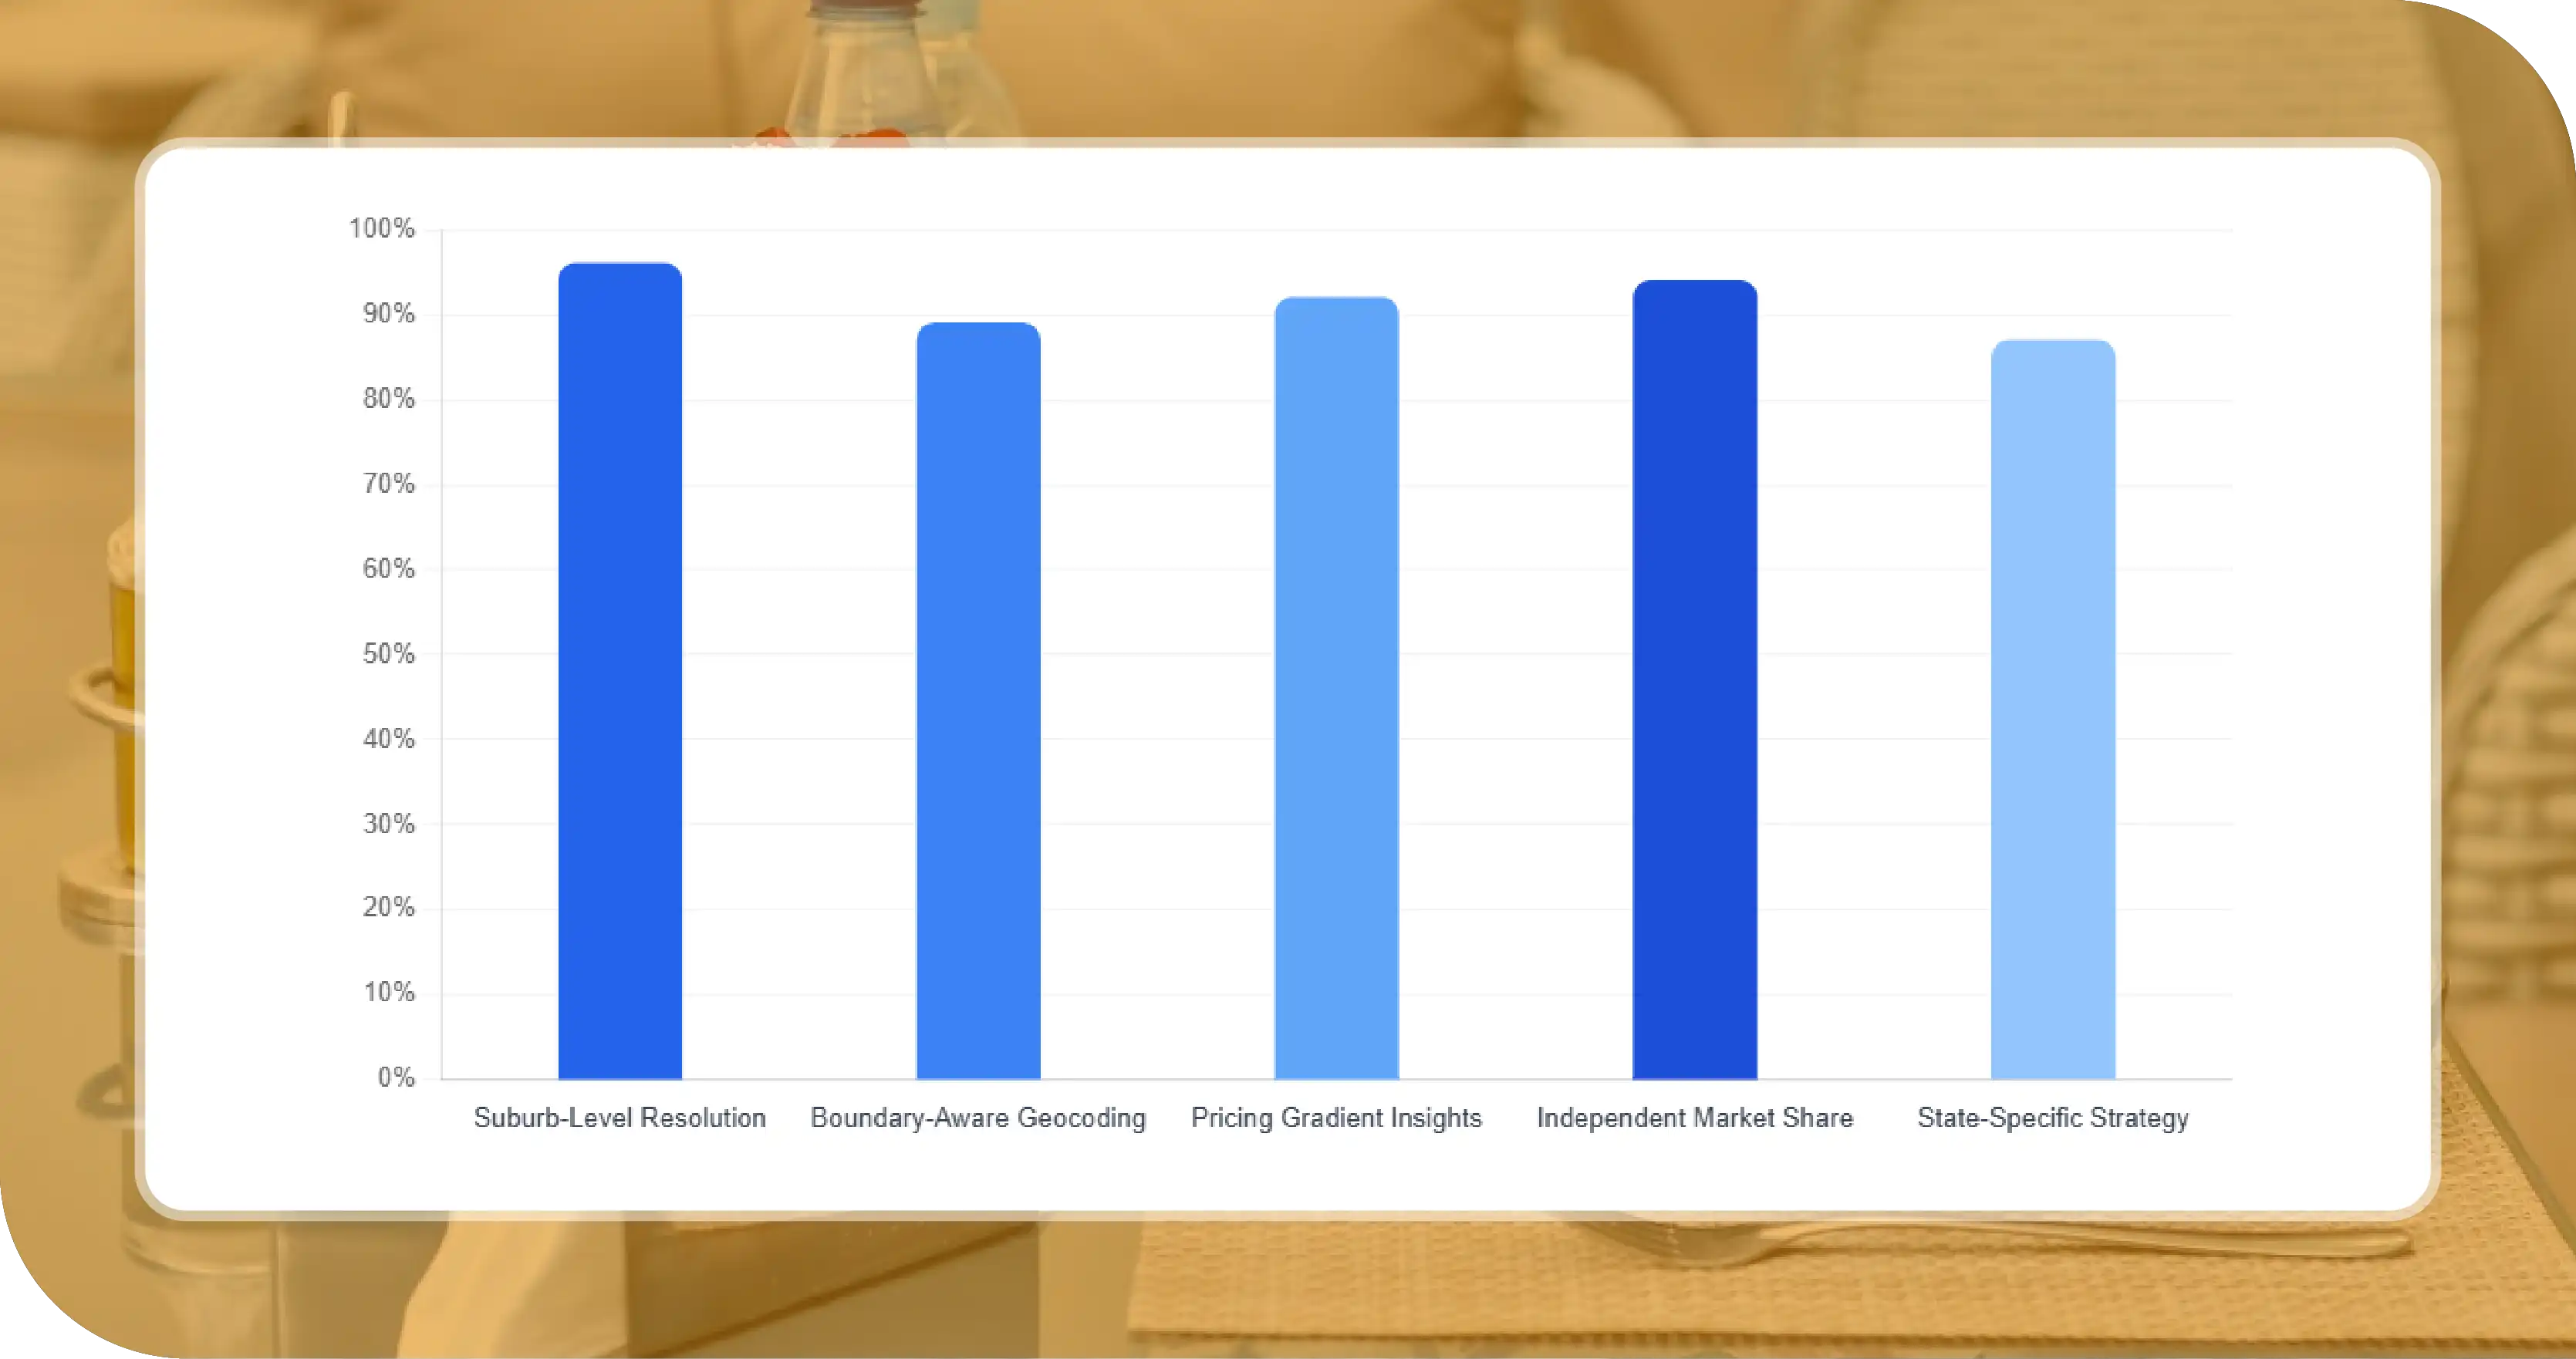
- Suburb-level resolution unlocks suburban opportunity. Strategies built on metro-level averages systematically miss suburban opportunity.
- Geographic boundaries beat free-text addresses. Using official suburb boundaries eliminates naming collisions.
- Pricing gradients from centre to periphery are sharp and exploitable. Most large metros show 25 to 40 percent pricing gradients.
- Independents anchor suburban and regional markets. Independent share rises in outer suburbs and regional centres.
- State-level dynamics demand state-specific strategy. State-by-state strategy almost always outperforms national-template strategy.
These lessons illustrate why suburb-precise, operator-attributed restaurant data repays its cost many times over.
Engagement Outcomes at a Glance
The table below summarizes the measurable outcomes the client attributed to the database within the first year of its Australian expansion program.
| Outcome Area | Before the Database | After Acting on the Database |
|---|---|---|
| Geographic focus | CBD and inner-ring | Outer-suburb white space prioritized |
| Pricing structure | National template | Three suburb tiers + regional adjustment |
| State rollout cadence | Uniform national pace | WA and SA pacing adjusted |
| Competitive analysis | Chain-focused | Chain + independent + cuisine-gap-aware |
| Franchise conversion | Broker-dependent | Data-led territory targeting |
The engagement converted a CBD-led expansion thesis into a disciplined, suburb-level, state-aware franchise rollout — and gave the client an ongoing reference dataset for every future Australian decision.
Why Choose Food Data Scrape
Building a nationwide Australian restaurant database with genuine suburb-level resolution is a specialized undertaking. It requires multi-source aggregation across public listings, delivery platforms, mapping services, and corporate directories; rigorous deduplication; boundary-aware geocoding tied to Australian Bureau of Statistics suburb definitions; operator-attribution logic; menu capture in AUD; harmonized cuisine taxonomy; and sustained refresh capacity to keep pace with industry churn across a vast geographic footprint. Most internal teams and most generalist data providers lack the suburb-resolution capability that makes such a database actually useful for franchise expansion.
We bring managed infrastructure, ethical and compliant data collection practices, and deep domain expertise in restaurant and food-service data. Advantages include compliance-first architecture, scalable extraction across millions of public pages daily, boundary-aware geocoding, operator-attribution logic, harmonized cuisine taxonomies, fully customizable refresh cadence, dedicated analyst support familiar with Australian restaurant market dynamics, and out-of-the-box dashboards highlighting suburb-by-suburb density, cuisine concentration, pricing tiers, and competitive gaps. The team has supported QSR chains, hospitality investors, franchise groups, FMCG suppliers, real estate developers, and research consultancies — bringing the practical experience of how comprehensive restaurant data and Food Datasets drive real commercial outcomes.
Conclusion
The Australia Restaurant Database Case Study demonstrates how suburb-resolution restaurant data transforms a national franchise expansion program. By capturing every meaningful outlet across every state and resolving them to specific suburbs, the database revealed where competition concentrated, where the client's QSR concept had genuine white space, what pricing was realistic by suburb tier, and which states warranted distinct operational models. The client launched its 36-month franchise expansion with a plan grounded in suburb-level evidence, not CBD-led assumption.
For any QSR chain, franchise group, real estate developer, or investor evaluating Australian restaurant markets, the lesson is consistent: structured, suburb-precise restaurant data turns expansion from a series of metro-level guesses into a disciplined commercial program.
If you are ready to base your next Australian expansion decision on suburb-level ground-truth data, get in touch with our team today.

