The Client
The client is an India-based retail intelligence firm specializing in grocery analytics and quick-commerce insights. They support supermarket chains, FMCG brands, and market analysts by providing actionable intelligence on pricing, promotions, and product assortments across multiple cities. To stay competitive in the fast-growing online grocery sector, the client needed access to structured, real-time Blinkit data. By leveraging our method to Scrape Blinkit Deals, Prices, SKUs & Barcode Data, they automated tracking of thousands of SKUs, ensuring consistency, accuracy, and timely updates. With our Blinkit Grocery Product, Price & Barcode Data Extraction, the client monitored price fluctuations, promotions, and inventory changes across categories efficiently. Additionally, the ability to Web Scraping Blinkit Grocery Data with Barcode Details enabled deep insights into product availability, pricing trends, and category performance. This collaboration reduced manual effort, enhanced reporting accuracy, and empowered the client to make data-driven pricing, merchandising, and promotional decisions in India’s dynamic quick-commerce grocery market.
Key Challenges
- Data Fragmentation Across Categories
The client faced challenges consolidating thousands of SKUs across categories, regions, and promotions. Without a reliable Blinkit Grocery Delivery Dataset, maintaining accurate, consistent data required extensive manual effort and often resulted in delays and incomplete market visibility. - Real-Time Tracking Limitations
Frequent updates, new product launches, and promotional changes made manual monitoring inefficient. The absence of a robust Scrape Online Blinkit Grocery Delivery App Data solution slowed insight generation, limiting the client’s ability to react quickly to market and competitive shifts. - Scalability and Operational Bottlenecks
Handling large-scale data collection across multiple cities and categories was resource-intensive. Without an automated Blinkit Grocery Delivery Scraping API, the client struggled to maintain historical datasets, expand coverage, and deliver consistent, actionable intelligence for strategic decision-making.
Key Solutions
- Automated Multi-Source Data Collection
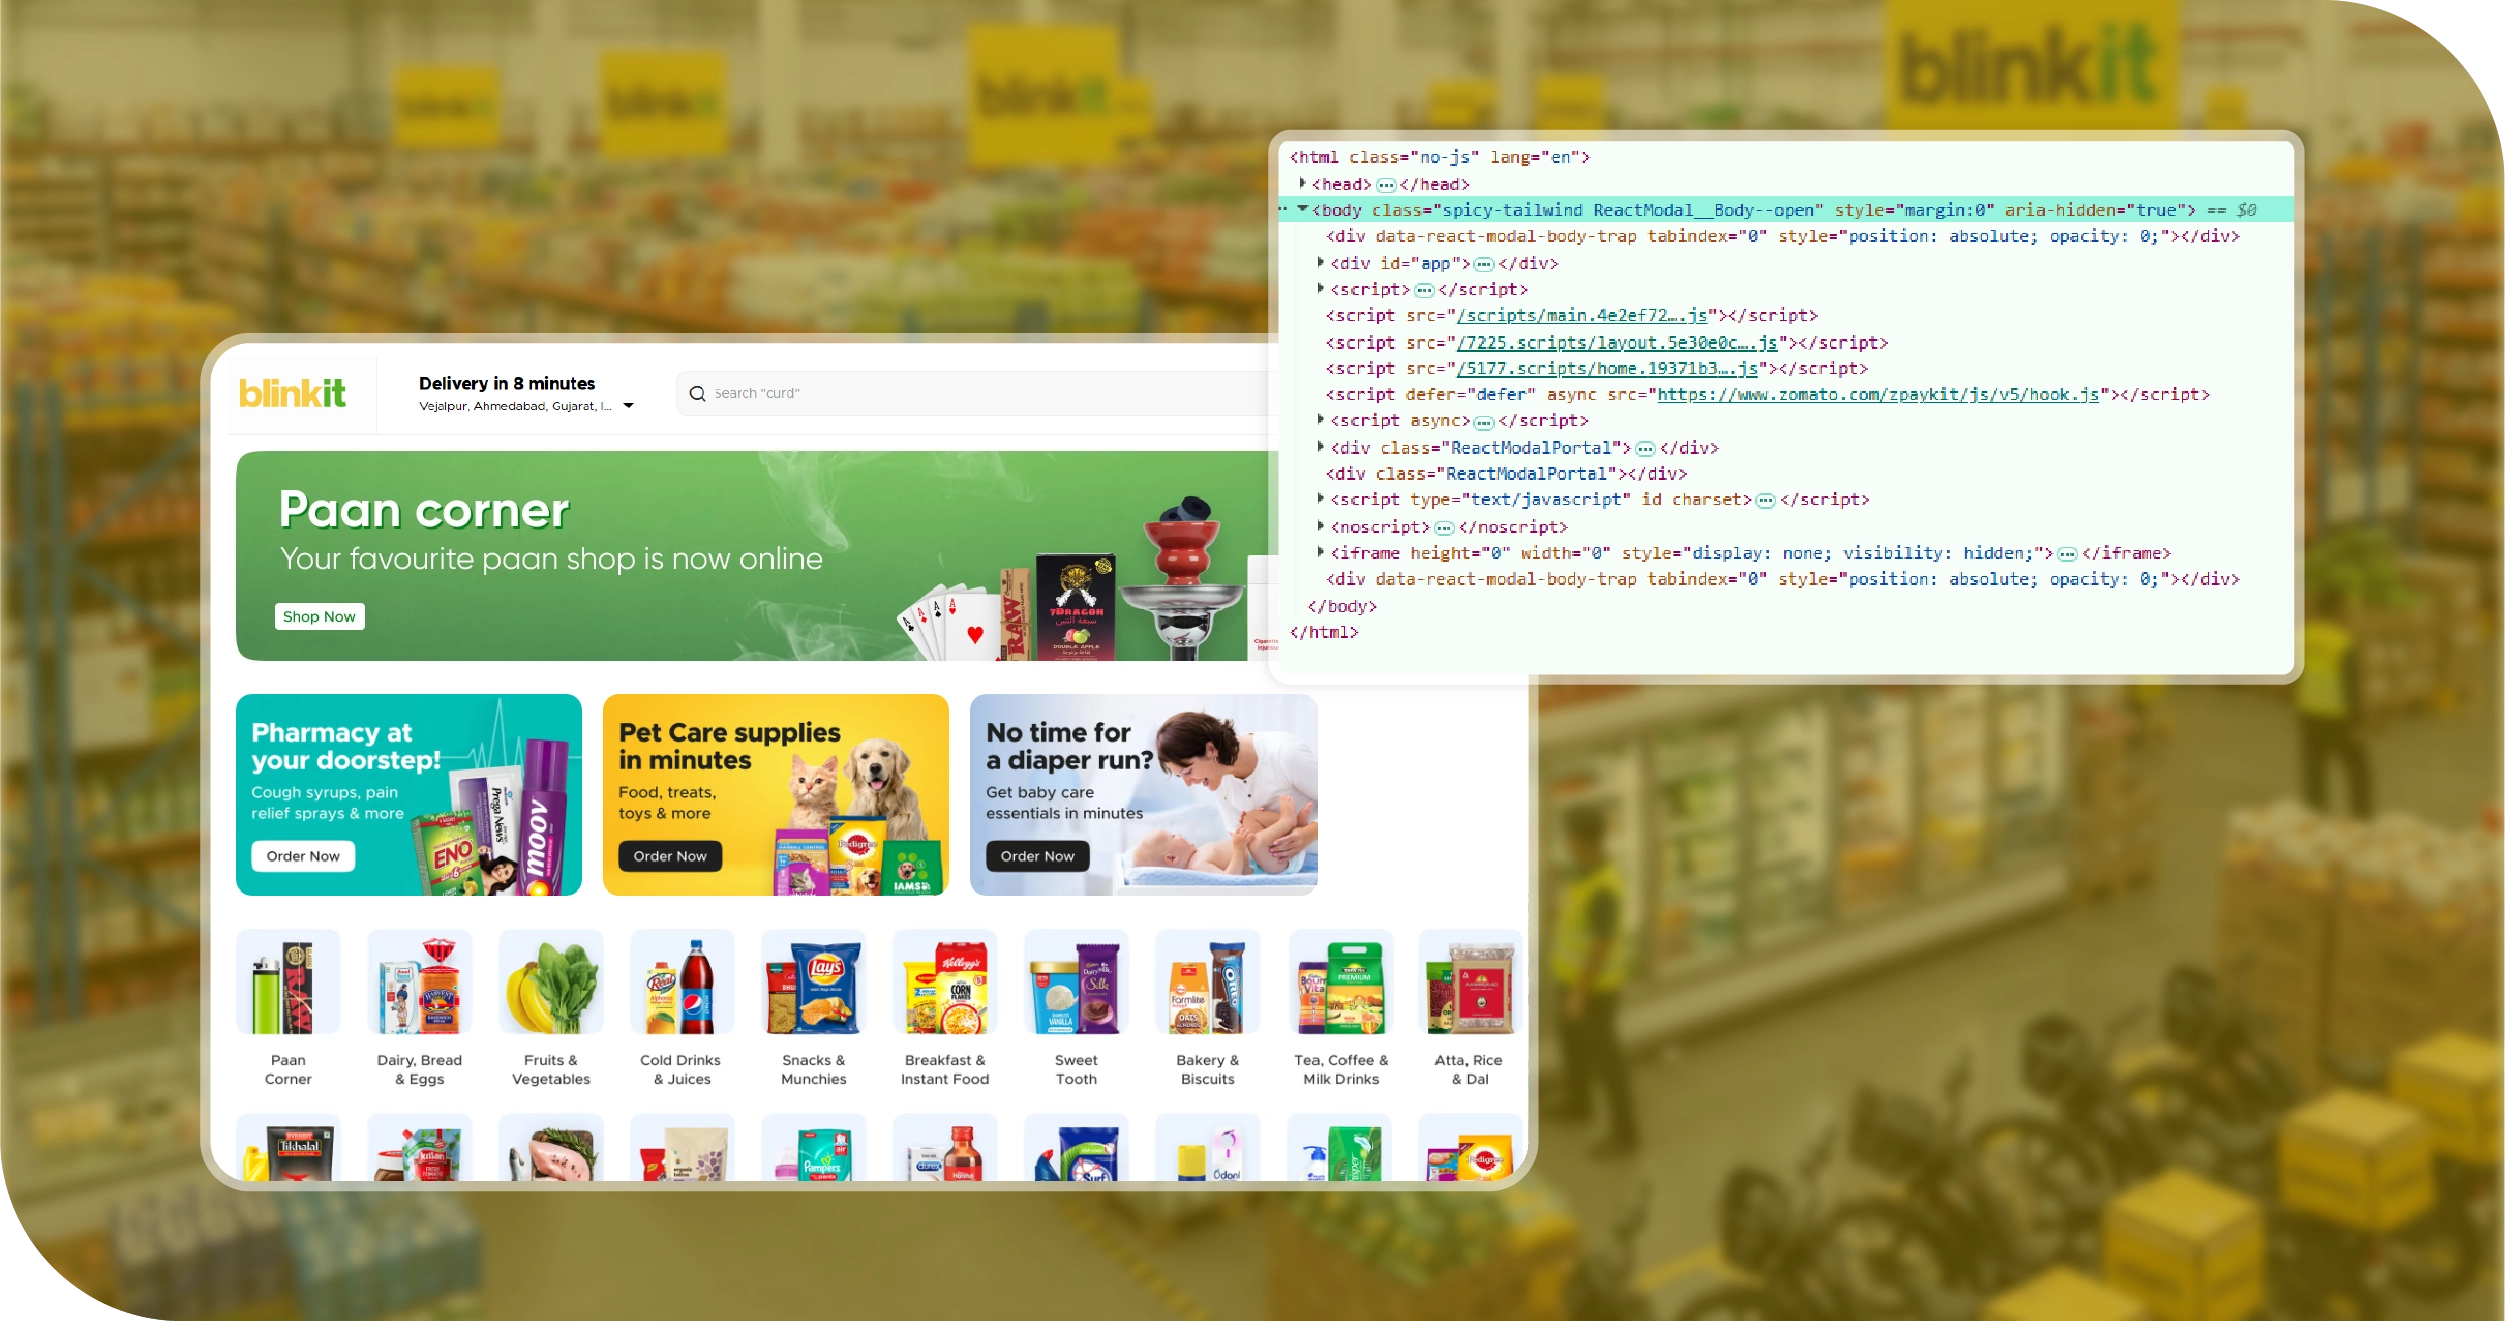
We implemented Grocery App Data Scraping services to capture product, price, SKU, and barcode data from Blinkit in real-time. This eliminated manual effort, ensured consistency, and enabled scalable coverage across all categories and cities for accurate market intelligence. - Real-Time Monitoring and Integration
Using Grocery Delivery Scraping API Services, we automated continuous updates of prices, promotions, and product availability. The solution allowed the client to track changes immediately, detect pricing gaps, and maintain up-to-date, actionable datasets for decision-making and reporting. - Visualization and Trend Analysis
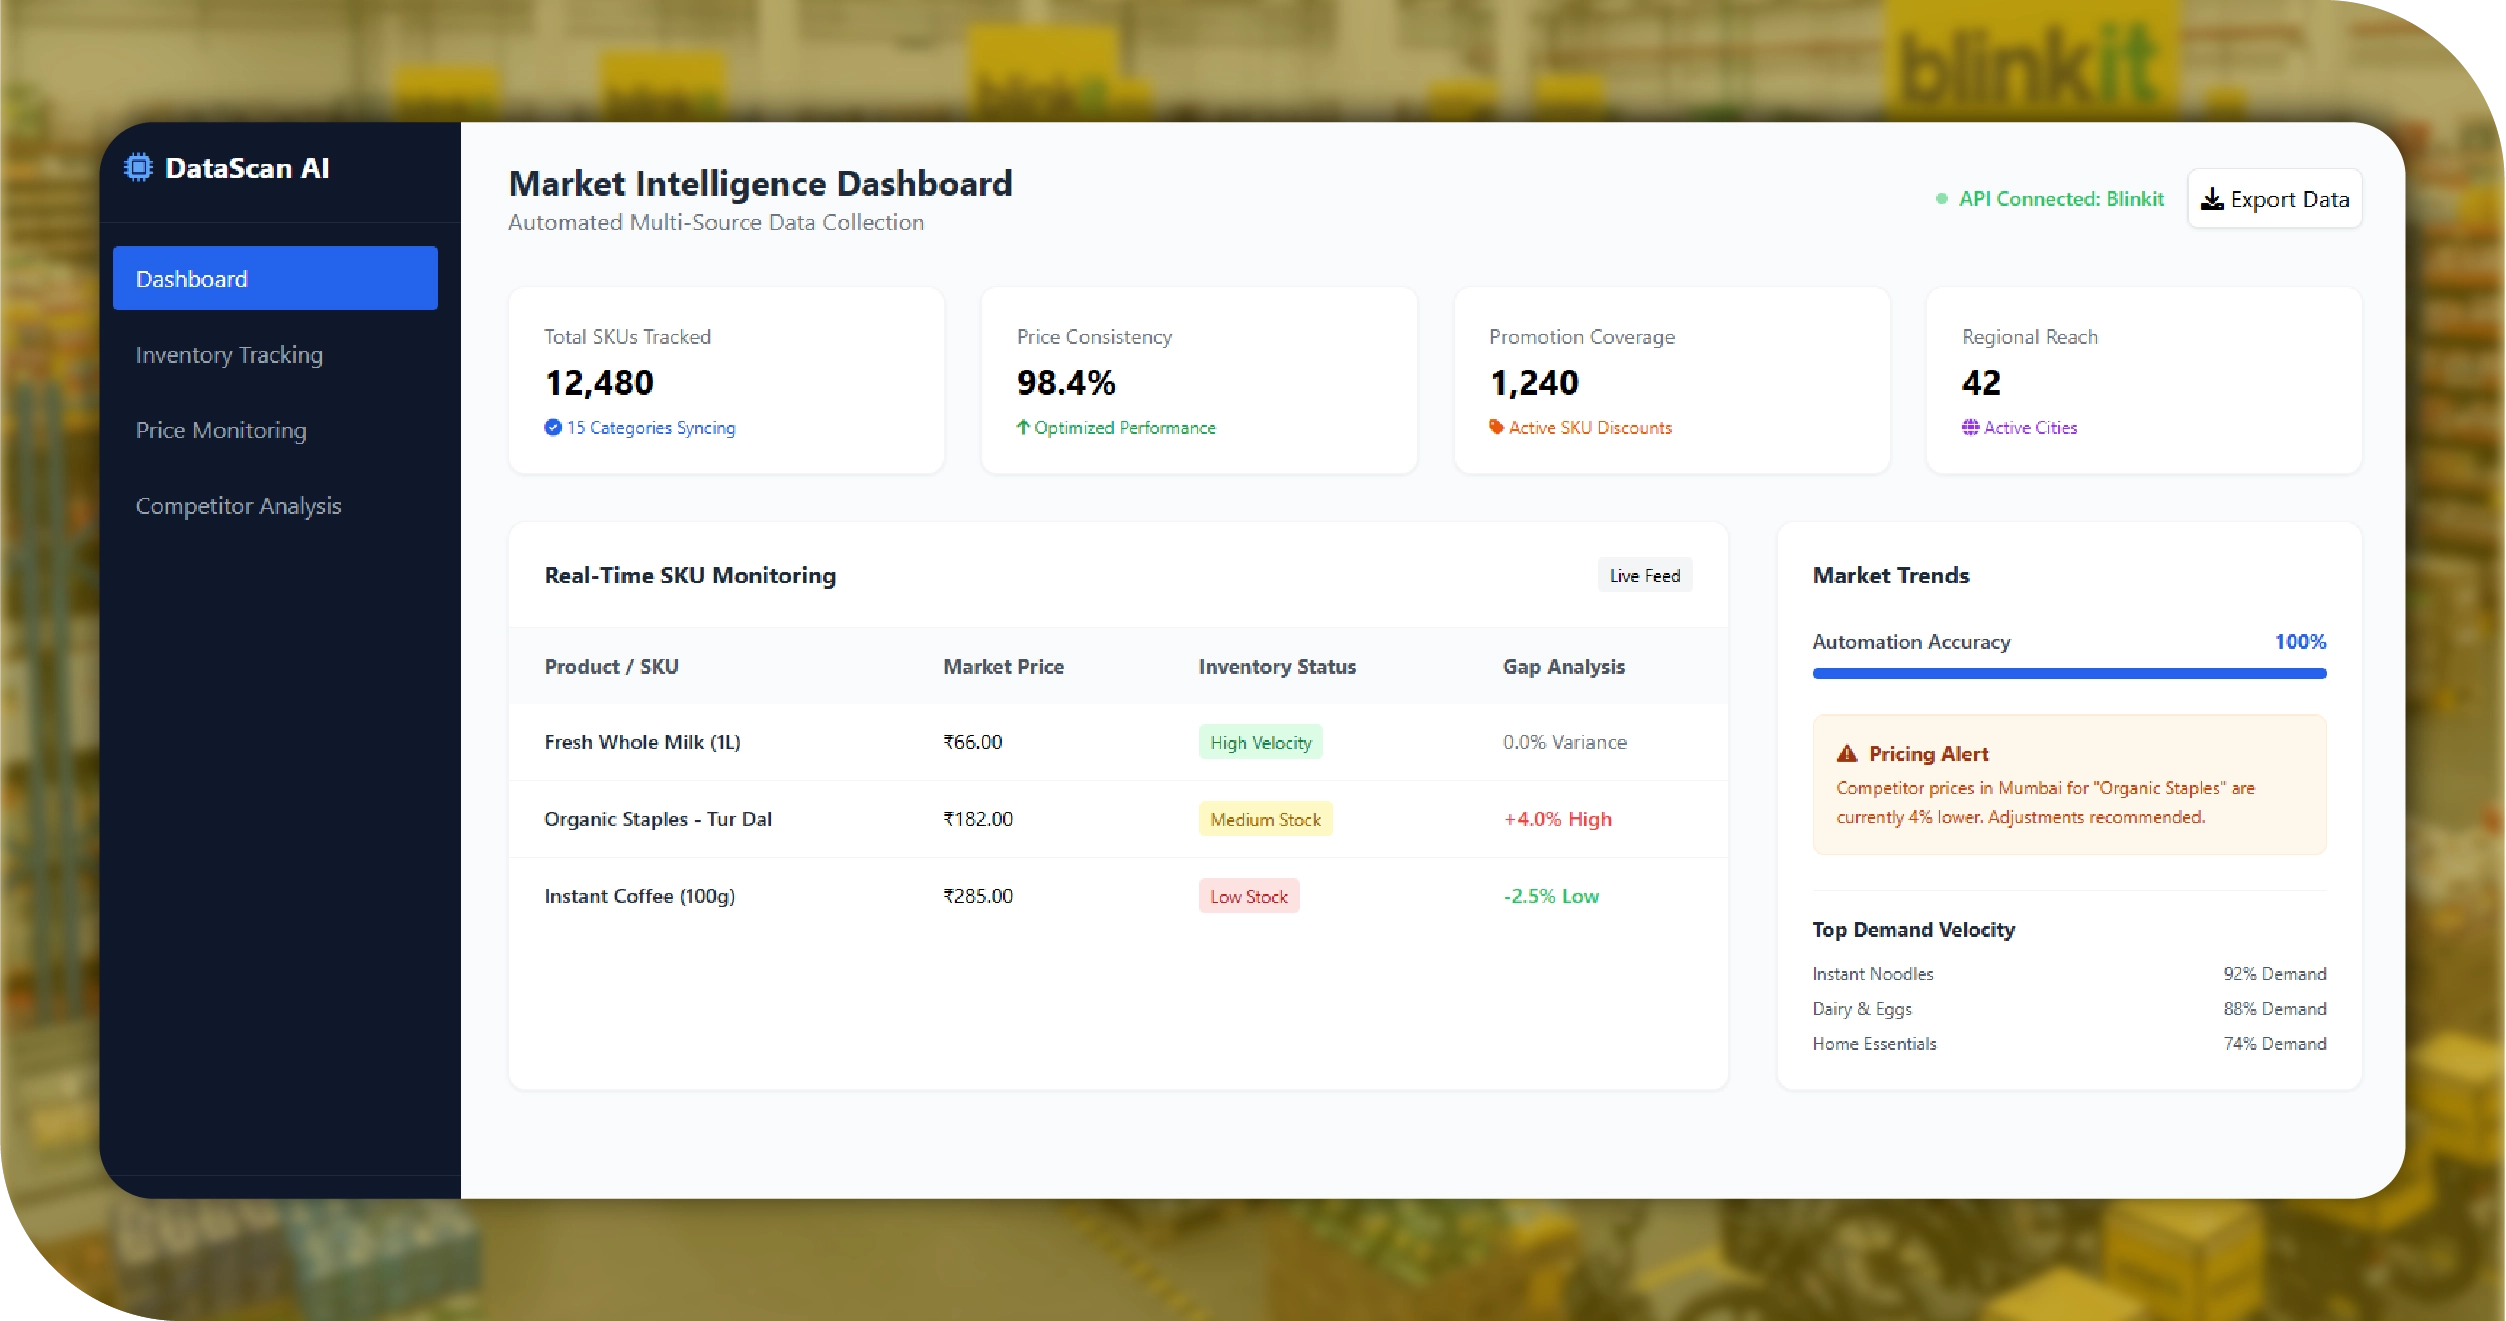
We developed a Grocery Price Dashboard to present structured insights on SKU-level pricing, promotions, and inventory trends. This enabled the client to analyze market dynamics, monitor competitor strategies, and optimize pricing and assortment strategies efficiently.
Sample Data Delivered
| City | Category | SKU Name | Avg Price (₹) | Active Offers | Last Updated |
|---|---|---|---|---|---|
| Mumbai | Beverages | Organic Juice | 120 | Yes | 2025-12-16 11:00 |
| Delhi | Snacks | Almond Bars | 85 | No | 2025-12-16 11:00 |
| Bengaluru | Dairy | Greek Yogurt | 150 | Yes | 2025-12-16 11:00 |
| Hyderabad | Frozen Foods | Veggie Pizza | 220 | Yes | 2025-12-16 11:00 |
| Chennai | Bakery | Multigrain Bread | 75 | No | 2025-12-16 11:00 |
Methodologies Used
- Multi-Source Data Aggregation
We collected product, pricing, and promotional information from multiple grocery delivery sources, standardizing formats and aligning SKUs across categories. This ensured a consistent, comprehensive dataset suitable for analysis and benchmarking across regions and product lines. - Real-Time Change Detection
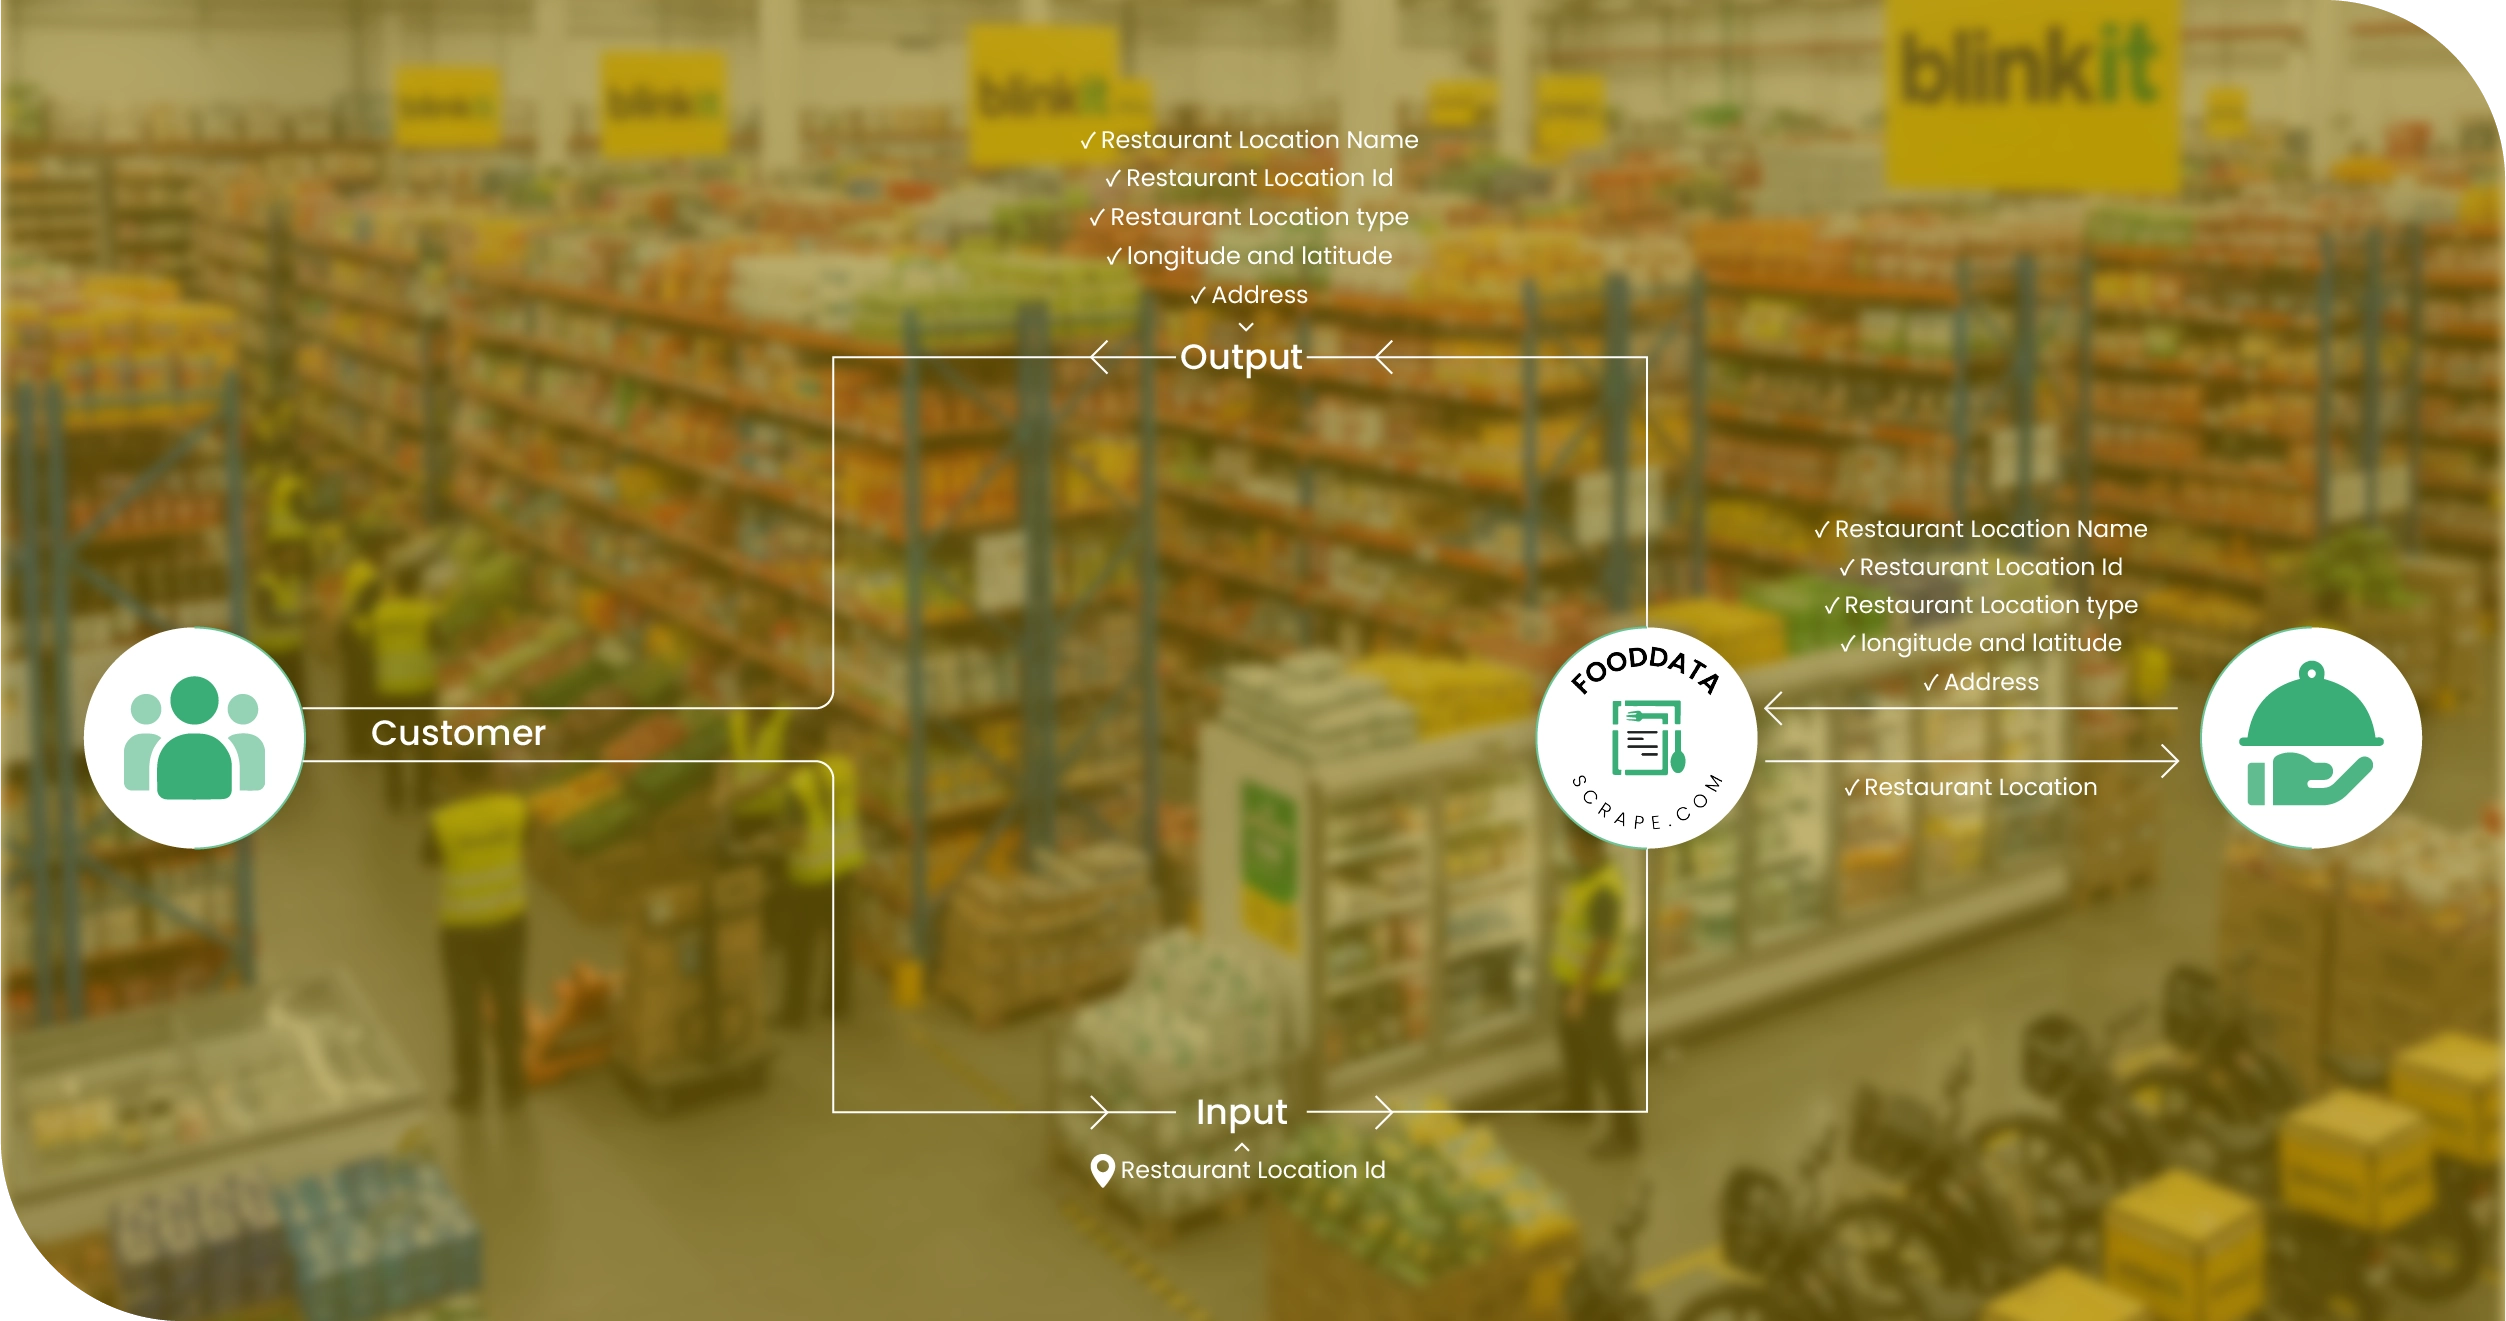
Automated monitoring identified price shifts, new SKUs, removed items, and promotional updates immediately. This reduced latency and ensured that stakeholders always worked with the most current, accurate information without manual intervention. - Geolocation-Based Mapping
Data was organized by city, delivery zone, and store to capture hyperlocal variations in pricing and promotions. This approach enabled precise comparisons and insights into regional market trends and competitive dynamics. - Historical Versioning
Time-stamped records of all products, prices, and offers were maintained, enabling trend analysis, seasonal pattern identification, and retrospective performance assessments without losing historical context. - Quality Assurance and Validation
Automated and manual checks were applied to detect anomalies, missing values, and inconsistencies. This ensured data reliability, minimized errors, and delivered analysis-ready datasets for strategic decision-making and reporting.
Advantages of Collecting Data Using Food Data Scrape
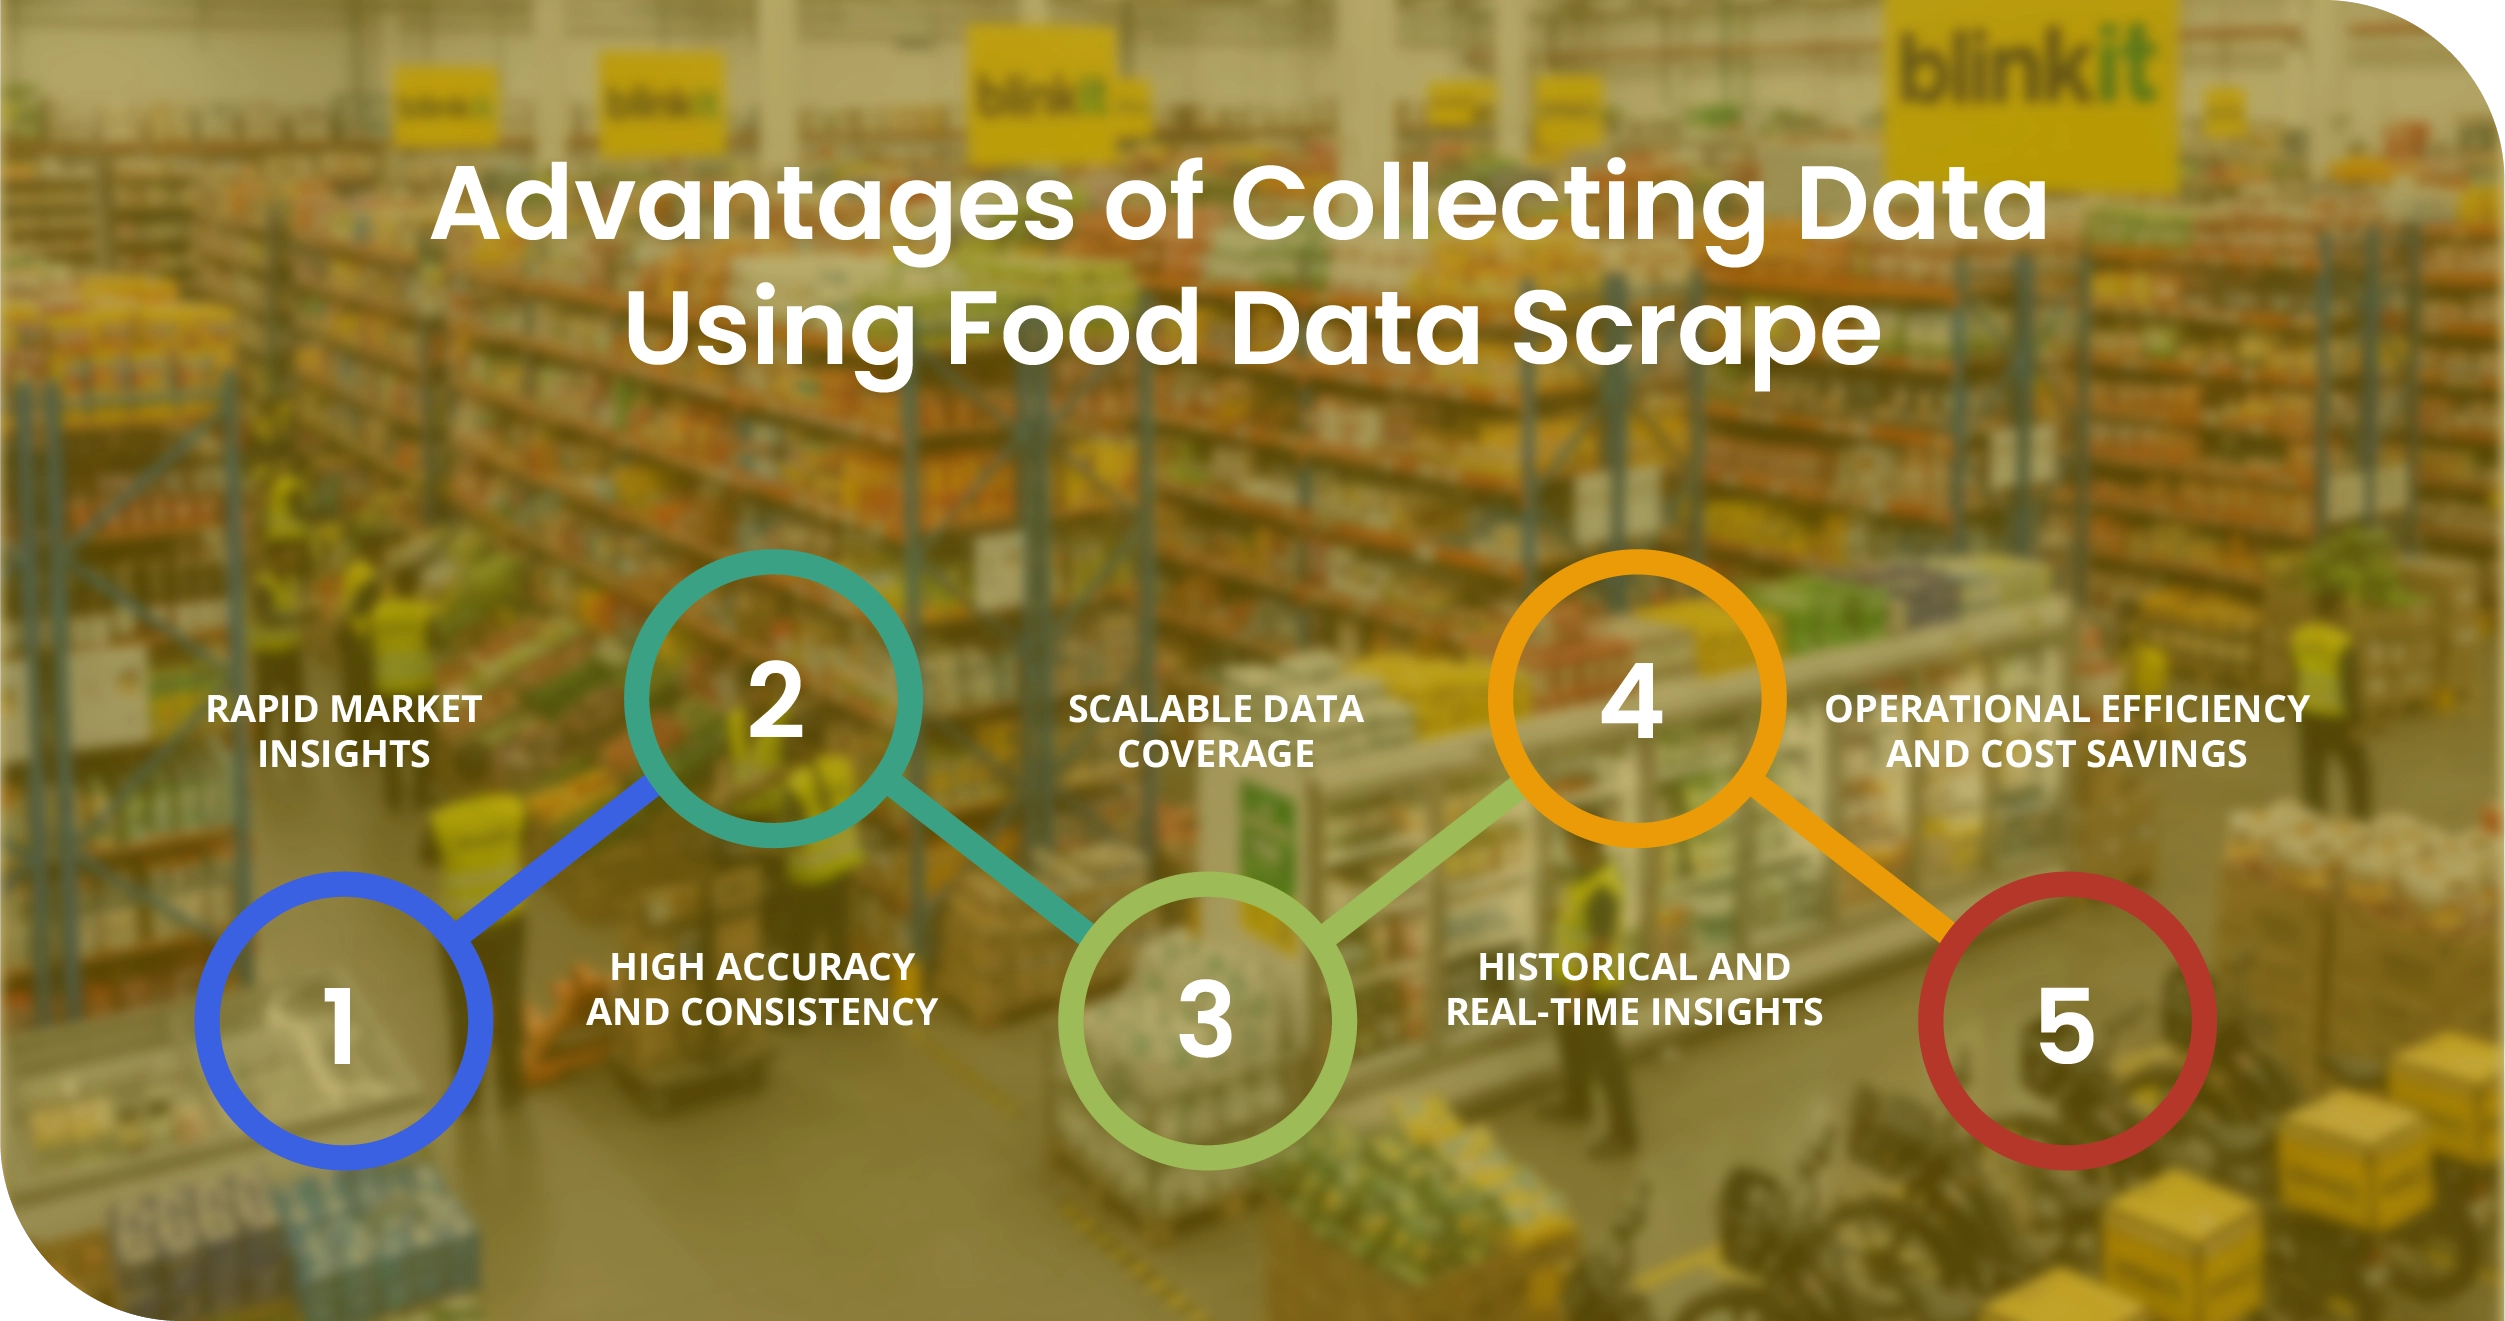
- Rapid Market Insights
Our services provide fast, structured access to product, pricing, and promotion data, replacing slow manual collection. Clients can quickly identify trends, monitor competitors, and make timely, informed decisions that enhance strategic planning and operational efficiency. - High Accuracy and Consistency
Through rigorous validation and normalization, collected data is reliable and uniform across categories and regions. This consistency reduces errors, ensures trustworthy reporting, and allows clients to make confident, data-driven decisions. - Scalable Data Coverage
Data collection scales effortlessly across cities, stores, and product categories. As client needs grow, coverage expands without additional operational burden, supporting both detailed analysis and broad market monitoring initiatives. - Historical and Real-Time Insights
Clients benefit from continuous updates alongside historical records, enabling trend tracking, promotional analysis, and price pattern identification for forecasting, strategic planning, and improved competitive intelligence. - Operational Efficiency and Cost Savings
Automating data collection and processing reduces manual effort, lowers resource requirements, and allows teams to focus on deriving insights and strategy instead of repetitive data gathering tasks.
Client’s Testimonial
Partnering with this team has significantly enhanced our grocery intelligence capabilities. Their solution provided accurate, structured data on products, prices, and promotions across multiple cities, eliminating weeks of manual effort. Real-time updates and historical tracking allowed us to monitor trends, detect price fluctuations, and optimize product assortments efficiently. The dashboards delivered actionable insights, improving reporting and strategic decision-making across teams. Their professionalism, responsiveness, and adaptability exceeded expectations. This collaboration has strengthened our competitive intelligence, streamlined operations, and empowered us to make confident, data-driven decisions in the fast-paced quick-commerce grocery sector, positioning us for sustained growth and market leadership.
Head of Retail Analytics
Final Outcome
The final outcome delivered significant value to the client’s retail analytics operations. With structured, continuously updated data, the client gained complete visibility into product prices, SKUs, and promotions across multiple cities. The Grocery Price Tracking Dashboard enabled real-time monitoring of price fluctuations and promotional trends, enhancing decision-making speed and accuracy. Access to high-quality Grocery Pricing Data Intelligence allowed the client to identify pricing gaps, optimize assortments, and respond quickly to market changes. Comprehensive Grocery Store Datasets provided historical insights, supporting trend analysis, forecasting, and category planning. Overall, the solution reduced manual effort, improved reporting reliability, and empowered the client to make data-driven strategic and operational decisions, strengthening competitive positioning in India’s fast-growing quick-commerce grocery sector.

