About Food Data Scrape
Food Data Scrape is a specialized data extraction and Food Market Intelligence company that helps grocery retailers, food distributors, e-commerce platforms, and procurement teams access accurate, real-time pricing and product data from across the web. Their services include:
- Retail price monitoring across supermarkets and online grocery platforms
- Competitor price tracking for private label and branded food products
- Supplier and wholesale Grocery Price Scraping
- Product availability and stock monitoring
- Nutritional and label data extraction
- Custom API integrations for live dashboard feeds
With clients spanning North America, Europe, and Southeast Asia, Food Data Scrape has established itself as a trusted partner for retail brands looking to gain pricing transparency and competitive advantage through automated food data collection.
The Client: A Growing Multi-Category Retail Brand
The client — referred to here as FreshMart Retail Group — operates a chain of 60+ retail outlets and an e-commerce storefront selling fresh produce, dairy, packaged goods, and beverages. With a growing buyer team spread across three regional procurement offices, FreshMart faced a growing disconnect between market prices and their internal buying records.
Key facts about FreshMart at the time of engagement:
- 400+ active SKUs across 12 food categories
- Procurement volume exceeding $28 million annually
- Buying team of 200+ category buyers and analysts
- Supplier network spanning 180+ vendors domestically and internationally
- Reliance on weekly manual price reports compiled by a 4-person analytics team
The Problem: Outdated Pricing Data in a Fast-Moving Market
- Price Discrepancy Between Procurement Records and Market Rates
Buyers were often approving purchase orders at prices 8–15% above current spot or competitor retail prices simply because they lacked real-time benchmark data. - No Competitor Visibility
Category managers had no structured way to monitor what competing retail chains (or online grocery platforms) were charging for similar or identical products. Competitive repositioning was entirely reactive. - Manual Report Generation Was Unsustainable
The analytics team spent an estimated 40+ hours per week manually pulling prices from supplier websites, industry portals, and competitor pages — a task that could be automated entirely. - Siloed Category Insights
Each category buyer tracked pricing within their own silo. There was no unified view where a fresh produce buyer could see how a surge in vegetable prices might affect a packaged meals buyer's projections. - No Alerts for Price Spikes or Drops
Buyers learned about significant price movements only during their weekly briefing calls — far too late to adjust purchasing strategies in real time.
Food commodity prices move fast. A sudden shift in oil prices affects transportation costs. A drought in California moves avocado spot prices by 30% in a week. A supplier merger can change wholesale pricing overnight. FreshMart's buyers were working from reports that were often 5–7 days old — a gap that was eroding margins and creating procurement inefficiencies.
Specific Pain Points Identified
The Solution: A Live Pricing Dashboard Powered by Food Data Scrape
Food Data Scrape was engaged to build an end-to-end Pricing Intelligence ecosystem. The solution had three major components:
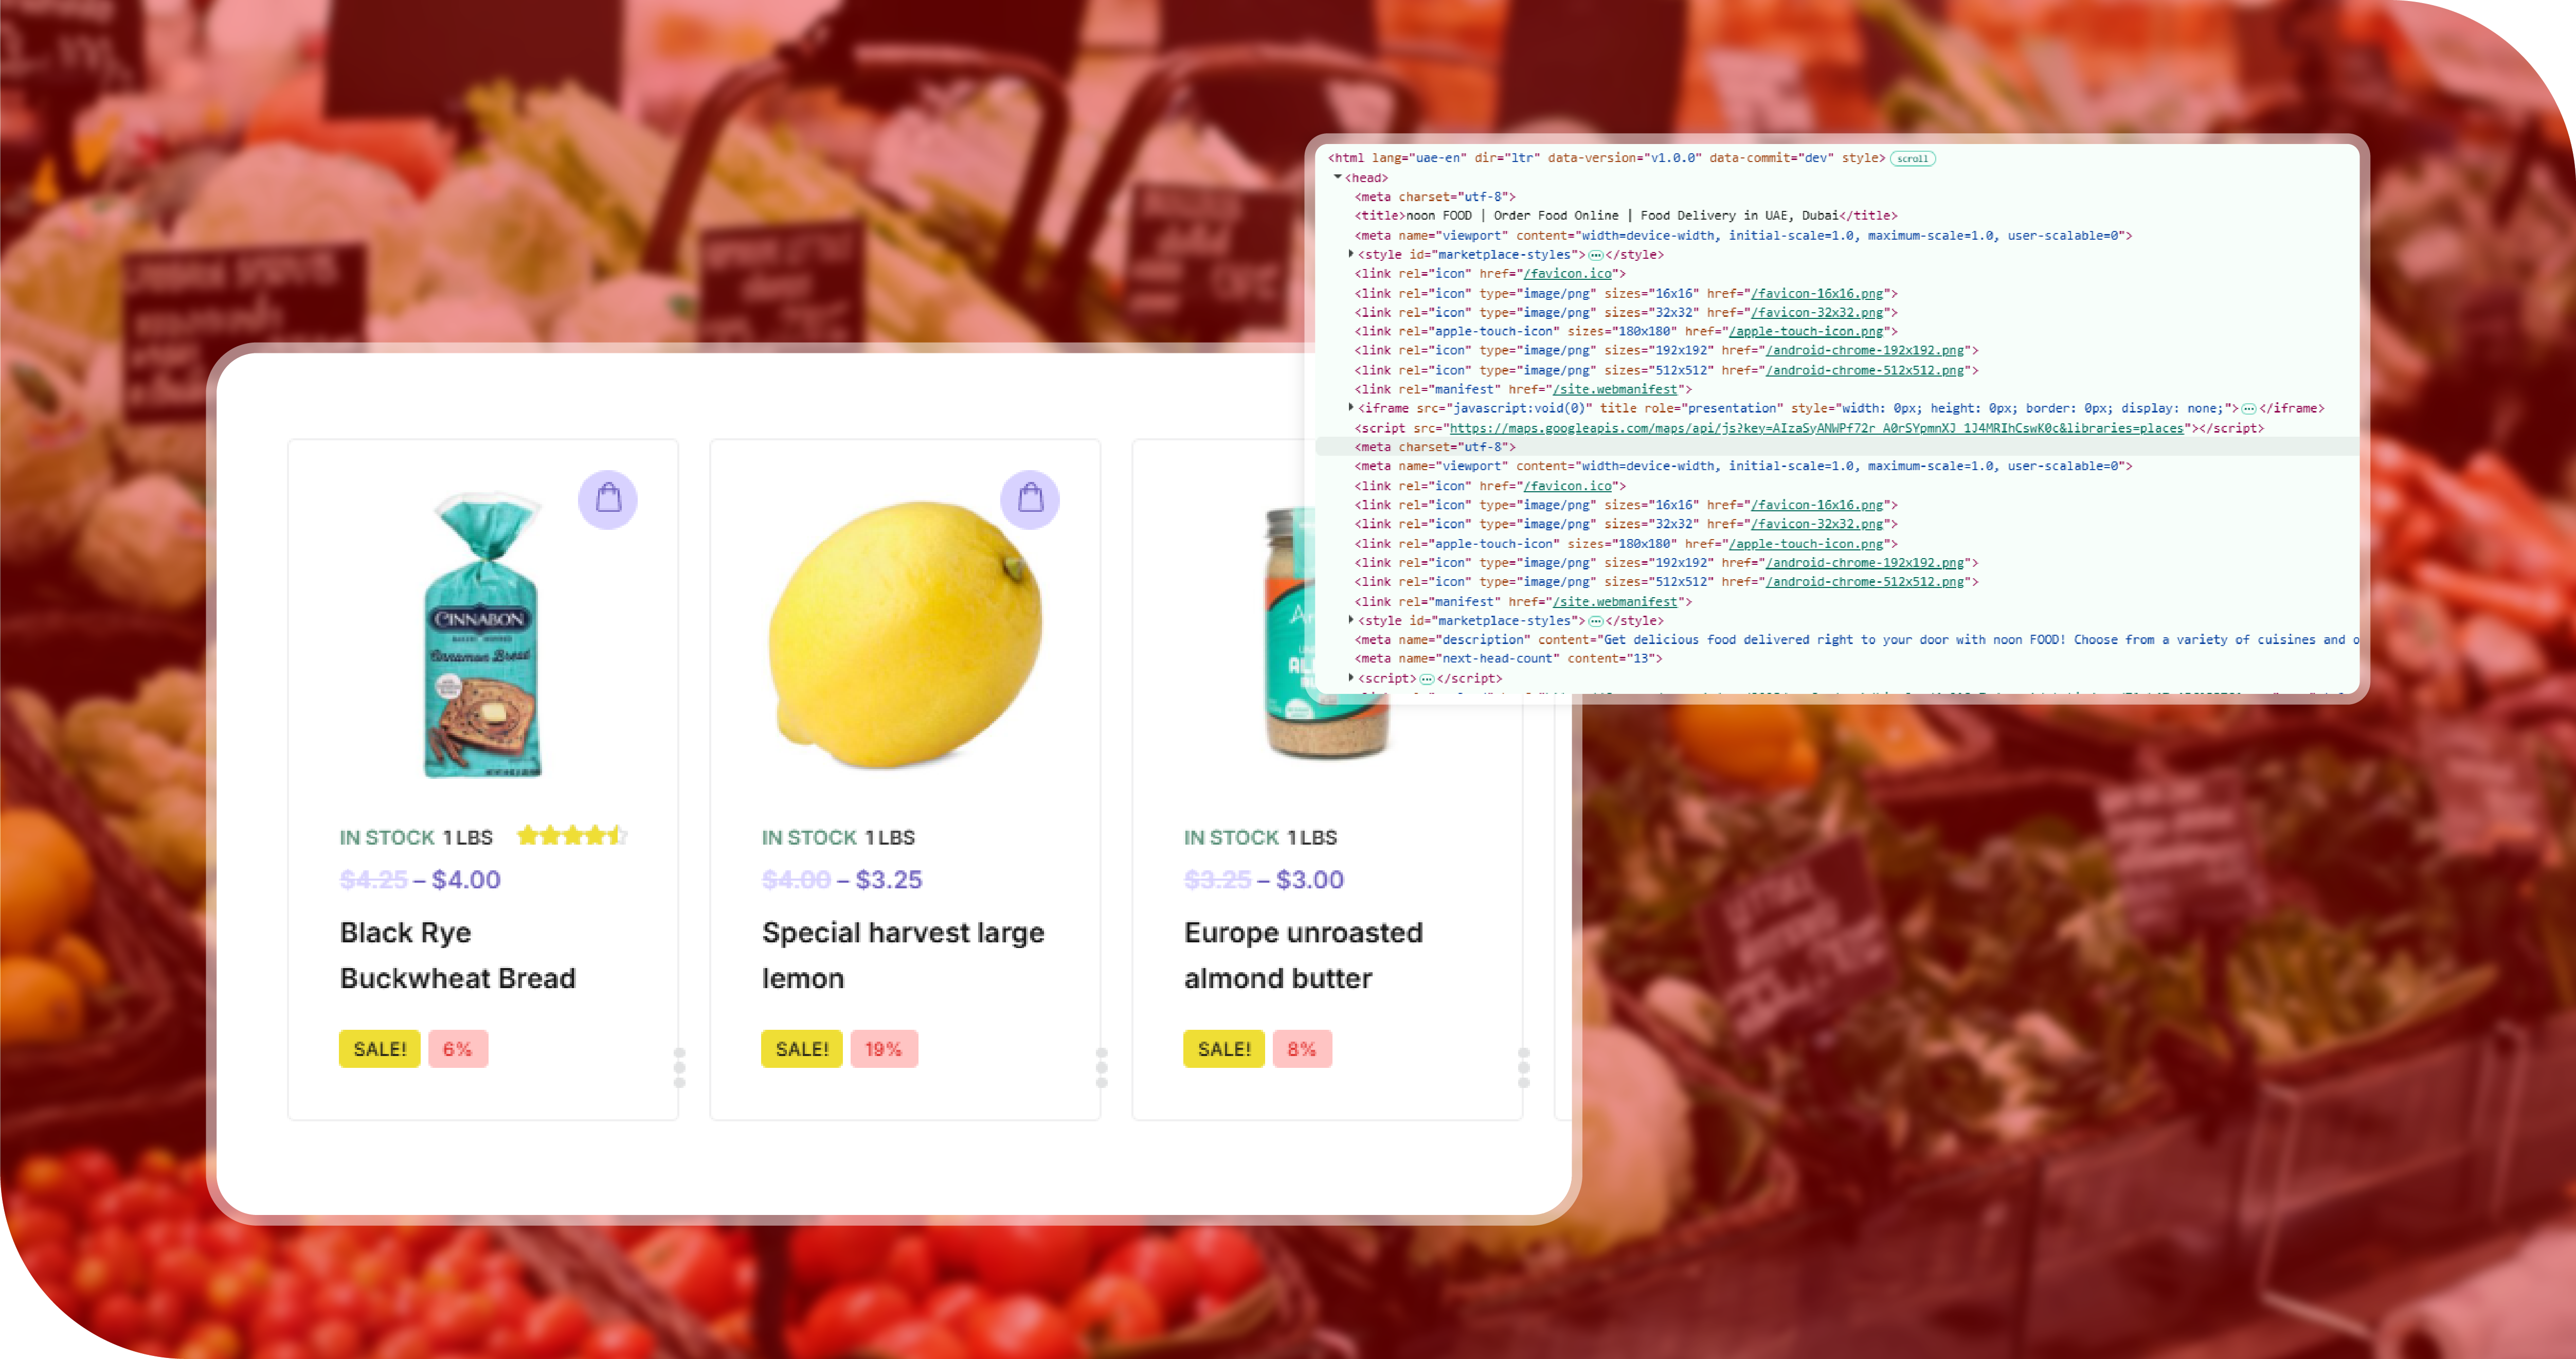
Component 1: Multi-Source Data Extraction Pipeline
Food Data Scrape deployed a robust, cloud-based web scraping infrastructure to pull pricing data from:
- Competitor retail websites (online grocery platforms, supermarket chains)
- Wholesale and distributor portals
- B2B food marketplace listings
- Government and commodity exchange feeds (USDA, FAO, commodity indices)
- Supplier product pages
Data was collected across 14 unique source types, refreshed at intervals ranging from every 15 minutes (for high-volatility categories like fresh produce and dairy) to every 6 hours (for shelf-stable packaged goods).
Component 2: Data Normalization and Enrichment Layer
Raw scraped data is inherently messy — units vary, product names differ across retailers, and pack sizes complicate direct comparisons. Food Data Scrape's data engineering team built a normalization pipeline that:
- Standardized units (per kg, per liter, per unit) across all sources
- Matched scraped products to FreshMart's internal SKU catalog using fuzzy matching and NLP-based product name resolution
- Enriched records with product metadata (brand, category, sub-category, pack size, organic/conventional flag)
- Calculated price-per-unit for direct comparability
- Flagged outliers and anomalous data points for QA review
Component 3: Live Dashboard Interface
The final output was a browser-based, role-specific dashboard deployed on FreshMart's internal network with Single Sign-On (SSO) authentication. Key dashboard modules included:
- Real-Time Market Price Feed : live pricing for each SKU from all monitored sources
- Competitor Price Comparison Panel : side-by-side FreshMart price vs. 5 tracked competitors
- Price Trend Charts : 30/60/90-day historical trend lines per product
- Price Alert Center : configurable alerts for when any tracked product moves beyond a set threshold
- Supplier Price Deviation Report : flagging when supplier quotes deviate from market benchmarks
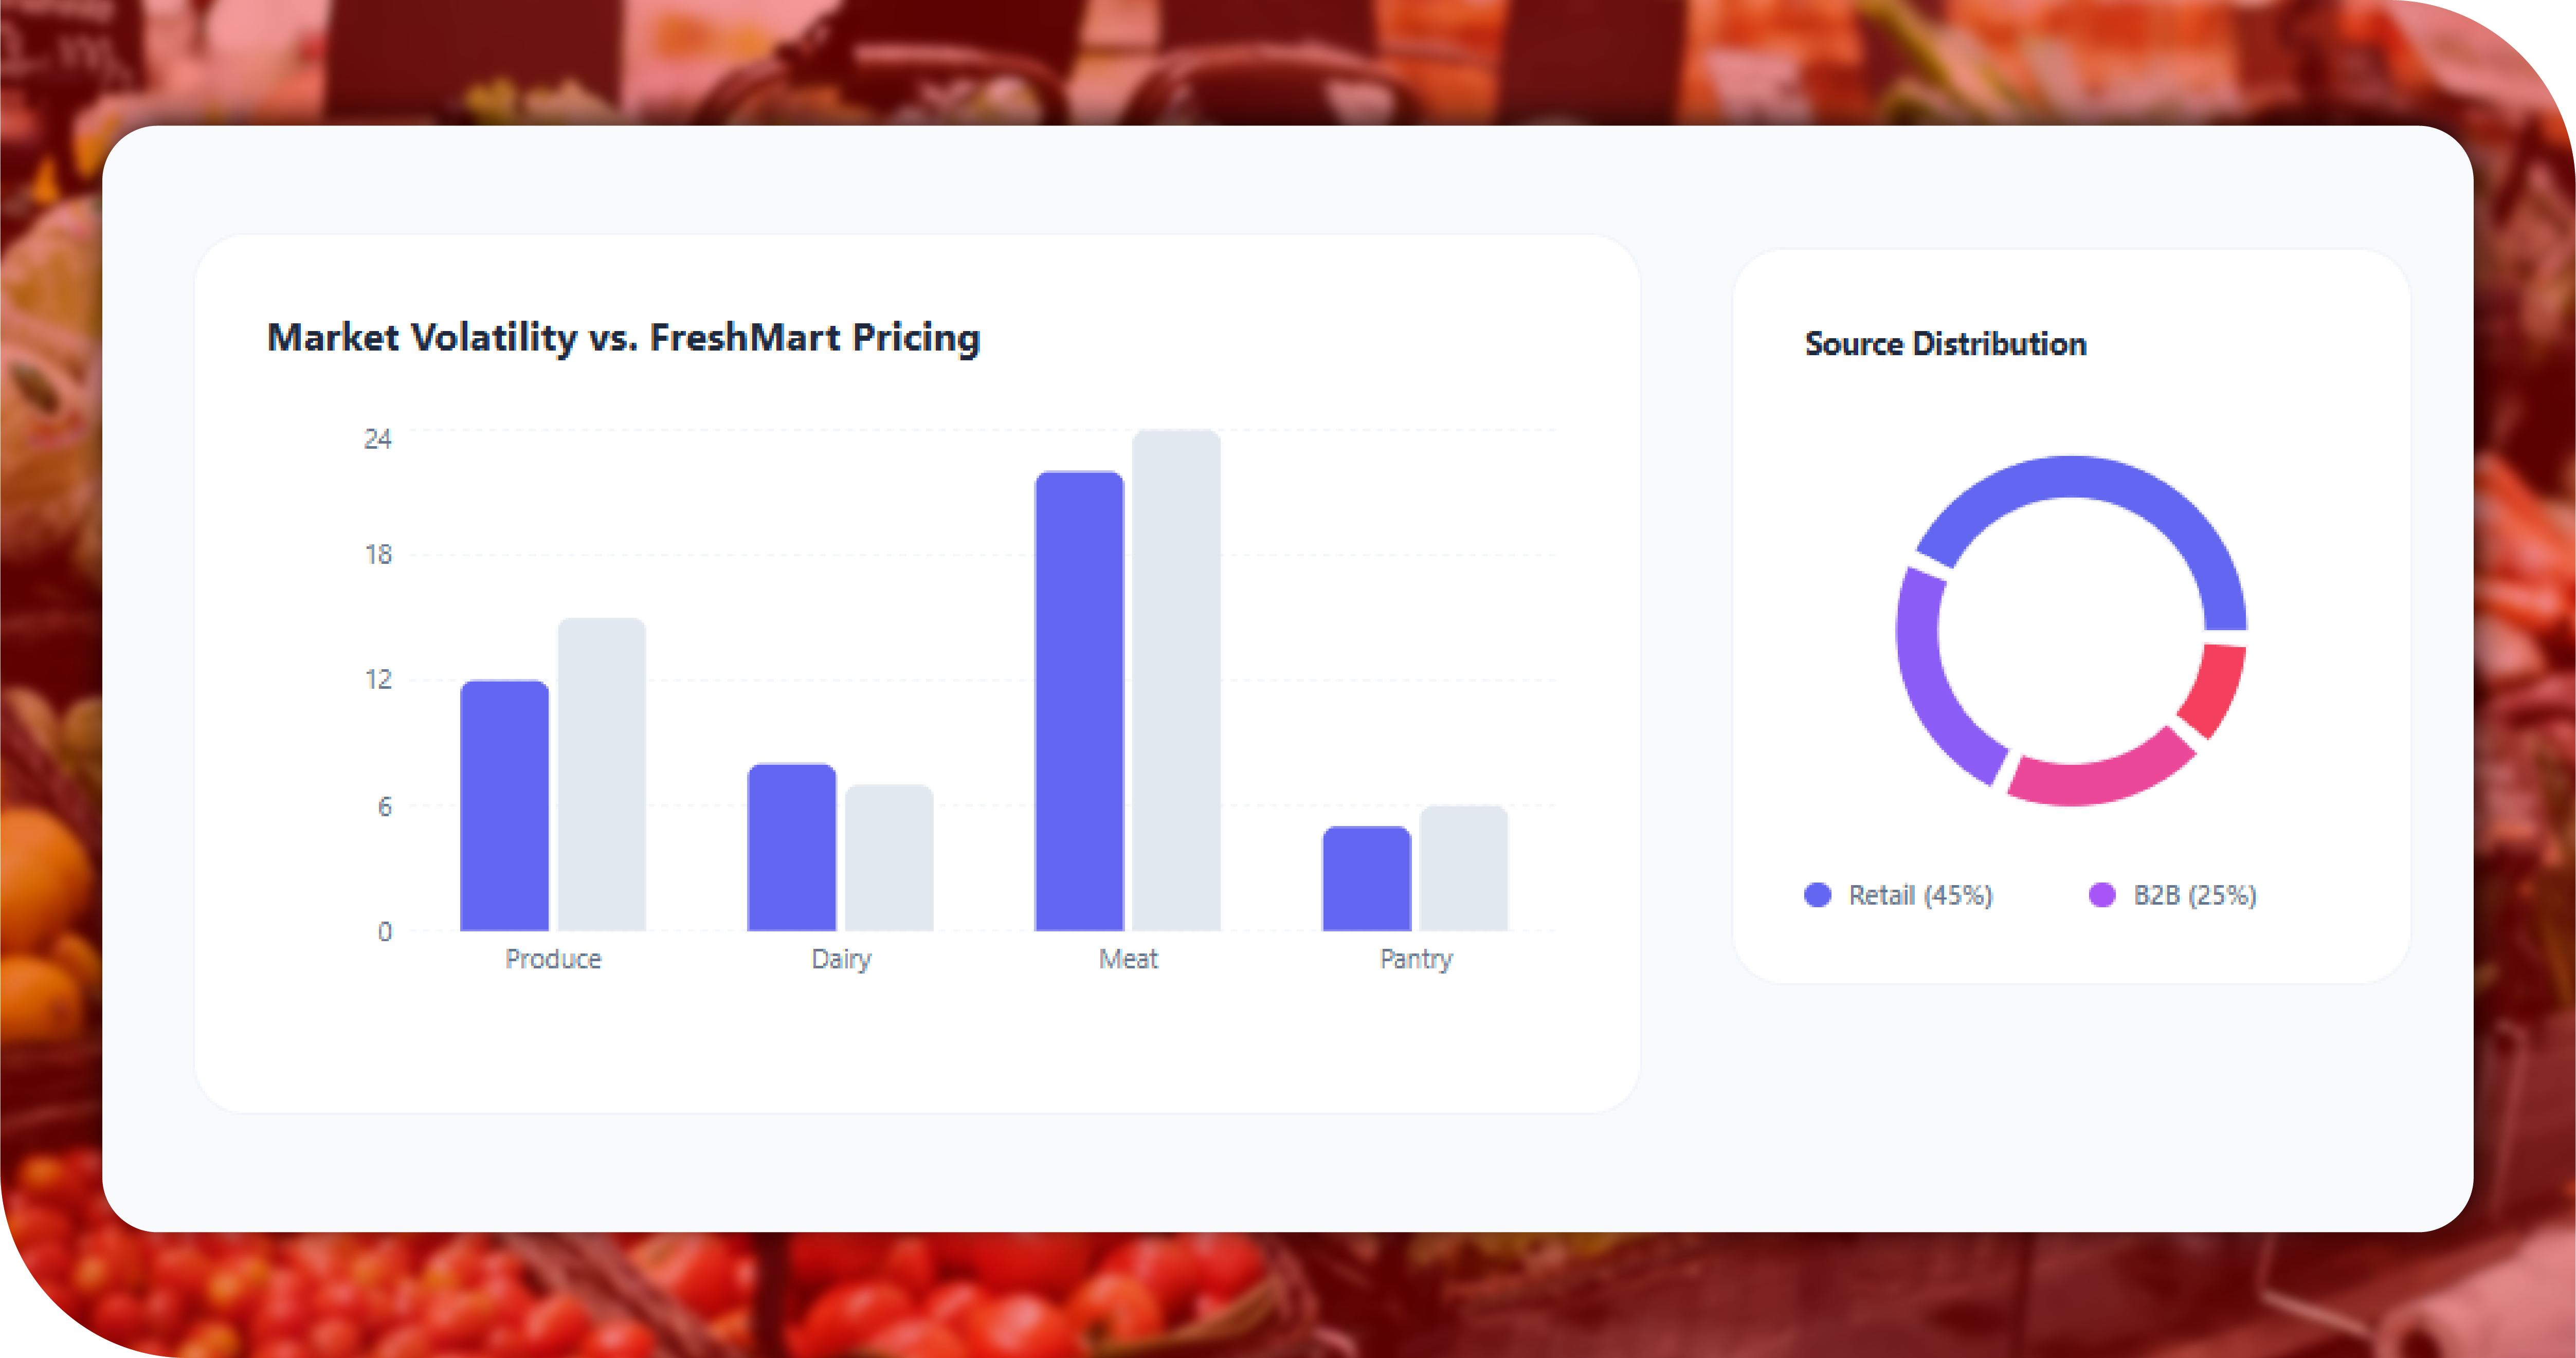
- Category Heat Map : a visual overview of which categories are experiencing price stress
- Export & API Access : buyers could export live data to Excel or trigger API calls for ERP integration
Sample Data
| Source | Product Name | Price (USD/kg) | Pack Size | Last Updated | Normalized |
|---|---|---|---|---|---|
| FreshMart Internal | Roma Tomatoes | $2.89 | Loose | Live | ✓ |
| Competitor A (RetailChain) | Roma Tomatoes | $2.49 | Loose | 14 min ago | ✓ |
| Competitor B (GrocerPlus) | Vine Tomatoes | $2.75 | 500g pack | 22 min ago | ✓ |
| Wholesale Portal | Bulk Roma Tomatoes | $1.85 | 10kg case | 1 hr ago | ✓ |
| USDA Commodity Feed | Fresh Tomatoes (Avg) | $1.92 | Commodity | 6 hrs ago | ✓ |
Sample Data
| Source | Product Name | Brand | Price (USD/L) | Organic | Last Updated |
|---|---|---|---|---|---|
| FreshMart Internal | Full Fat Fresh Milk | FreshMart Private Label | $1.42 | No | Live |
| Competitor A | Whole Milk | Meadow Fresh | $1.55 | No | 8 min ago |
| Competitor B | Full Cream Milk | DairyGold | $1.48 | No | 19 min ago |
| Competitor C | Organic Whole Milk | GreenField | $2.10 | Yes | 35 min ago |
| Distributor Portal | Bulk Whole Milk | N/A | $1.10 | No | 2 hrs ago |
Sample Data
| SKU | Product | Competitor Price | FreshMart Price | Price Gap | Trend (30-Day) | Alert |
|---|---|---|---|---|---|---|
| PKG-4421 | Corn Flakes 500g | $3.20 | $3.45 | +$0.25 | ↑ Rising | ⚠ Review |
| PKG-4422 | Oats Classic 500g | $2.95 | $2.90 | -$0.05 | → Stable | ✓ OK |
| PKG-4423 | Muesli Mix 500g | $4.80 | $4.80 | $0.00 | ↓ Falling | ! Alert |
| PKG-4424 | Bran Flakes 500g | $3.10 | $3.35 | +$0.25 | ↑ Rising | ⚠ Review |
| PKG-4425 | Granola Crunch 500g | $5.40 | $5.10 | -$0.30 | → Stable | ✓ OK |
Sample Data
| Alert ID | Product | Category | Alert Type | Threshold | Triggered Value | Buyer |
|---|---|---|---|---|---|---|
| ALT-0091 | Avocados (per kg) | Fresh Produce | Price Spike | +15% | +23.4% | James R. |
| ALT-0092 | Chicken Breast (per kg) | Protein | Price Drop | -10% | -14.2% | Sarah K. |
| ALT-0093 | Olive Oil 1L | Oils & Condiments | Competitor Drop | >$0.50 gap | $0.78 gap | Marco D. |
| ALT-0094 | Greek Yogurt 500g | Dairy | Supplier Deviation | >8% above | 11.3% above | Linda P. |
| ALT-0095 | Basmati Rice 1kg | Grains | Price Spike | +12% | +18.9% | Dev A. |
Sample Data
| Supplier | Product | Quote Price | Market Benchmark | Deviation | Recommendation |
|---|---|---|---|---|---|
| Supplier A | Canned Chickpeas 400g | $0.94 | $0.81 | +16.0% | Renegotiate |
| Supplier B | Sunflower Oil 1L | $2.10 | $2.08 | +1.0% | Accept |
| Supplier C | Frozen Peas 500g | $1.65 | $1.74 | -5.2% | Accept (favorable) |
| Supplier D | Brown Sugar 1kg | $1.88 | $1.59 | +18.2% | Reject / Requote |
| Supplier E | Tomato Paste 200g | $0.73 | $0.70 | +4.3% | Negotiate |
Implementation Timeline
| Phase | Duration | Key Activities |
|---|---|---|
| Discovery & Scoping | Weeks 1–2 | Source identification, SKU catalog mapping, stakeholder interviews |
| Scraper Development | Weeks 3–5 | Build and test scrapers for 14 source types |
| Data Normalization | Weeks 5–7 | Unit standardization, SKU matching, QA framework setup |
| Dashboard Development | Weeks 6–9 | UI build, role-based access, alert engine configuration |
| User Acceptance Testing | Weeks 9–11 | Buyer group testing, feedback iteration, edge case resolution |
| Full Deployment | Week 12 | Organization-wide rollout, training sessions, live monitoring |
Adoption: How 200 Buyers Came to Rely on It Daily
One of the most notable outcomes of this project was not just the technology — it was the adoption rate. Within 30 days of full deployment, the dashboard recorded:
- Daily active users: 200+
- Average session duration: 22 minutes
- Most used modules: Price Alert Center (68%), Competitor Comparison Panel (61%), Trend Charts (54%)
- Alerts acted upon within 2 hours: 79%
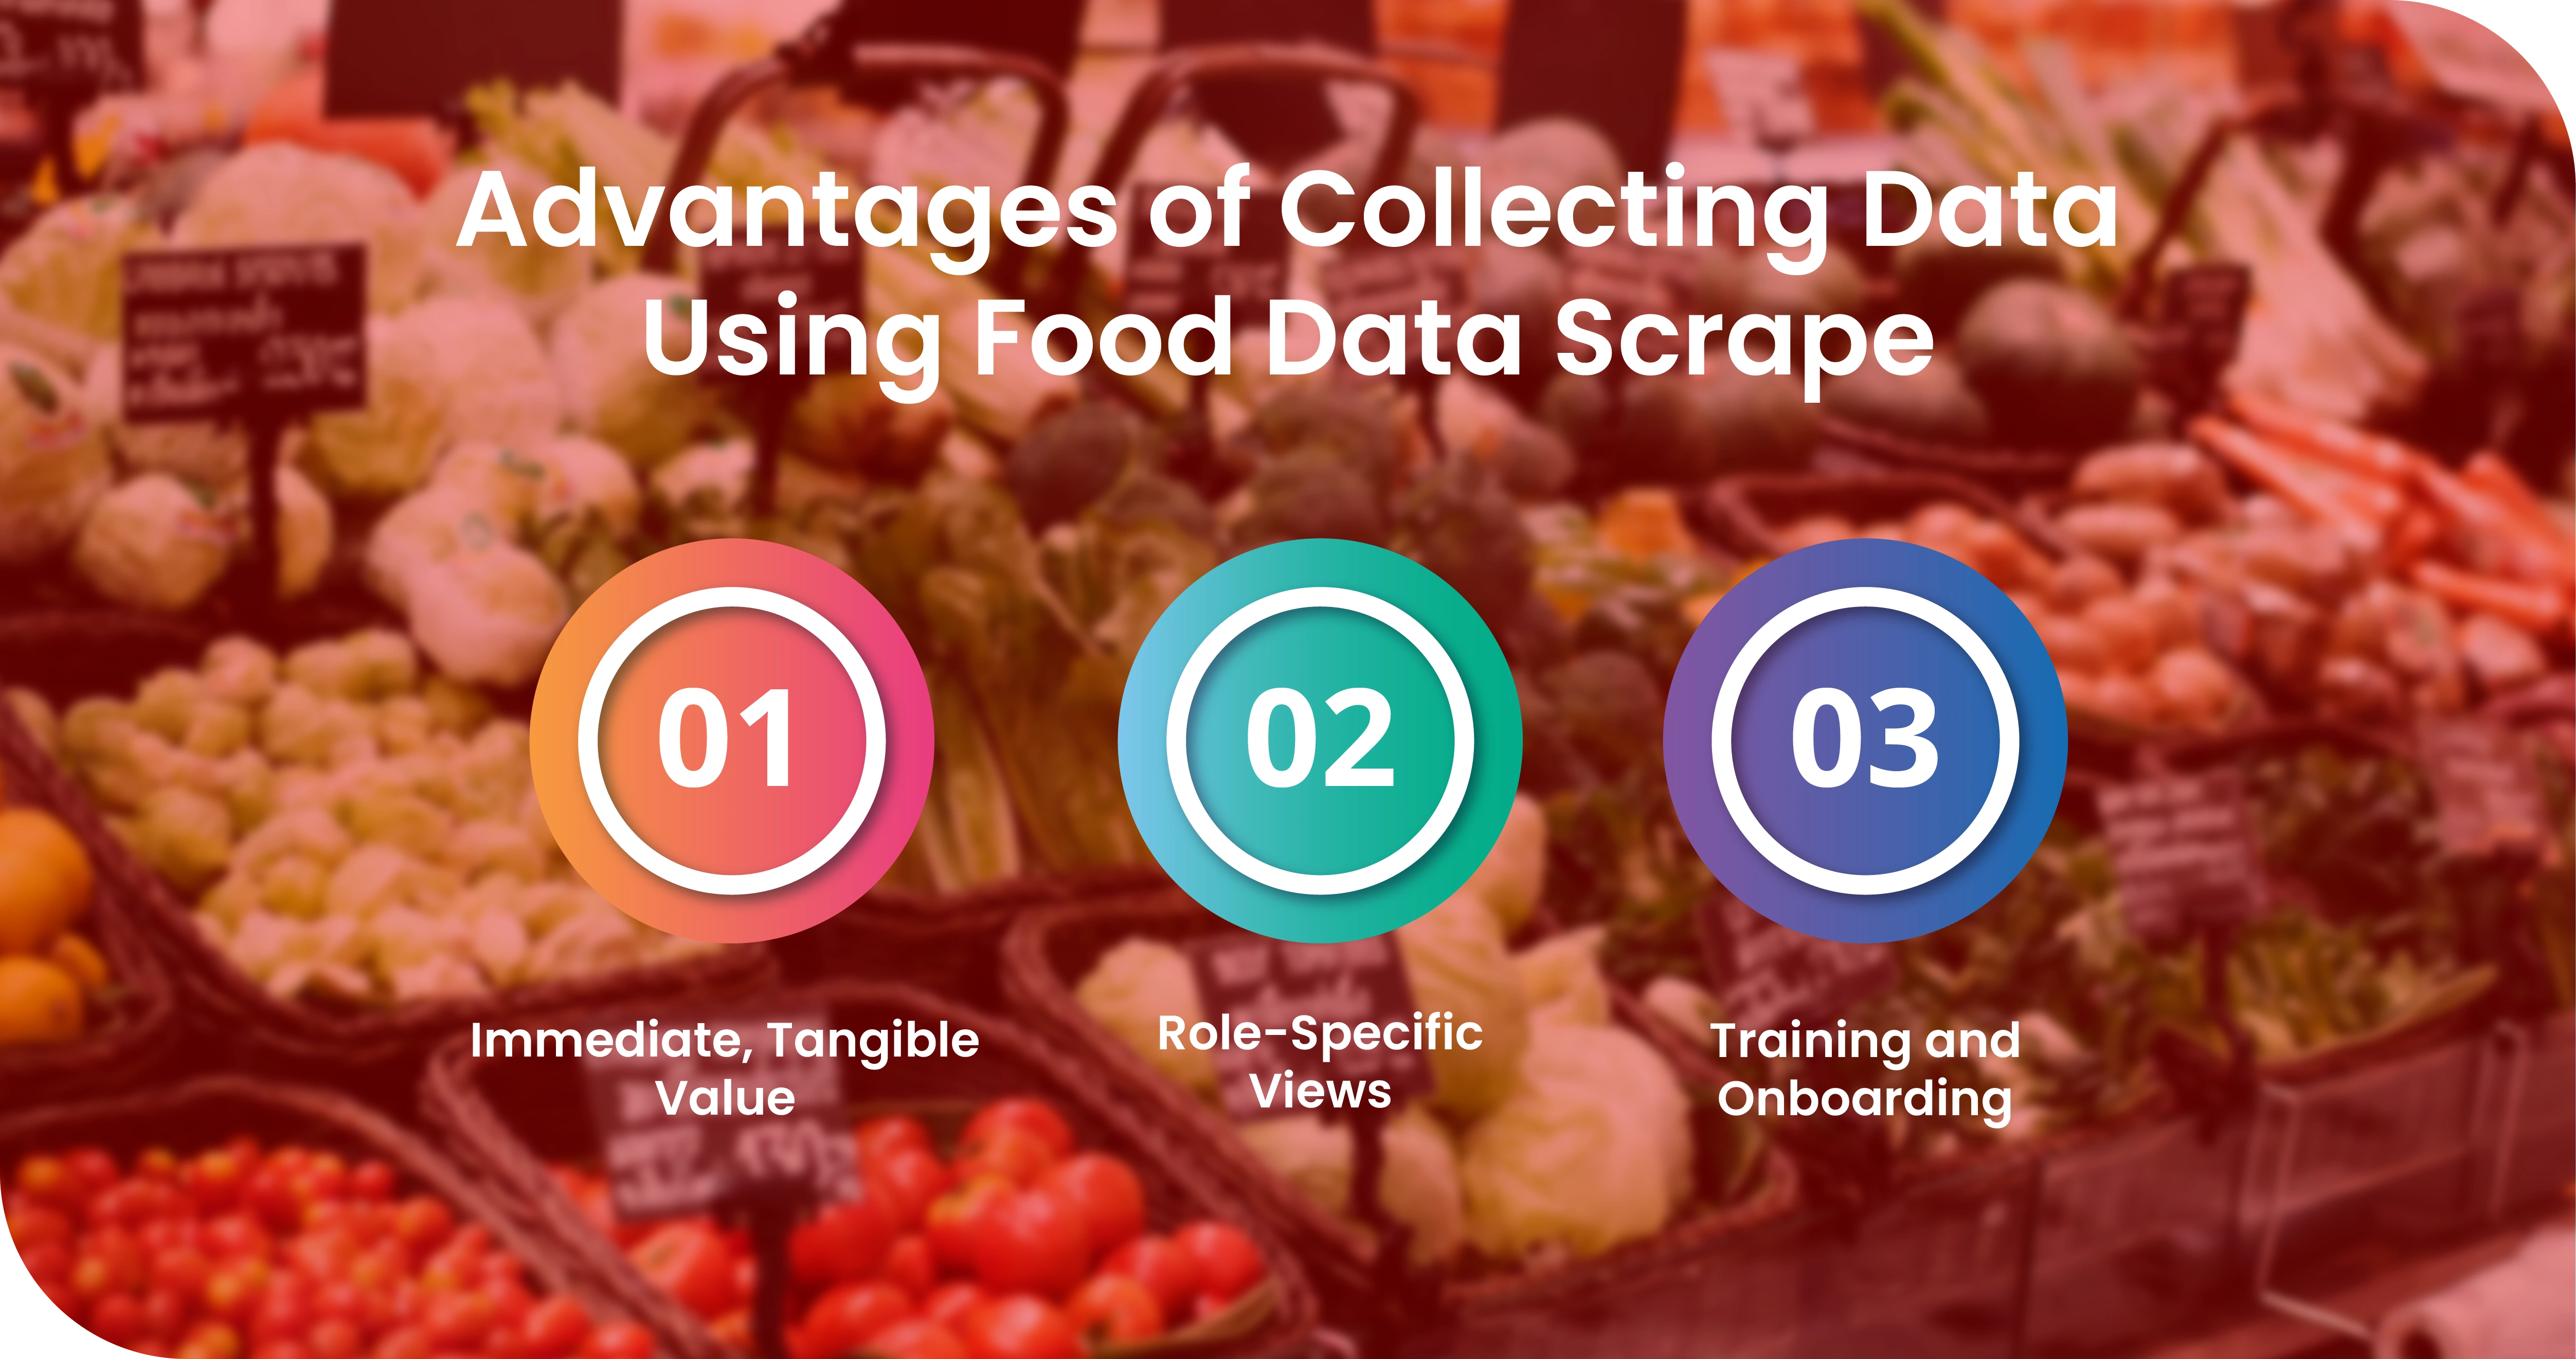
Adoption was driven by three key factors:
- Immediate, Tangible Value
Buyers who used the dashboard in the first week were able to flag a supplier overcharge on olive oil — an $11.40 per case discrepancy versus market — resulting in an immediate $34,000 saving on a pending bulk order. Word spread quickly. - Role-Specific Views
Food Data Scrape's team worked with FreshMart's HR and category leads to create tailored dashboard views for different buyer personas — fresh produce buyers saw different default layouts than packaged goods buyers or regional procurement leads. - Training and Onboarding
A structured 3-session onboarding program was delivered to all buyer groups, with short video walkthroughs embedded within the dashboard itself. Buyers felt confident navigating the tool from day one.
Results and Business Impact
After 6 months of operation, FreshMart conducted an internal review to quantify the business impact of the Live Pricing Dashboard powered by Food Data Scrape.
Sample Data
| Metric | Before Dashboard | After Dashboard | Improvement |
|---|---|---|---|
| Average price deviation from market | 9.4% above market | 2.1% above market | -77.7% |
| Time to respond to price spikes | 5–7 days | Under 2 hours | 97% faster |
| Weekly hours spent on manual reporting | 42 hours | 4 hours | -90.5% |
| Supplier quotes rejected/renegotiated | 12% of total quotes | 31% of total quotes | +158% |
| Procurement savings (annualized) | Baseline | +$2.3 million | Significant ROI |
| Buyer satisfaction with pricing tools | 34% satisfied | 89% satisfied | +162% |
Qualitative Outcomes
Beyond the numbers, FreshMart's Head of Procurement noted a significant shift in procurement culture:
Category managers reported that having competitive price visibility gave them more confidence in supplier negotiations, and the supplier deviation report became a standard attachment in all supplier review meetings.
Why Food Data Scrape? Key Differentiators
- Food-Specific Domain Expertise
Unlike generic web scraping vendors, Food Data Scrape's team understands the nuances of food pricing — seasonal volatility, unit standardization challenges, private label vs. branded price dynamics, and regulatory labeling data requirements. - Data Freshness and Reliability
Food Data Scrape's infrastructure guarantees 99.6% uptime for data feeds, with built-in redundancy to handle bot detection, CAPTCHA rotation, and source-side changes without disrupting the pipeline. - Compliance-First Approach
All data collection is performed in compliance with applicable terms of service, robots.txt policies, and data protection regulations — a critical consideration for enterprise retail clients. - Seamless ERP Integration
Food Data Scrape provided a RESTful API layer that allowed FreshMart's IT team to pipe pricing data directly into their SAP procurement module, creating a truly unified purchasing environment. - Scalability
As FreshMart's SKU catalog grows, the pipeline scales with it — new sources and new categories can be added within days, not weeks.
Conclusion: Pricing Intelligence as a Competitive Moat
The transformation at FreshMart Retail Group illustrates a broader truth about modern retail: access to real-time food pricing data is no longer a competitive advantage — it is a baseline requirement for sustainable operations.
By partnering with Food Data Scrape, FreshMart moved from a reactive, report-driven procurement culture to a proactive, data-driven one. Two hundred buyers now start their day with live market intelligence at their fingertips. Supplier negotiations are backed by objective market benchmarks. Competitive pricing decisions are made in hours, not weeks.
For retail brands, food distributors, and grocery procurement teams looking to replicate this transformation, Food Data Scrape offers the infrastructure, expertise, and domain knowledge to make it happen — from initial data extraction to full-scale pricing dashboard deployment.

