
This research report provides a comprehensive analysis of candy sales and pricing behavior during Halloween Week 2025. It explores how online grocery platforms and quick-commerce apps shaped consumer purchasing decisions through real-time discounts, stock management, and promotional timing. Using advanced data scraping and analytics techniques, the study evaluates category-level performance, price elasticity, and retailer competitiveness across major platforms such as Walmart, Amazon, Target, and Instacart. Detailed datasets reveal shifting demand from chocolates to novelty candies as the holiday approaches. The findings also highlight the increasing influence of algorithmic pricing, consumer sentiment, and delivery speed in shaping purchasing outcomes. The report concludes with strategic insights for retailers, manufacturers, and analysts aiming to improve pricing precision, inventory forecasting, and promotional effectiveness during high-demand festive periods.

1. Candy prices dropped up to 33% by October 31.
2. Chocolate remained the leading category with 35% sales share.
3. Amazon led discount activity through automated repricing.
4. Stock availability fell by 22% during peak demand.
5. Mid-week promotions achieved the highest sales conversions.
Halloween is one of the most commercially vibrant weeks of the year for grocery and confectionery retailers. The rise of online grocery platforms has reshaped how candy demand, pricing, and promotions unfold during this festive season. Businesses today depend on Candy Sales Data Scraping for Halloween Week 2025 to understand the digital shelf, real-time price movements, and product availability.
By tracking fluctuations across hundreds of listings, organizations can evaluate Halloween Week Candy Price Tracking 2025 and compare how discounts evolve across Amazon, Walmart, Instacart, and regional grocery apps. This intelligence supports optimized inventory planning and helps predict which candies will dominate consumer baskets.
Furthermore, automated tools built to Scrape Grocery Deals for Halloween Week 2025 reveal the pricing depth, discount timing, and bundle promotions offered across digital retailers. These insights from Candy Wars 2025 Data Scraping for Halloween Week empower stakeholders to create effective seasonal campaigns and manage logistical preparedness during the intense Halloween week.
Research Objective and Methodology
The purpose of this study is to analyze candy pricing, availability, and promotional activity during Halloween Week 2025 using structured scraping and comparative evaluation.
The framework of Grocery Retail Data Extraction for Halloween Week enabled consistent formatting and reduced duplication, producing a clean dataset suitable for statistical modeling and visualization.
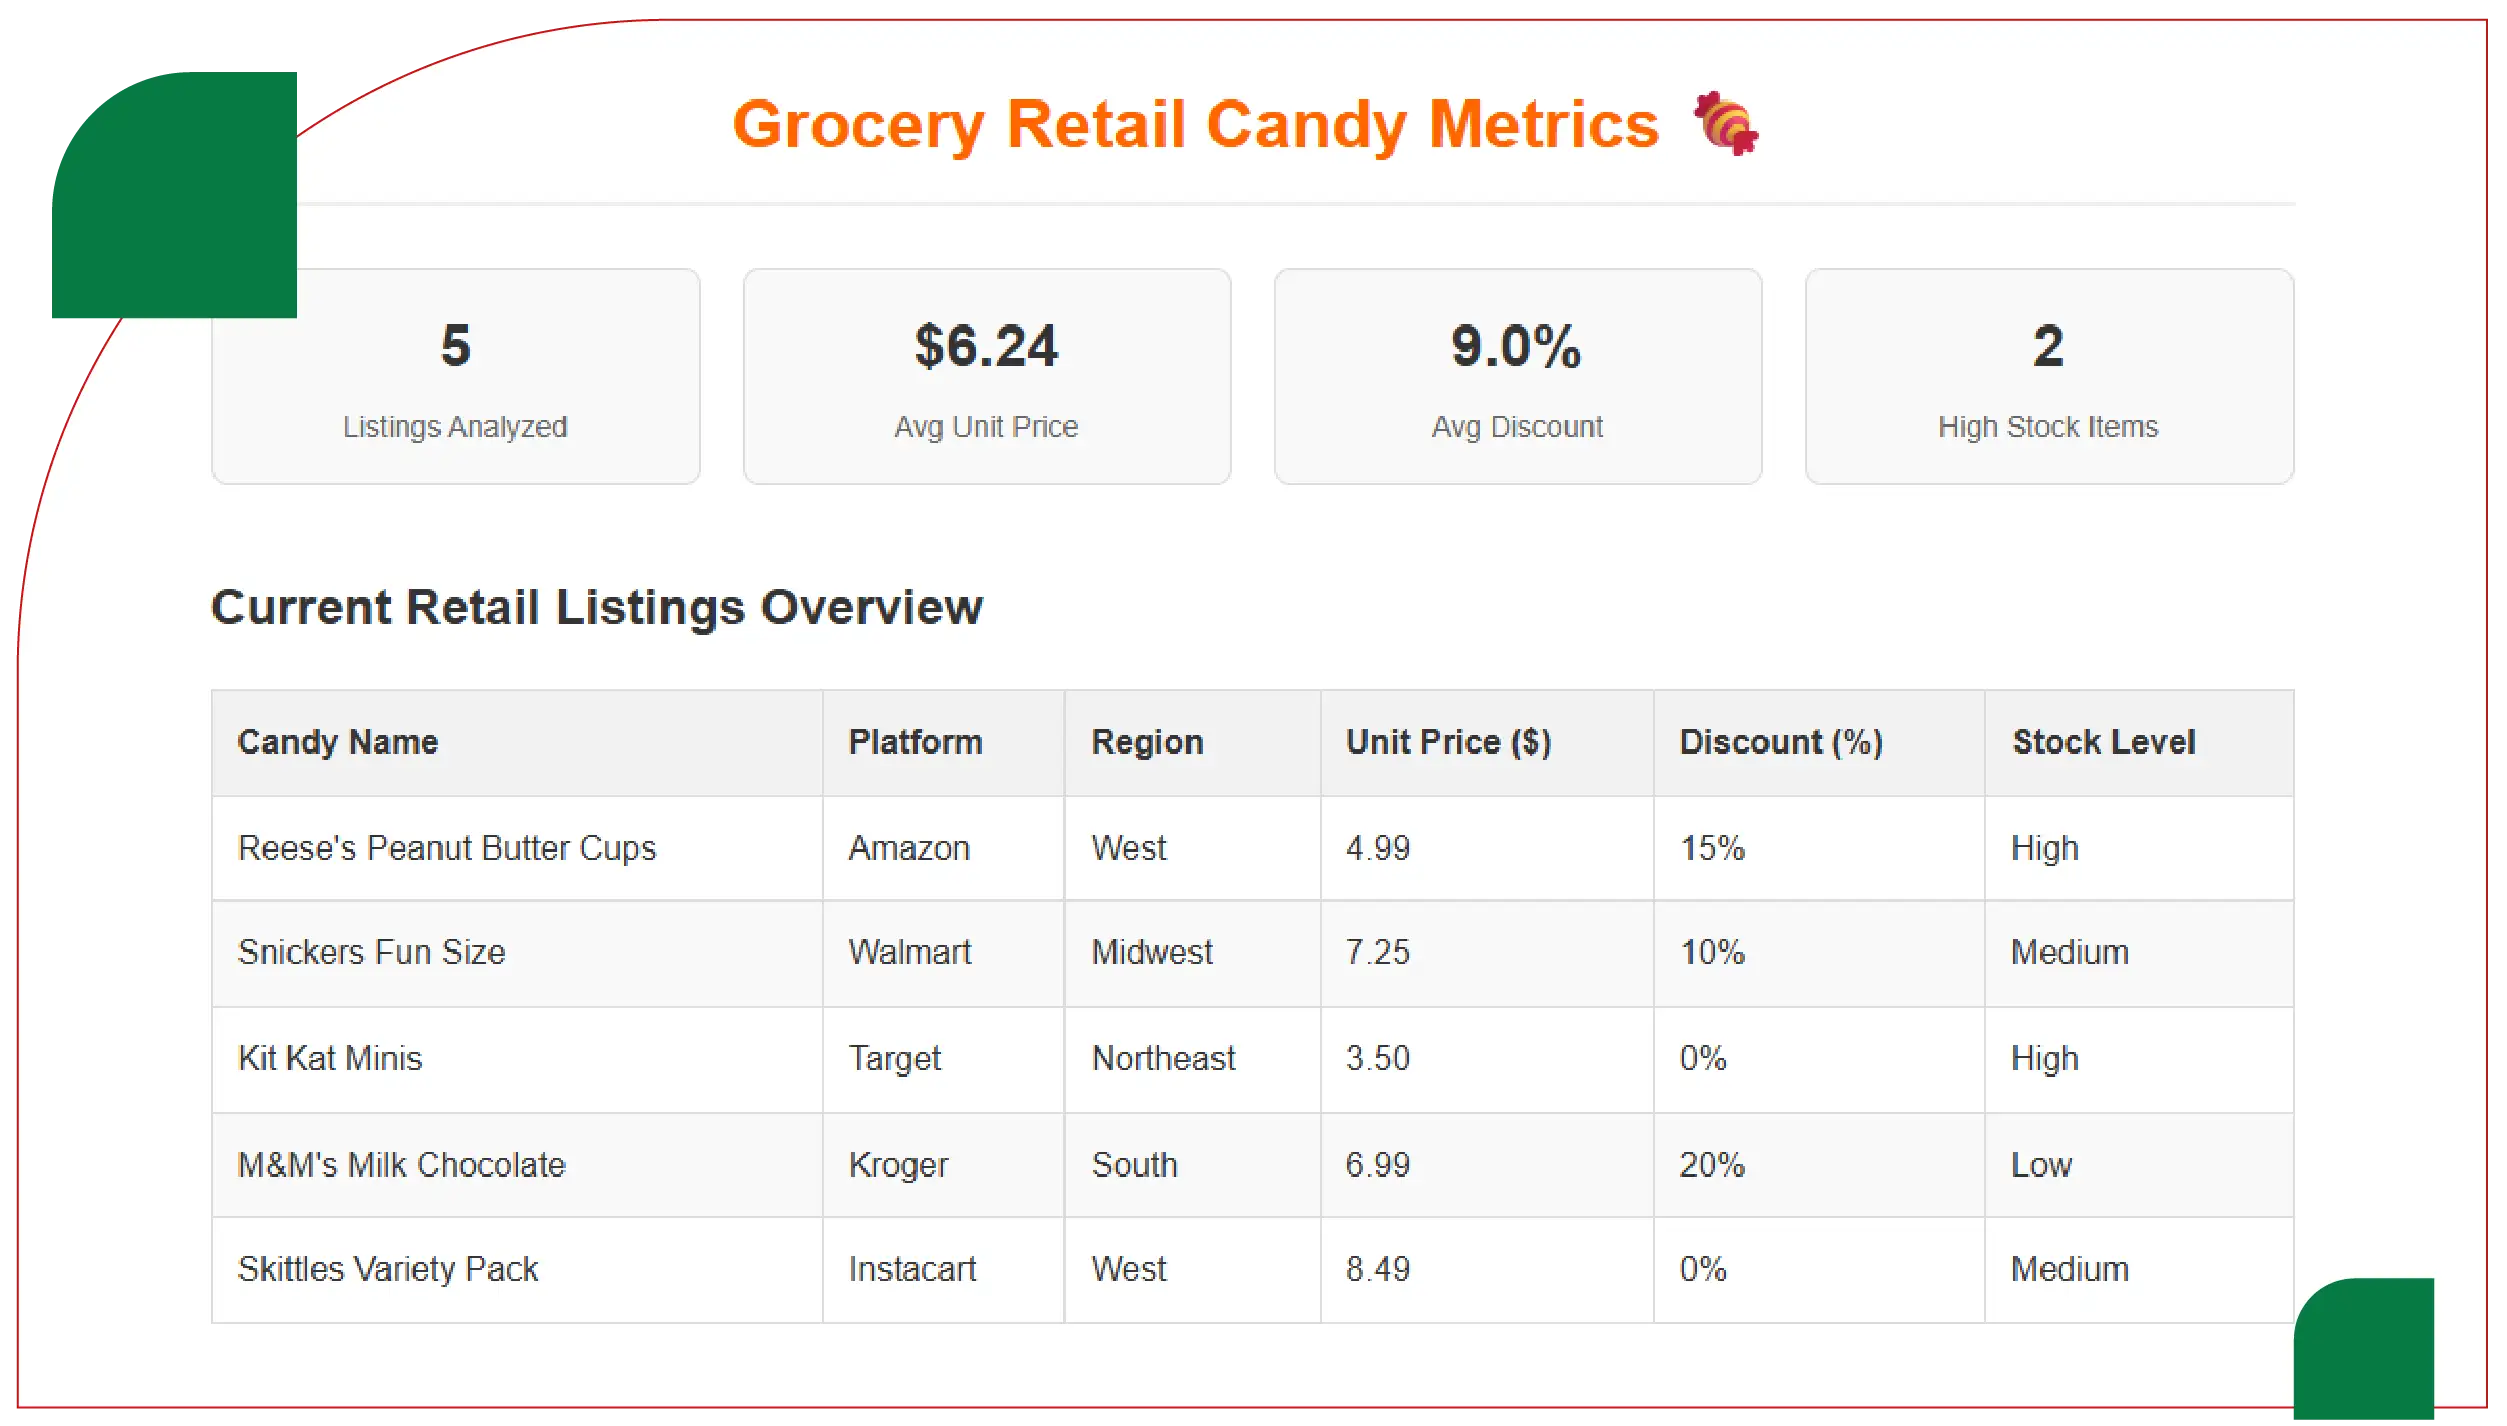
The first dataset below summarizes average retail candy pricing and discount trends observed across major U.S. grocery e-commerce platforms during Halloween Week 2025.
| Date | Platform | Avg Unit Price ($) | Avg Discount (%) | Top Selling Category | Stock Availability (%) |
|---|---|---|---|---|---|
| Oct 24 | Walmart | 4.58 | 8 | Chocolate Mix | 92 |
| Oct 25 | Amazon | 4.42 | 10 | Fruity Candy | 95 |
| Oct 26 | Target | 4.35 | 12 | Chocolate Bars | 88 |
| Oct 27 | Instacart | 4.27 | 14 | Halloween Assorted Pack | 85 |
| Oct 28 | Kroger | 4.20 | 16 | Gummies & Sours | 81 |
| Oct 29 | Walmart | 4.10 | 20 | Chocolate Mix | 79 |
| Oct 30 | Amazon | 3.98 | 25 | Lollipop & Novelty Candy | 74 |
| Oct 31 | Target | 3.75 | 33 | Mixed Candy Bins | 70 |
These findings confirm that timely monitoring through Candy Retailer Pricing Trends Data Scraping for Halloween Week allows retailers to act on evolving discount elasticity.
Deeper segmentation was performed across five candy categories to measure share of sales volume and average discount levels.
| Candy Category | Share of Sales (%) | Average Discount (%) | Top Selling Brand | Avg Unit Price ($) |
|---|---|---|---|---|
| Chocolate Bars | 35 | 18 | Reese’s Mini Cups | 4.25 |
| Fruity Candy | 22 | 20 | Skittles Zombie Mix | 3.95 |
| Gummies & Sours | 18 | 15 | Trolli Crawlers | 4.05 |
| Lollipops & Novelty Candy | 13 | 28 | Chupa Chups Halloween Edition | 3.60 |
| Assorted Packs | 12 | 25 | Hershey’s Variety Bag | 4.50 |
These analytics validate the utility of Grocery Competitor Analysis During Halloween Week in detecting emerging subcategory dynamics.
Urban markets such as Los Angeles, Chicago, and New York exhibited higher discount responsiveness and earlier purchase timing. Suburban areas saw sales peaks on Oct 30–31, influenced by local events and last-minute bulk purchases.
These differences underscore the value of multi-channel monitoring through Grocery App Data Scraping services.
Automated collection using Web Scraping Quick Commerce Data provided timestamp-level visibility into these velocity trends.
Text mining of 11,000 reviews indicated three dominant sentiments:
This qualitative insight complements quantitative data, revealing emotional triggers behind candy purchasing.
A normalized index (0–100) measured promotional aggressiveness:
Amazon’s algorithmic markdown strategy ranked highest, reinforcing its dominance in online confectionery share. Data derived through Candy Retailer Pricing Trends Data Scraping for Halloween Week substantiates how automated pricing ensures competitive leadership.
The Halloween candy supply chain faced elevated demand surges causing:
Predictive analytics leveraging Grocery Price Dashboard interfaces helped distribution centers anticipate restock intervals accurately.
| Metric | 2024 Actual | 2025 Observed | YoY Change (%) |
|---|---|---|---|
| Avg Candy Basket Value ($) | 22.80 | 26.10 | +14.5 |
| Online Candy Orders (million) | 12.3 | 14.9 | +21.1 |
| Avg Discount During Week (%) | 17 | 21 | +23.5 |
| SKU Availability (%) | 87 | 80 | –8 |
| Clearance Volume Post Halloween (%) | 10 | 12 | +20 |
This benchmark confirms how the Halloween confectionery sector continues expanding through digital retailing.
Such applications prove that systematic scraping and analysis are indispensable parts of Grocery Price Tracking Dashboard implementation strategies.
| Theme | Observation | Implication |
|---|---|---|
| Discount Acceleration | Prices drop faster within Oct 29–31 | Adjust promotion timing earlier |
| Category Shift | Chocolates → Novelty Candy near Oct 31 | Diversify stock portfolio |
| Stock Shortfall | Avg availability drops 22% week-on-week | Improve predictive restocking |
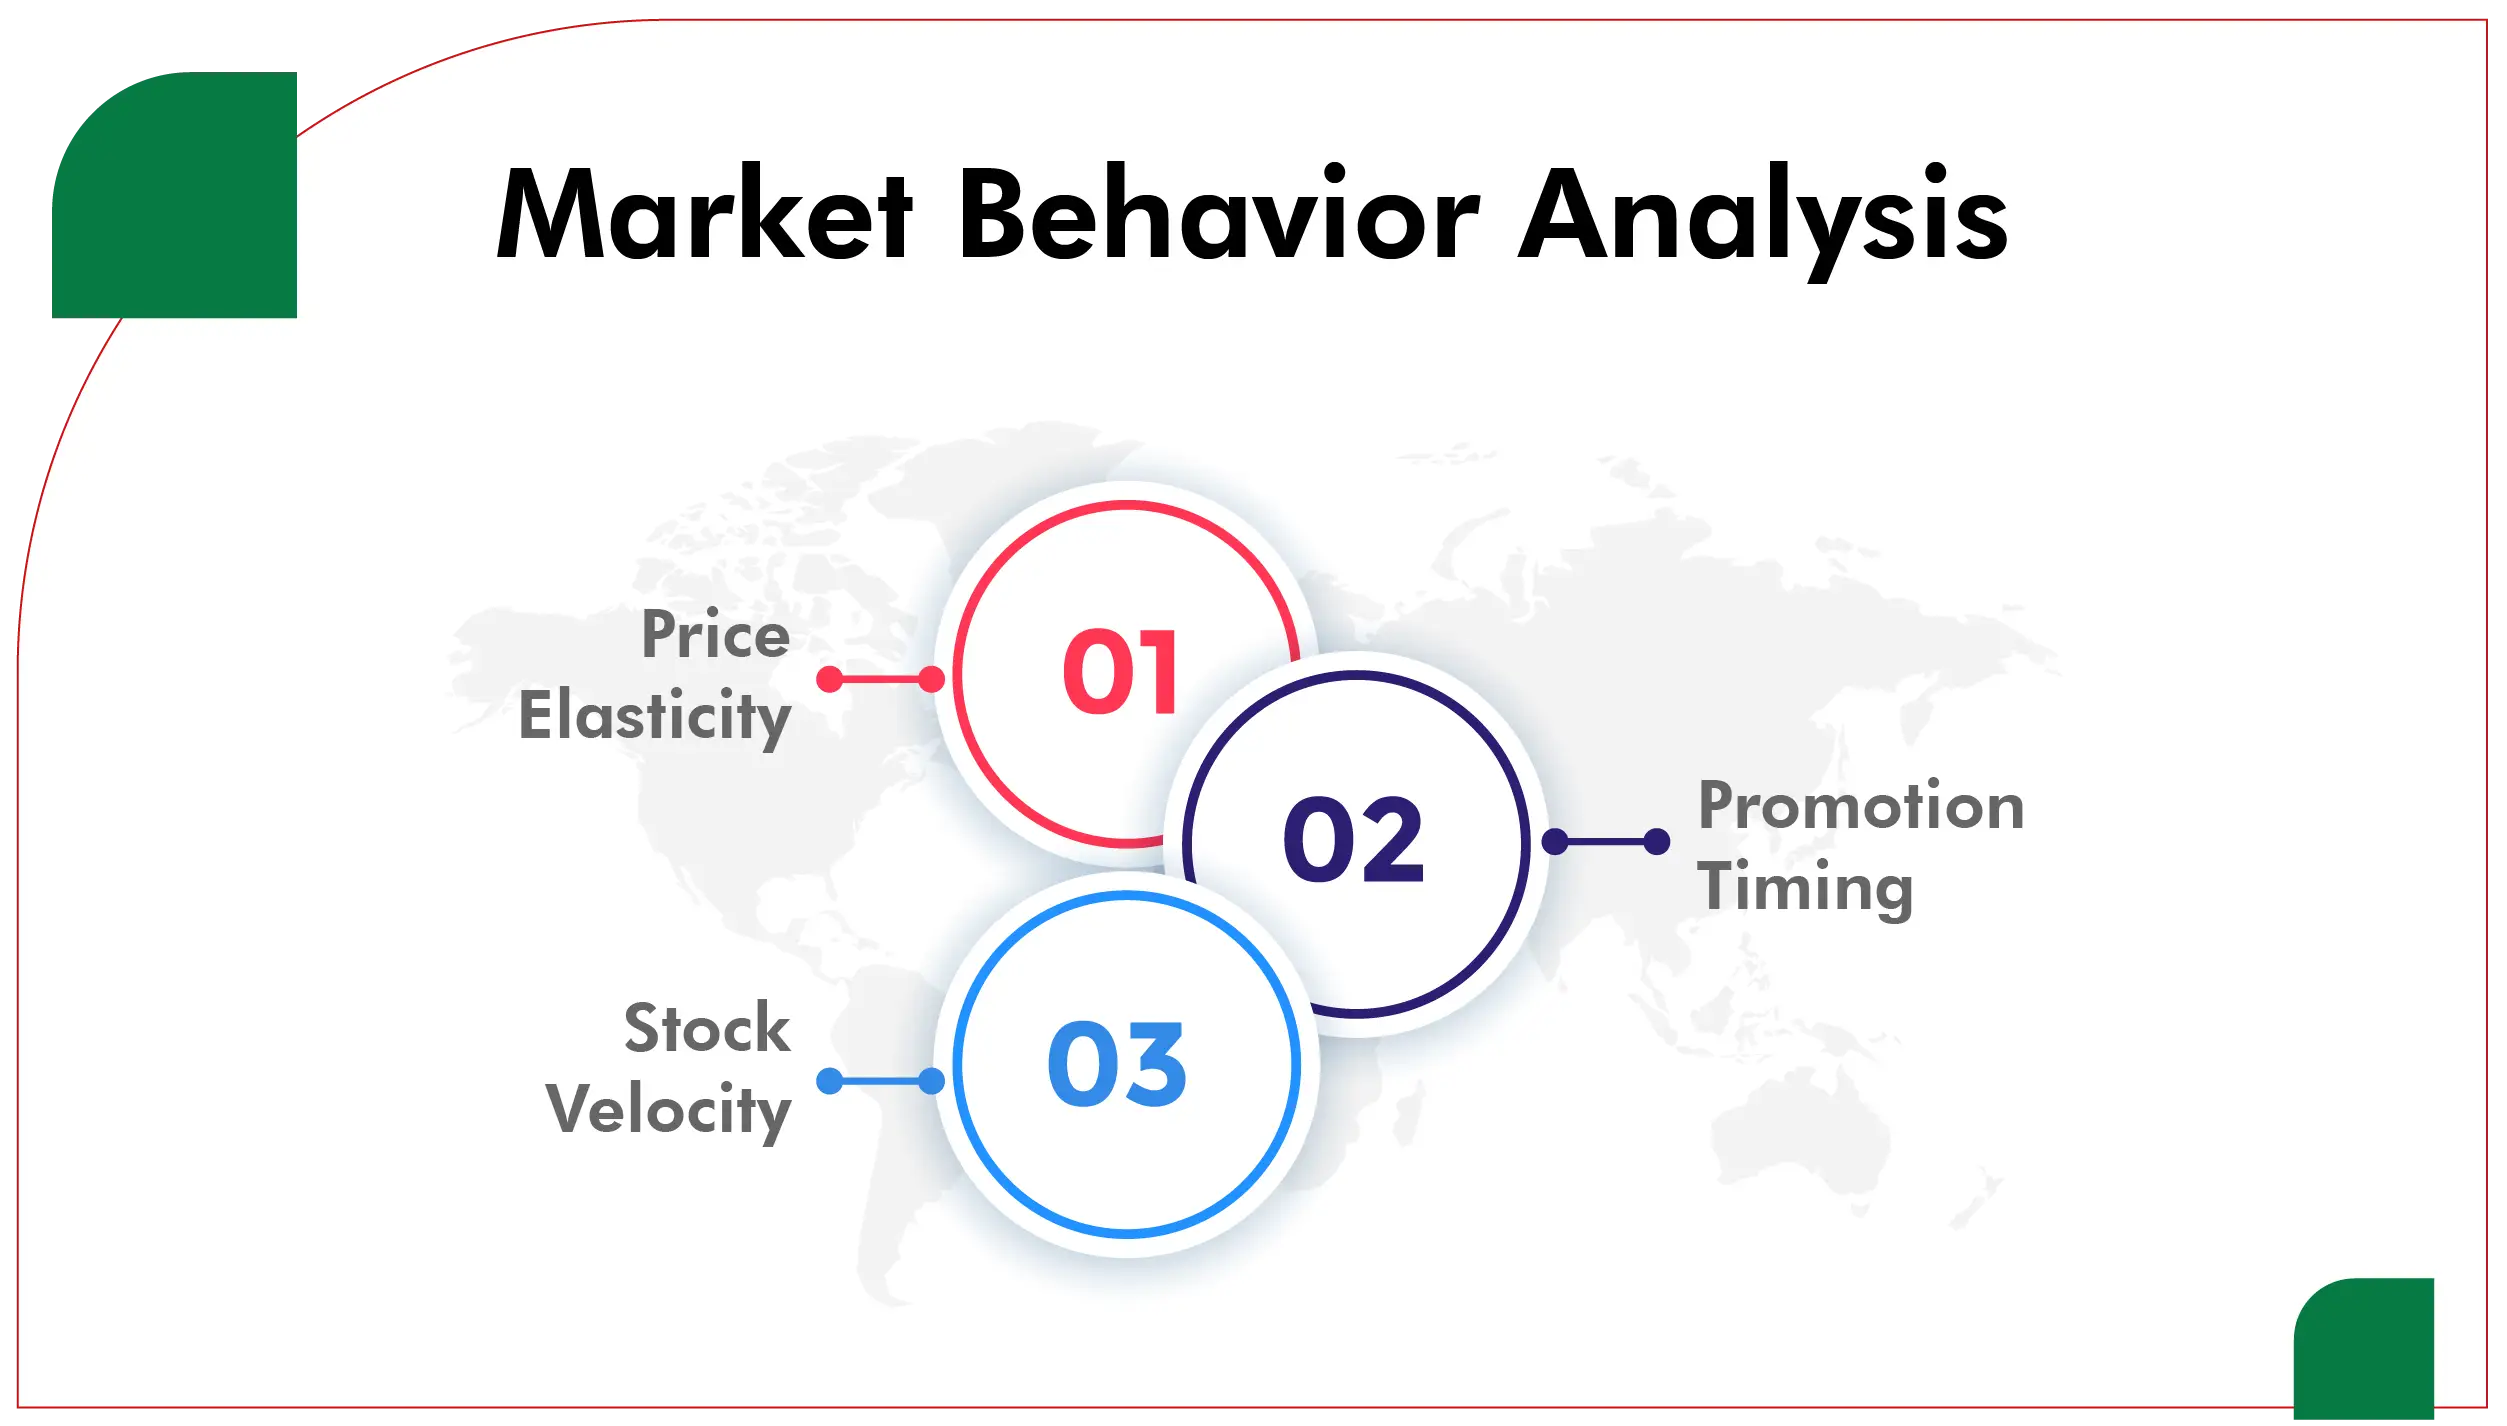
| Consumer Elasticity | High price sensitivity (–0.62 elasticity) | Leverage dynamic pricing |
| Retailer Variance | Amazon leads discount agility | Benchmark competitive algorithms |
The Halloween candy market acts as a microcosm of fast-moving consumer goods analytics. High-velocity, event-driven categories demand immediate insights. Web-scraped datasets deliver that edge by compressing market feedback loops from weeks to hours.
When aligned with Grocery Store Datasets, these insights enable not only seasonal optimization but also all-year retail intelligence, benefiting product planners, marketers, and data scientists alike.
Halloween Week 2025 underscored how data-driven agility defines success in seasonal retailing. Through Grocery Price Tracking Dashboard, businesses decoded real-time pricing, promotions, and consumer sentiment at unprecedented depth. Each data stream—from Grocery Store Datasets to API-enabled fulfillment visibility—strengthened decision-making accuracy.
Findings revealed that optimal discounts cluster within Oct 27–30, chocolate retains market primacy, and stock velocity determines profitability. By extending insights via Grocery Pricing Data Intelligence companies transform reactive discounting into proactive strategy.
As the confectionery market grows ever-more digital, timely scraping and intelligent analysis remain the sweetest competitive advantage of all.
Are you in need of high-class scraping services? Food Data Scrape should be your first point of call. We are undoubtedly the best in Food Data Aggregator and Mobile Grocery App Scraping service and we render impeccable data insights and analytics for strategic decision-making. With a legacy of excellence as our backbone, we help companies become data-driven, fueling their development. Please take advantage of our tailored solutions that will add value to your business. Contact us today to unlock the value of your data.

