Introduction
In today’s competitive grocery delivery landscape, stockouts — or the unavailability of specific products — play a major role in customer satisfaction and retailer performance. Shoppers expect reliable inventory across platforms like Amazon Fresh and Walmart Grocery, yet stockout rates vary depending on region, demand patterns, and supply chain efficiency.
This blog, powered by real-time data from Food Data Scrape, dives into how stockout trends compare across Amazon Fresh and Walmart Grocery in 2025. We’ll examine categories most affected, show sample datasets, and offer insights for retailers and data analysts.
Why Track Stockouts?

Stockouts not only frustrate customers but also impact brand loyalty and conversion rates. For grocery retailers operating in fast-paced environments, a 2–5% stockout rate can lead to thousands of missed sales weekly. Tracking stockouts helps:
- Monitor supply chain efficiency
- Optimize warehouse operations
- Predict high-demand SKUs
- Fine-tune replenishment cycles
Methodology
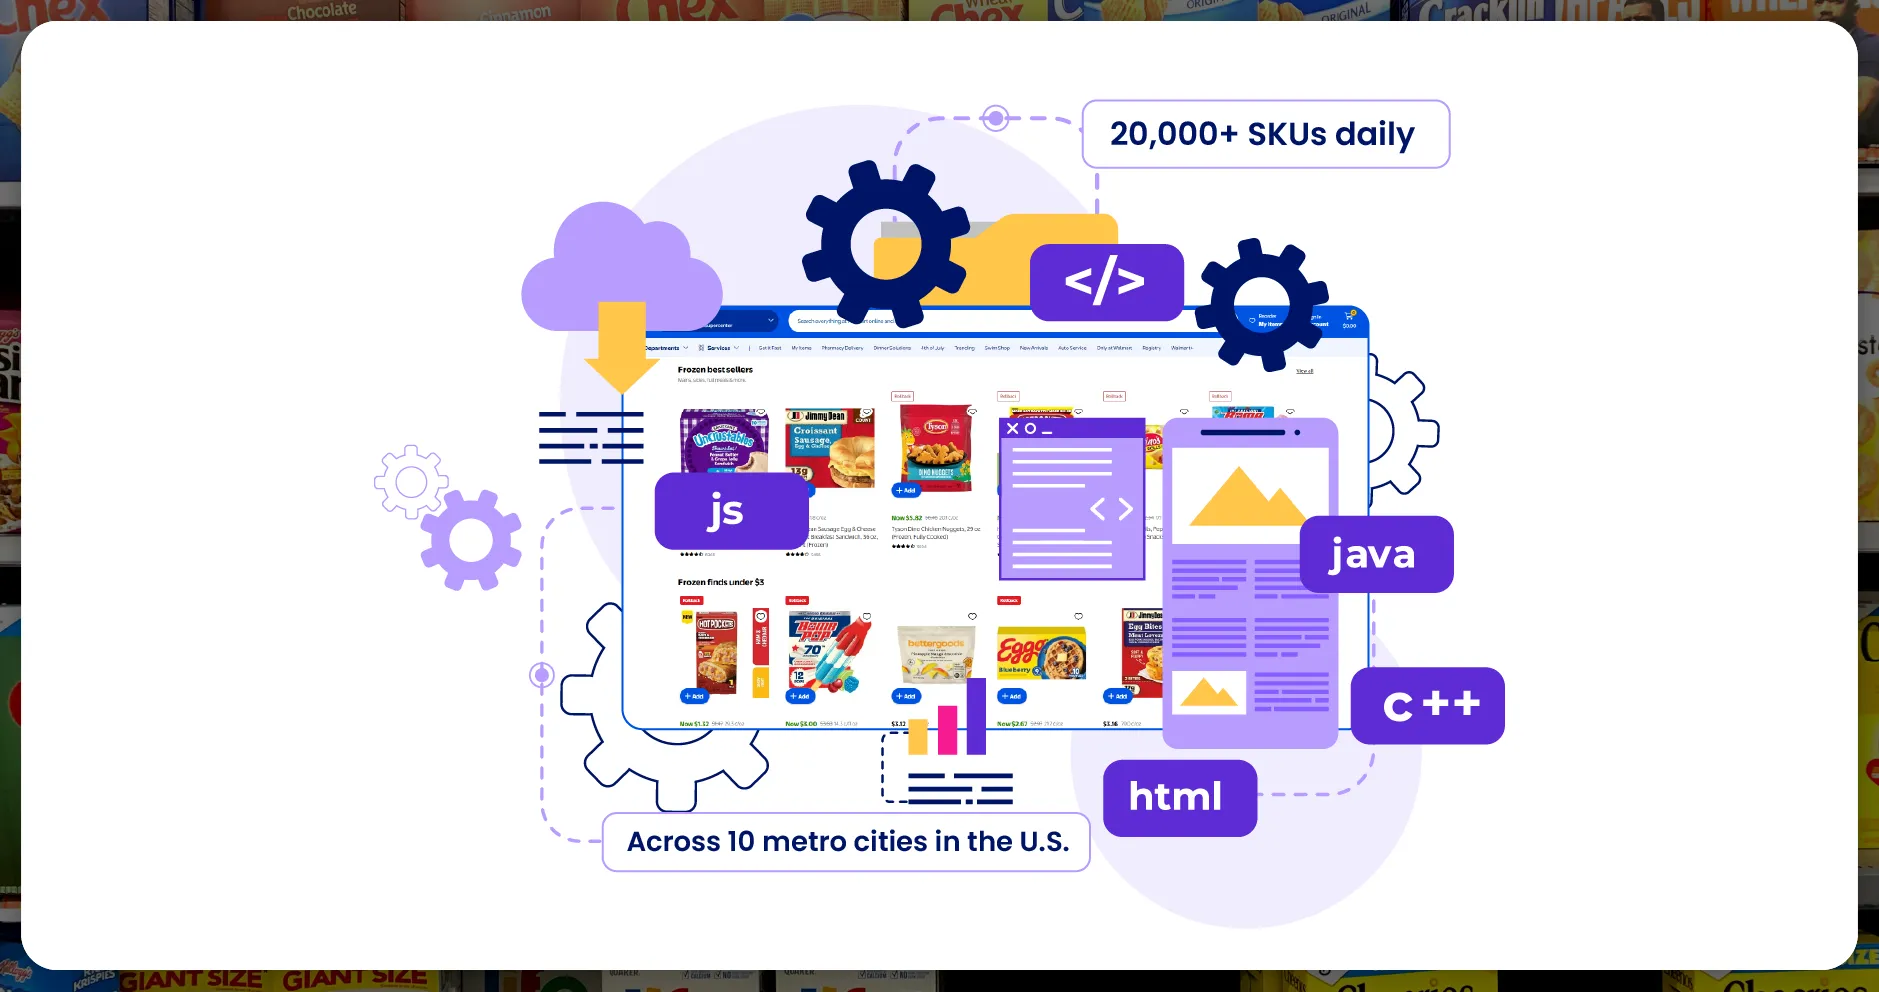
Food Data Scrape monitors grocery e-commerce platforms through structured scraping pipelines and API integrations. For this analysis, we collected:
- 20,000+ SKUs daily
- Across 10 metro cities in the U.S.
- For a period of 30 days (May 2025)
- Categories: Fruits & Vegetables, Dairy, Meat, Packaged Foods, and Beverages
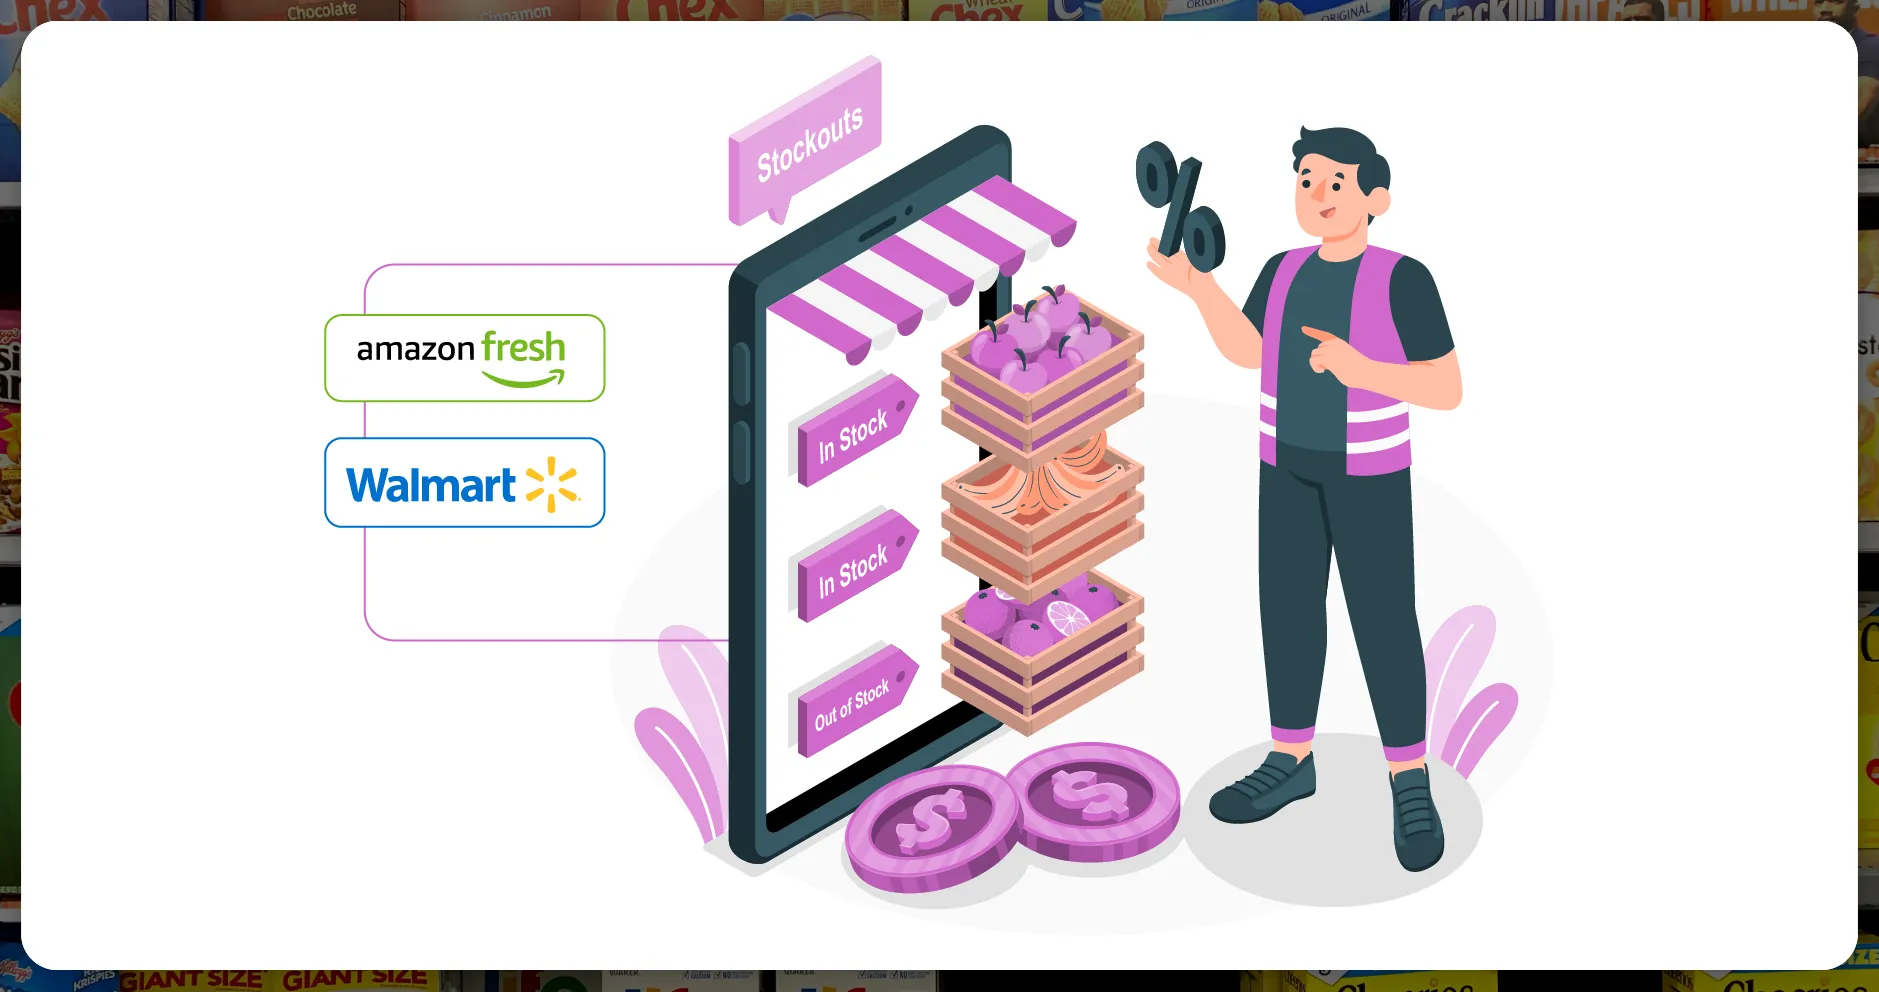
Each item was tagged as:
- In-stock
- Out-of-stock
- Low inventory
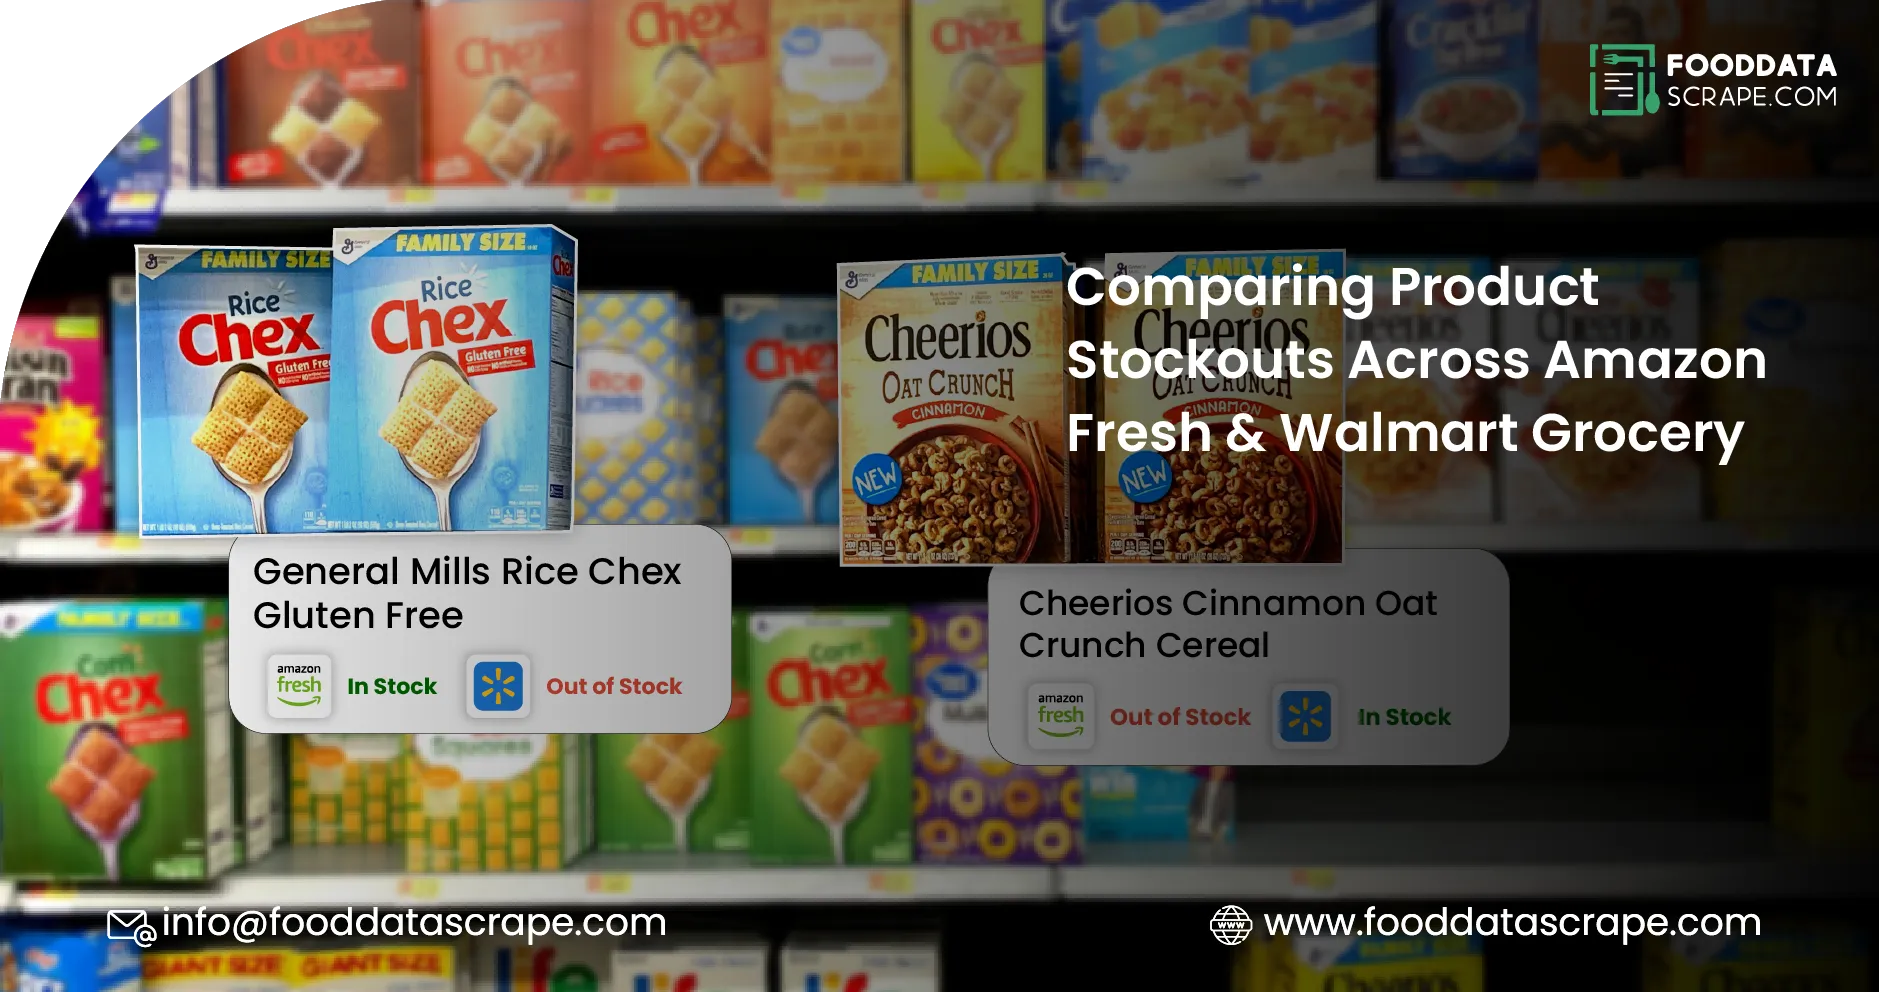
Sample Stockout Dataset
| Date | Retailer | Category | Product | Status | City |
|---|---|---|---|---|---|
| 2025-05-01 | Amazon Fresh | Dairy | Organic Whole Milk | Out-of-stock | Chicago |
| 2025-05-01 | Walmart Grocery | Dairy | Organic Whole Milk | In-stock | Chicago |
| 2025-05-03 | Amazon Fresh | Vegetables | Baby Spinach | Low inventory | Los Angeles |
| 2025-05-03 | Walmart Grocery | Vegetables | Baby Spinach | Out-of-stock | Los Angeles |
| 2025-05-10 | Amazon Fresh | Beverages | Oat Milk Latte | Out-of-stock | Miami |
| 2025-05-10 | Walmart Grocery | Beverages | Oat Milk Latte | In-stock | Miami |
Stockout Rates by Retailer
Amazon Fresh
- Average Stockout Rate: 7.4%
- Most Affected Categories: Beverages (11.2%), Dairy (9.5%)
- Peak Stockout Days: Sundays and Mondays
- Cities with Highest Stockouts: New York, San Francisco
Walmart Grocery
- Average Stockout Rate: 5.8%
- Most Affected Categories: Vegetables (8.7%), Dairy (7.1%)
- Peak Stockout Days: Fridays and weekends
- Cities with Highest Stockouts: Dallas, Los Angeles
Weekly Trends in May 2025
Food Data Scrape’s dashboard highlighted some unique weekly stockout patterns:
- Week 1: Amazon Fresh saw high stockouts in beverages after a regional heatwave.
- Week 2: Walmart had difficulty replenishing leafy greens in California stores.
- Week 3: Amazon Fresh improved dairy restocks post-supplier adjustment.
- Week 4: Walmart outperformed in all categories except packaged snacks.
Category-Wise Comparison
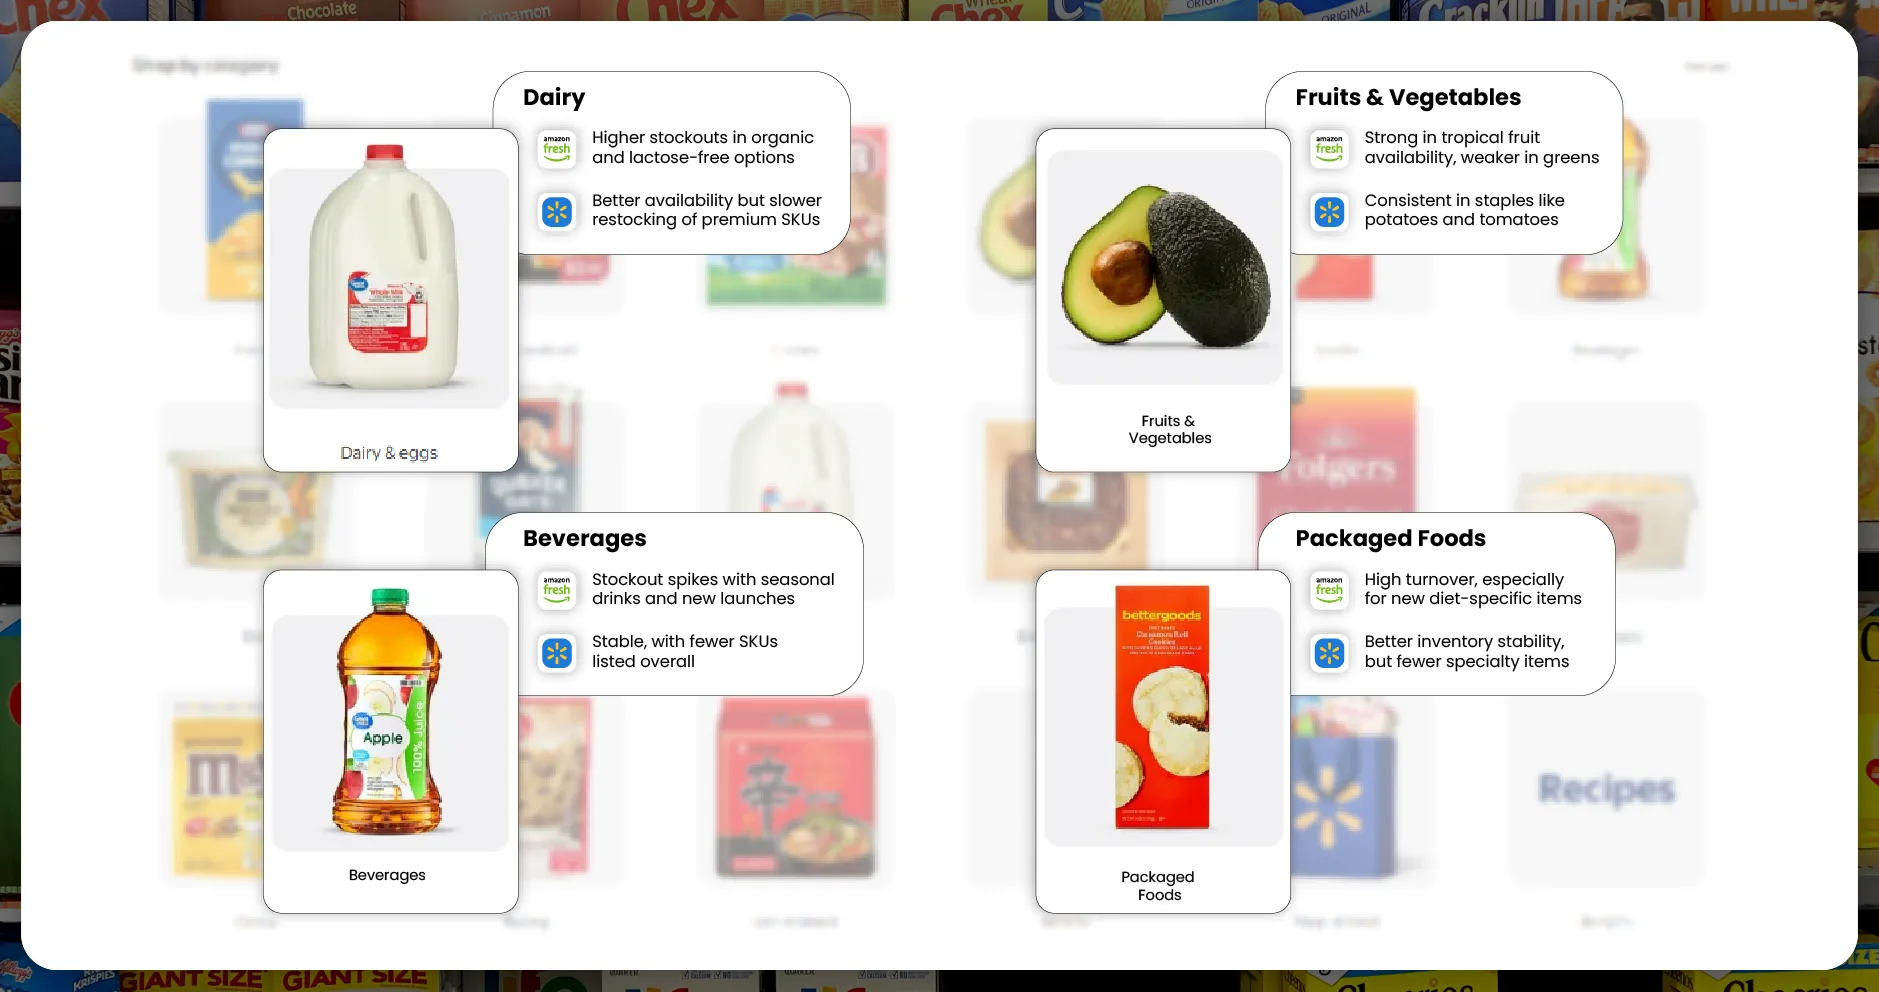
1. Dairy
- Amazon Fresh: Higher stockouts in organic and lactose-free options
- Walmart Grocery: Better availability but slower restocking of premium SKUs
2. Fruits & Vegetables
- Amazon Fresh: Strong in tropical fruit availability, weaker in greens
- Walmart Grocery: Consistent in staples like potatoes and tomatoes
3. Beverages
- Amazon Fresh: Stockout spikes with seasonal drinks and new launches
- Walmart Grocery: Stable, with fewer SKUs listed overall
4. Packaged Foods
- Amazon Fresh: High turnover, especially for new diet-specific items
- Walmart Grocery: Better inventory stability, but fewer specialty items
Visualizing the Data
Stockout Rates by City (Bar Chart)
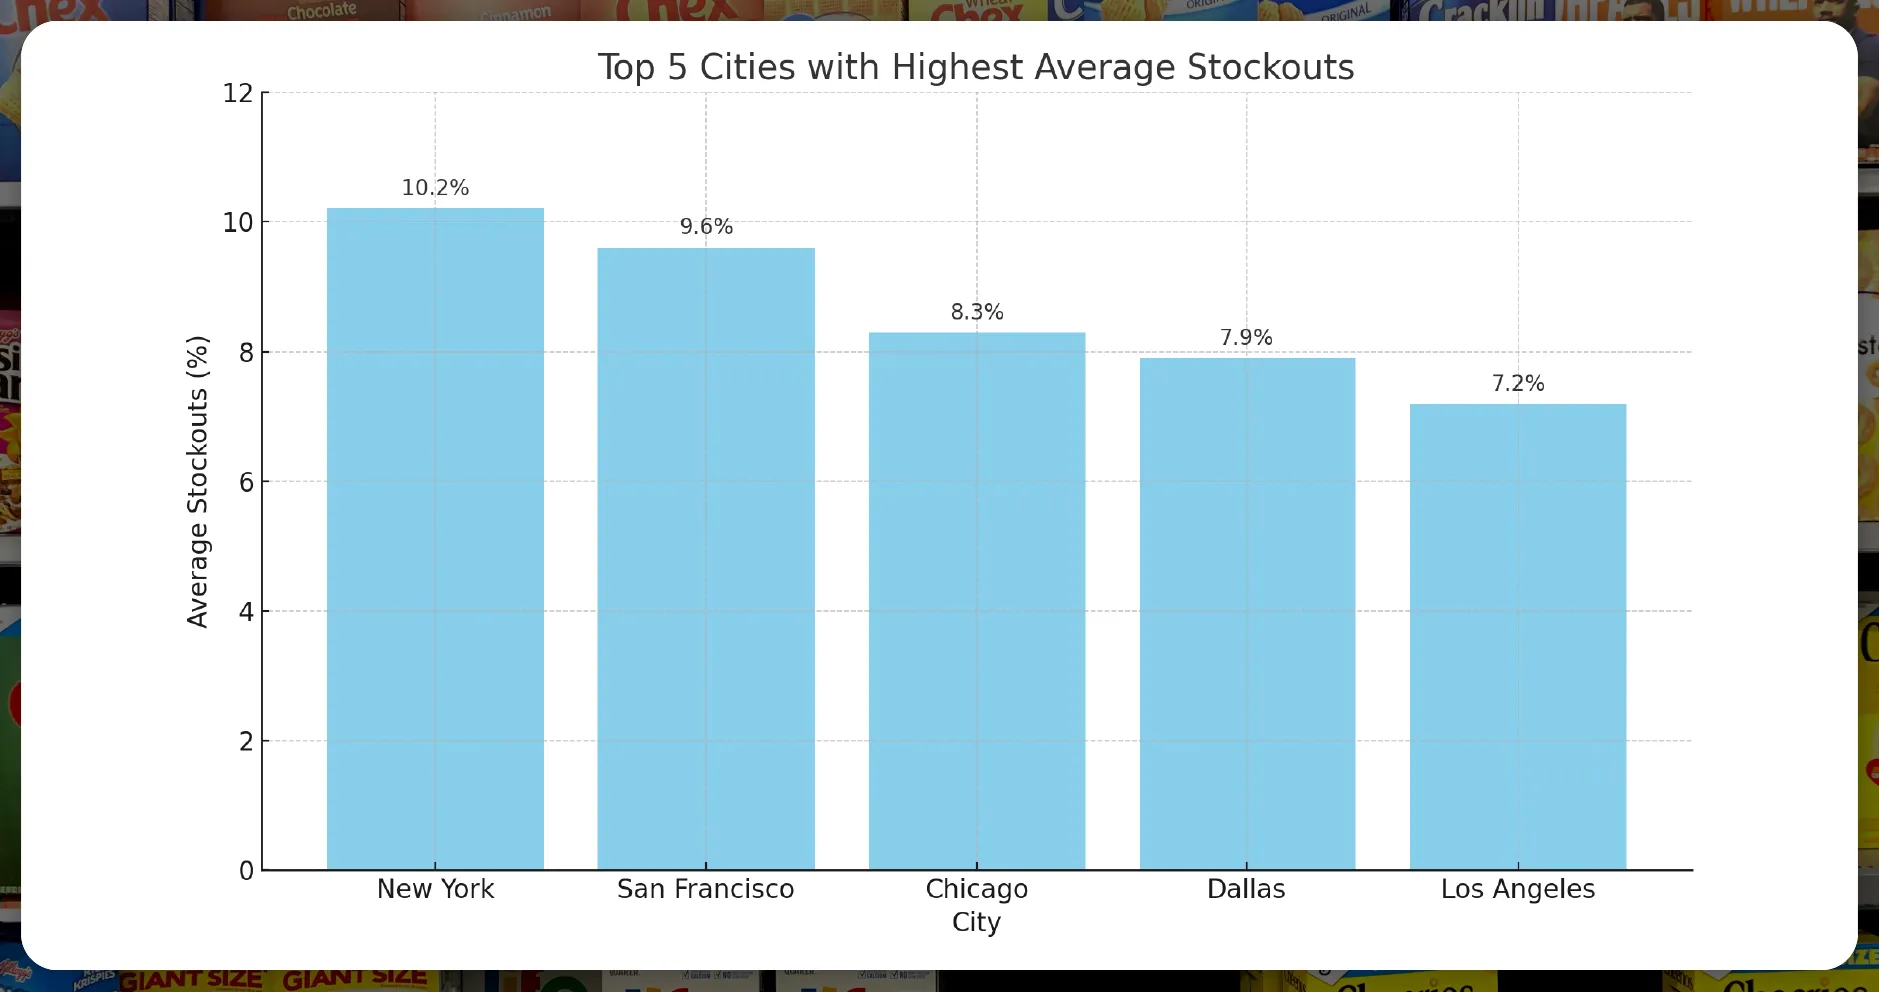
Top 5 cities with highest average stockouts:
- 1. New York – 10.2%
- 2. San Francisco – 9.6%
- 3. Chicago – 8.3%
- 4. Dallas – 7.9%
- 5. Los Angeles – 7.2%
Daily Stockout Heatmap (Amazon Fresh)
Heatmaps revealed that stockouts spike after weekends, particularly Mondays and holidays.
Category-Based Radar Graph
Comparing stockout sensitivity between Amazon and Walmart across five categories.
Implications for Retailers and Shoppers
For Retailers:
- Predictive Restocking : Use scraping data to preemptively restock high-risk SKUs.
- Regional Inventory Optimization: Tailor stock to local demand variations.
- Customer Retention: Reduce bounce rates by minimizing OOS (Out-of-Stock) items.
For Shoppers:
- Better Planning: Use trends to anticipate which items might be missing.
- Platform Switching: Consider checking both platforms before checkout.
How Food Data Scrape Helps
At Food Data Scrape, we specialize in:
- E-commerce grocery scraping
- Stockout pattern analysis
- Retail inventory monitoring tools
- Daily and weekly trend dashboards
Our tools empower grocery startups, CPG brands, and eCommerce analysts to stay ahead of demand shocks and operational bottlenecks.
Conclusion
Stockouts are an inevitable part of grocery e-commerce, but data-driven monitoring makes them manageable. Amazon Fresh and Walmart Grocery each have their strengths and blind spots, and analyzing their stockout patterns reveals critical insights for both businesses and consumers.
Looking to integrate stockout data into your operations?
Contact Food Data Scrape to explore custom scraping pipelines and real-time inventory insights.

