The Client
The client, a leading FMCG company specializing in condiments and sauces, faced challenges in tracking dynamic pricing and demand fluctuations across multiple quick commerce platforms. With high competition and frequent promotions, gaining accurate insights was critical. Our solution enabled Quick Commerce Sauce Price Monitoring, providing real-time visibility into competitor pricing, surge pricing trends, and promotional campaigns. By leveraging Demand Shift Analysis for Mayonnaise & Sauces Category, the client could identify demand spikes during festivals, weekends, and special occasions, enabling timely production and inventory planning. The insights highlighted top-selling SKUs and regional consumption patterns, facilitating strategic marketing and stocking decisions. Furthermore, we helped the client Extract Festival Wise Mayonnaise & Sauces Demand & Category Data, delivering structured datasets for seamless analysis and integration into internal dashboards. These insights empowered the client to optimize pricing strategies, enhance operational efficiency, and maximize revenue across high-demand periods.
Data Extracted for the Client
The solution collected granular datasets including:
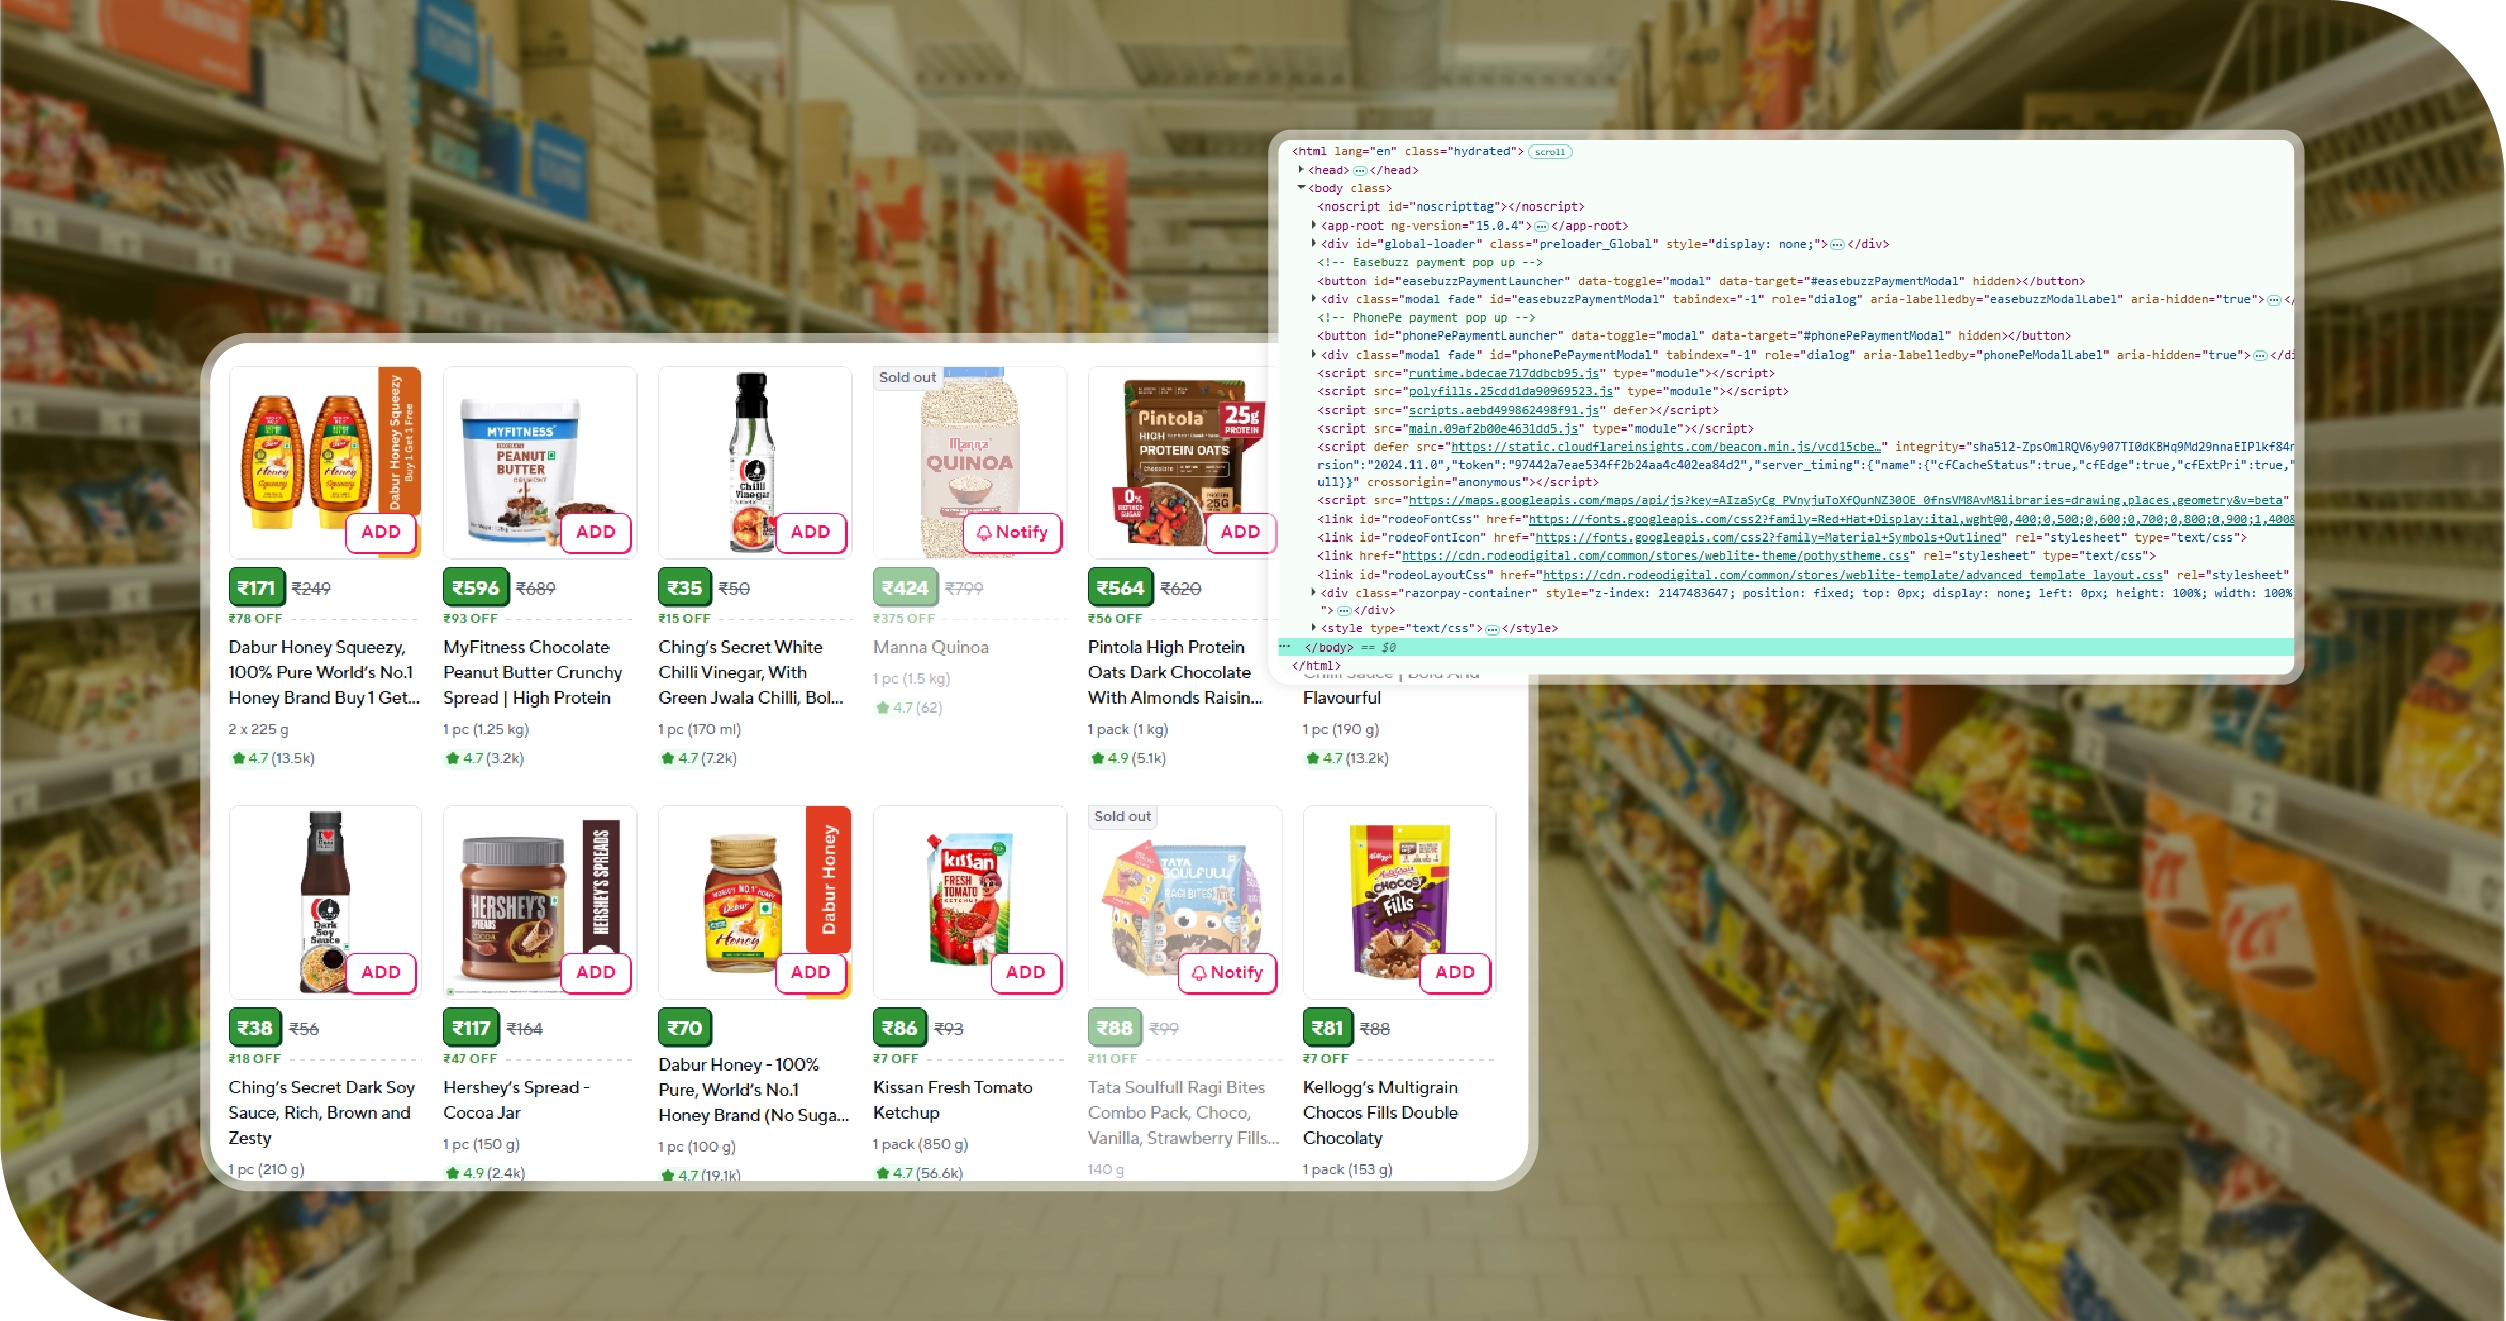
- SKU-Level Pricing & Pack Size: Product name, size, MRP, platform-wise price, and surge percentage.
- Stock Status: In-stock, out-of-stock, and low-stock indicators.
- Promotional Data: Discount frequency, discount range, and special offers.
- Category & Brand Information: Mayonnaise, sauces, dips, dressings, and marinades for multiple brands.
- Regional & Platform Trends: City-wise sales trends, weekend & festival demand spikes, and platform-specific popularity.
Platforms & Categories Covered
| Platforms | Product Categories |
|---|---|
| Blinkit | Mayonnaise, Sauces, Dips, Dressings |
| Zepto | Mayonnaise, Sauces, Dips, Dressings |
| Instamart | Mayonnaise, Sauces, Dips, Dressings |
| Amazon | Mayonnaise, Sauces, Dips, Dressings |
| Flipkart | Mayonnaise, Sauces, Dips, Dressings |
Key Challenges
- Inconsistent SKU-Level Insights
The client struggled to track pricing and demand at the SKU level across multiple quick commerce platforms. Accurate, granular data was essential, necessitating reliable tools to Scrape SKU Level Mayonnaise & Sauces Category Data consistently. - Regional Demand Variability
Understanding consumption patterns across different cities and regions was difficult. The client required detailed, actionable insights, which prompted the use of a Region-Wise Sauces Demand Data Scraper to capture variations in demand and sales trends. - Multi-Platform Data Extraction Challenges
Collecting timely and structured data from diverse Q-commerce apps posed technical hurdles. The client needed a robust solution like Blinkit Grocery Delivery Scraping API to ensure seamless extraction of prices, stock levels, and promotional details across platforms.
Key Solutions
- Real-Time Data Extraction
We implemented an advanced extraction system to capture SKU-level pricing, stock, and promotions across multiple grocery platforms. Utilizing Grocery App Data Scraping services, the client received accurate, timely data for informed pricing and inventory decisions. - Interactive Analytics Dashboard
A comprehensive dashboard was developed to visualize trends, demand spikes, and top-selling SKUs. With the Grocery Price Dashboard, the client could monitor regional variations, surge pricing, and product performance in a centralized, easy-to-access interface. - Scalable API Integration
Our robust API solution ensured seamless data retrieval from multiple grocery delivery platforms. Leveraging Grocery Delivery Scraping API Services, the client achieved automated, structured data collection for smooth integration with internal analytics tools.
Table 1: Blinkit vs Other Platforms – Price Surge Comparison
| Product Name | Blinkit Price (₹) | Zepto Price (₹) | Instamart Price (₹) | Amazon/BigBasket Price (₹) | Blinkit Surge (%) |
|---|---|---|---|---|---|
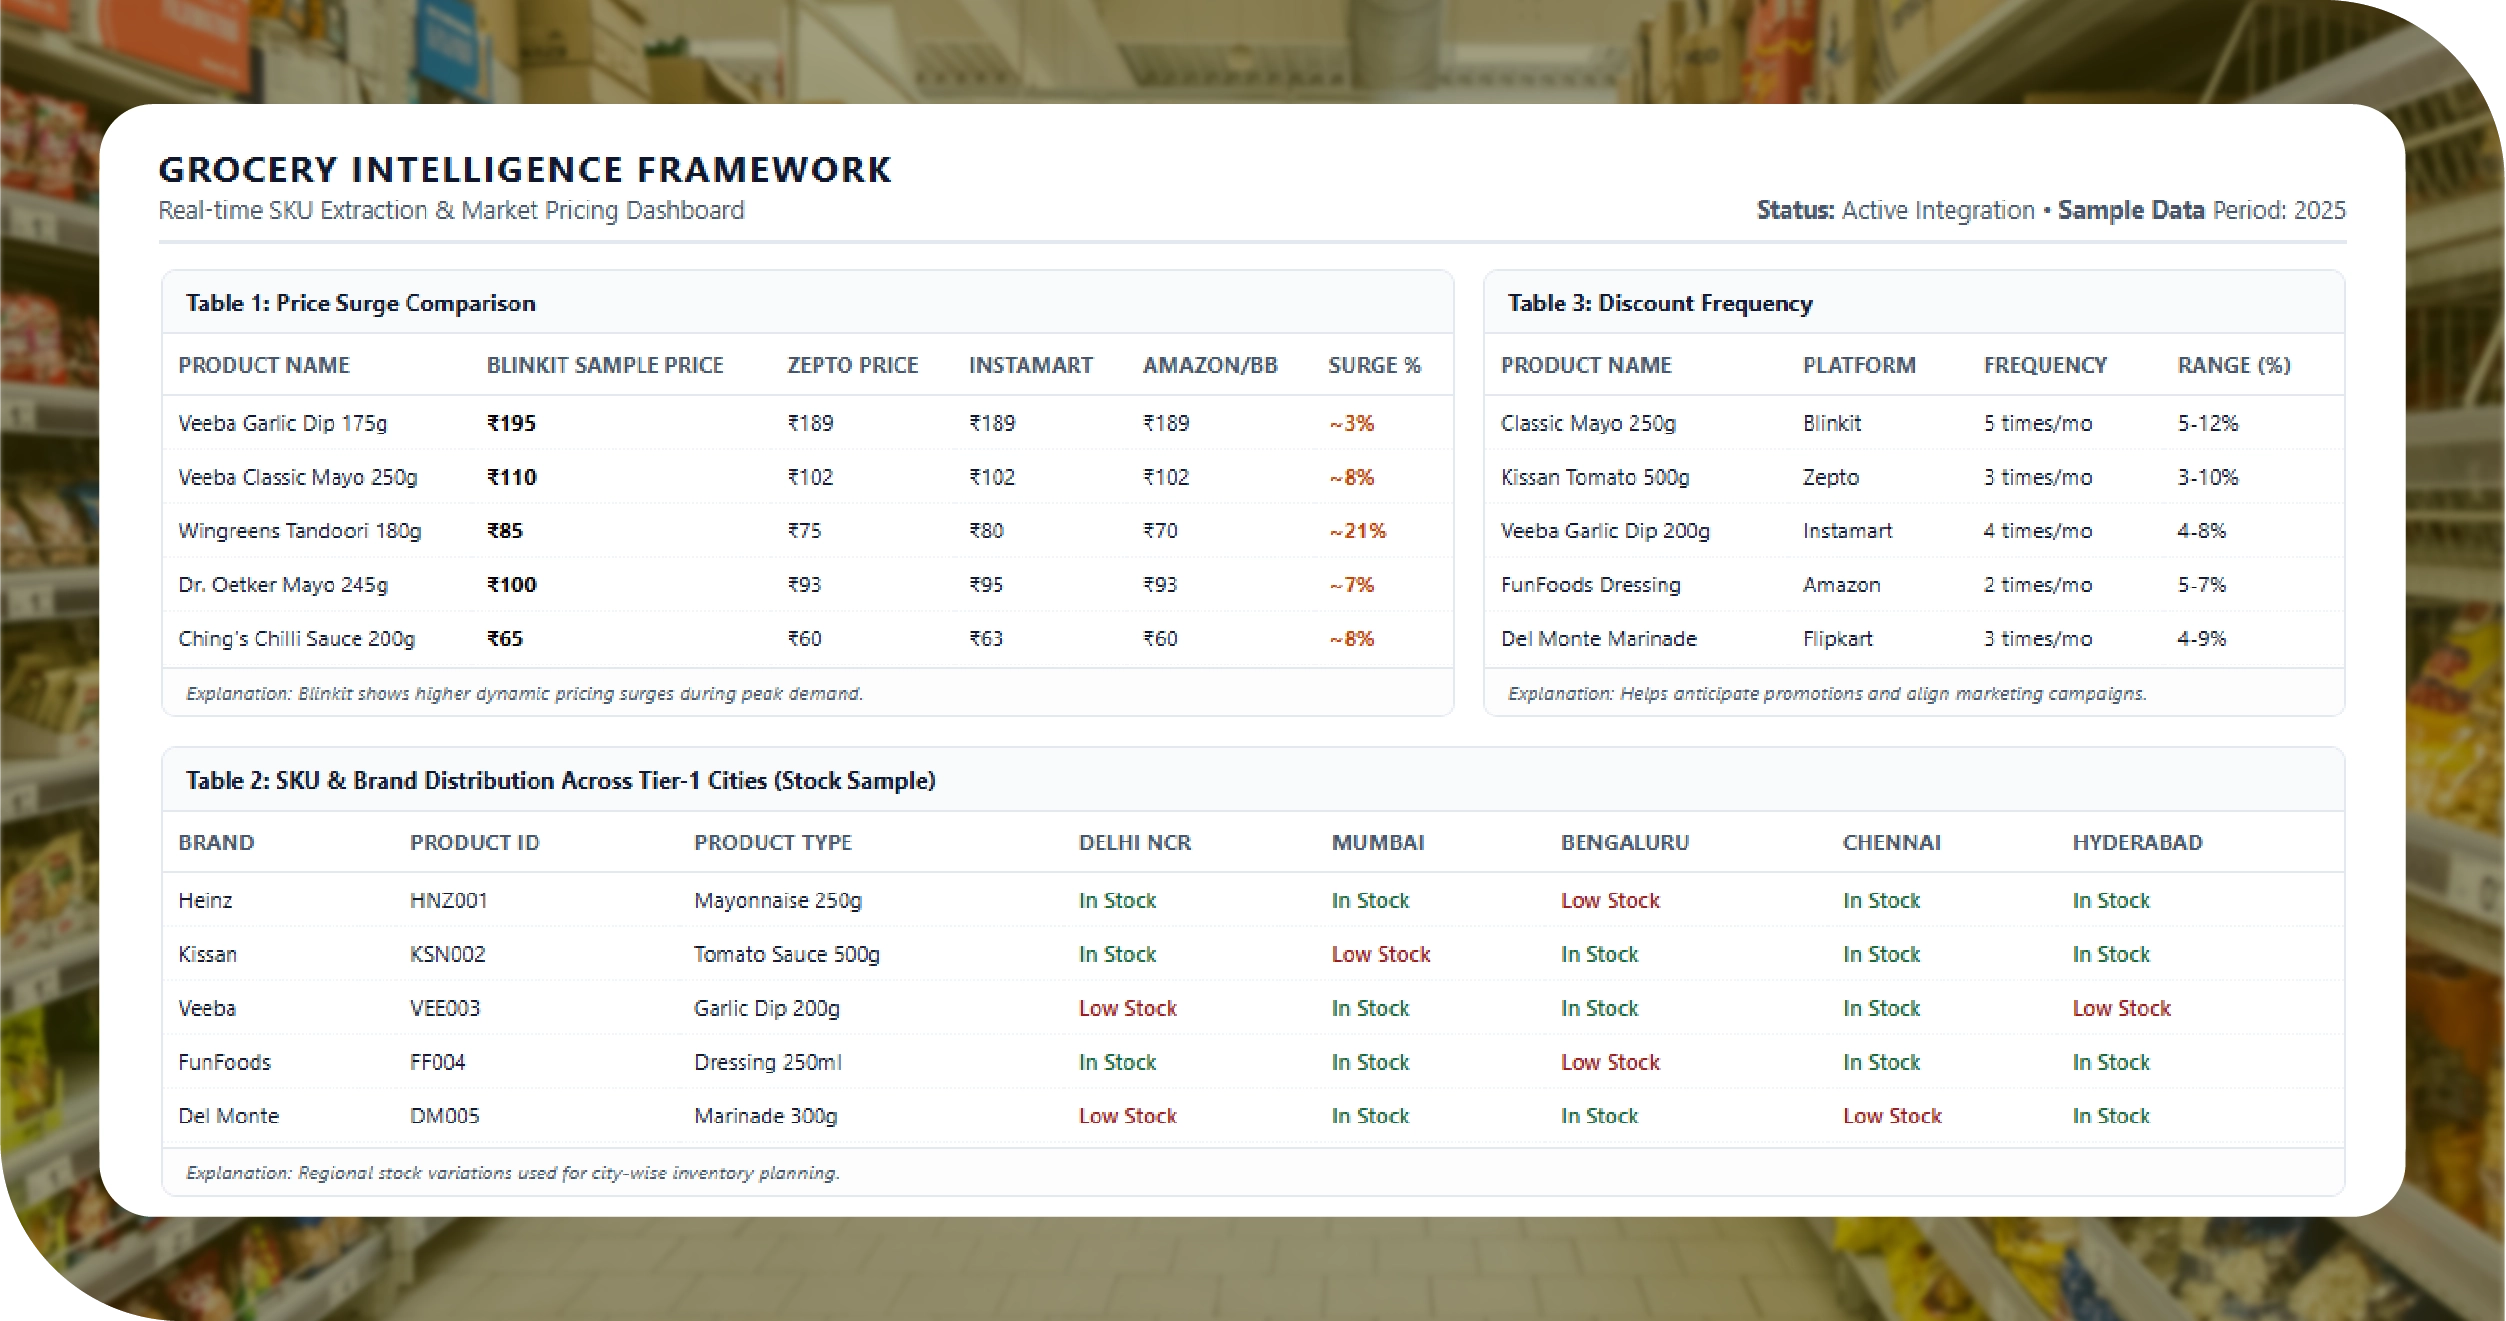
| Veeba Garlic Dip 175g | ₹195 | ₹189 | ₹189 | ₹189 (BigBasket) | ~3% |
| Veeba Classic Mayonnaise 250g | ₹110 | ₹102 | ₹102 | ₹102 (BigBasket) | ~8% |
| Wingreens Farms Tandoori Mayo 180g | ₹85 | ₹75 | ₹80 | ₹70 (BigBasket) | ~21% |
| Dr. Oetker FunFoods Mayo 245g | ₹100 | ₹93 | ₹95 | ₹93 (BigBasket) | ~7% |
| Ching’s Red Chilli Sauce 200g | ₹65 | ₹60 | ₹63 | ₹60‑₹63 (Retail) | ~8% |
Explanation: Blinkit consistently shows higher price surges during peak demand periods compared to other platforms, reflecting dynamic pricing in action.
Table 2: SKU & Brand Distribution Across Tier-1 Cities
| Brand | Product ID | Product Type | Delhi NCR | Mumbai | Bengaluru | Chennai | Hyderabad |
|---|---|---|---|---|---|---|---|
| Heinz | HNZ001 | Mayonnaise 250g | In Stock | In Stock | Low Stock | In Stock | In Stock |
| Kissan | KSN002 | Tomato Sauce 500g | In Stock | Low Stock | In Stock | In Stock | In Stock |
| Veeba | VEE003 | Garlic Dip 200g | Low Stock | In Stock | In Stock | In Stock | Low Stock |
| FunFoods | FF004 | Dressing 250ml | In Stock | In Stock | Low Stock | In Stock | In Stock |
| Del Monte | DM005 | Marinade 300g | Low Stock | In Stock | In Stock | Low Stock | In Stock |
Explanation: This table shows regional variations in stock and demand for top brands, helping the client plan city-wise inventory and promotions.
Table 3: Discount Frequency & Range
| Product Name | Platform | Discount Frequency | Discount Range (%) |
|---|---|---|---|
| Classic Mayo 250g | Blinkit | 5 times/month | 5-12% |
| Kissan Tomato Sauce 500g | Zepto | 3 times/month | 3-10% |
| Veeba Garlic Dip 200g | Instamart | 4 times/month | 4-8% |
| FunFoods Dressing 250ml | Amazon | 2 times/month | 5-7% |
| Del Monte Marinade 300g | Flipkart | 3 times/month | 4-9% |
Explanation: Monitoring discount frequency and range enables the client to anticipate promotions, adjust pricing, and align marketing campaigns effectively.
Methodologies Used
- Automated Data Collection
We implemented an automated system to continuously gather product pricing, stock, and promotional information across multiple platforms. This approach ensured real-time data capture, reduced manual effort, and provided consistent, reliable datasets for analytics and decision-making. - Data Cleaning and Structuring
Collected data was validated, cleaned, and standardized to remove inconsistencies and ensure uniformity. Structured datasets enabled seamless integration into analytical tools, supporting accurate reporting, trend analysis, and actionable insights for strategic planning. - Centralized Data Repository
A unified repository was established to store historical and real-time data. This methodology allowed the client to access all information in one place, enabling comparative analysis, monitoring of trends, and efficient data retrieval for reporting purposes. - Predictive Analytics
Predictive models were applied to historical and real-time data to forecast demand spikes, stock shortages, and price fluctuations. These insights empowered proactive planning, optimized inventory management, and informed dynamic pricing strategies across regions. - Continuous Monitoring and Alerts
Real-time monitoring systems were deployed to detect anomalies, price changes, and stock variations. Automated alerts ensured rapid response, minimized revenue loss, and enhanced operational efficiency and competitive advantage.
Advantages of Collecting Data Using Food Data Scrape
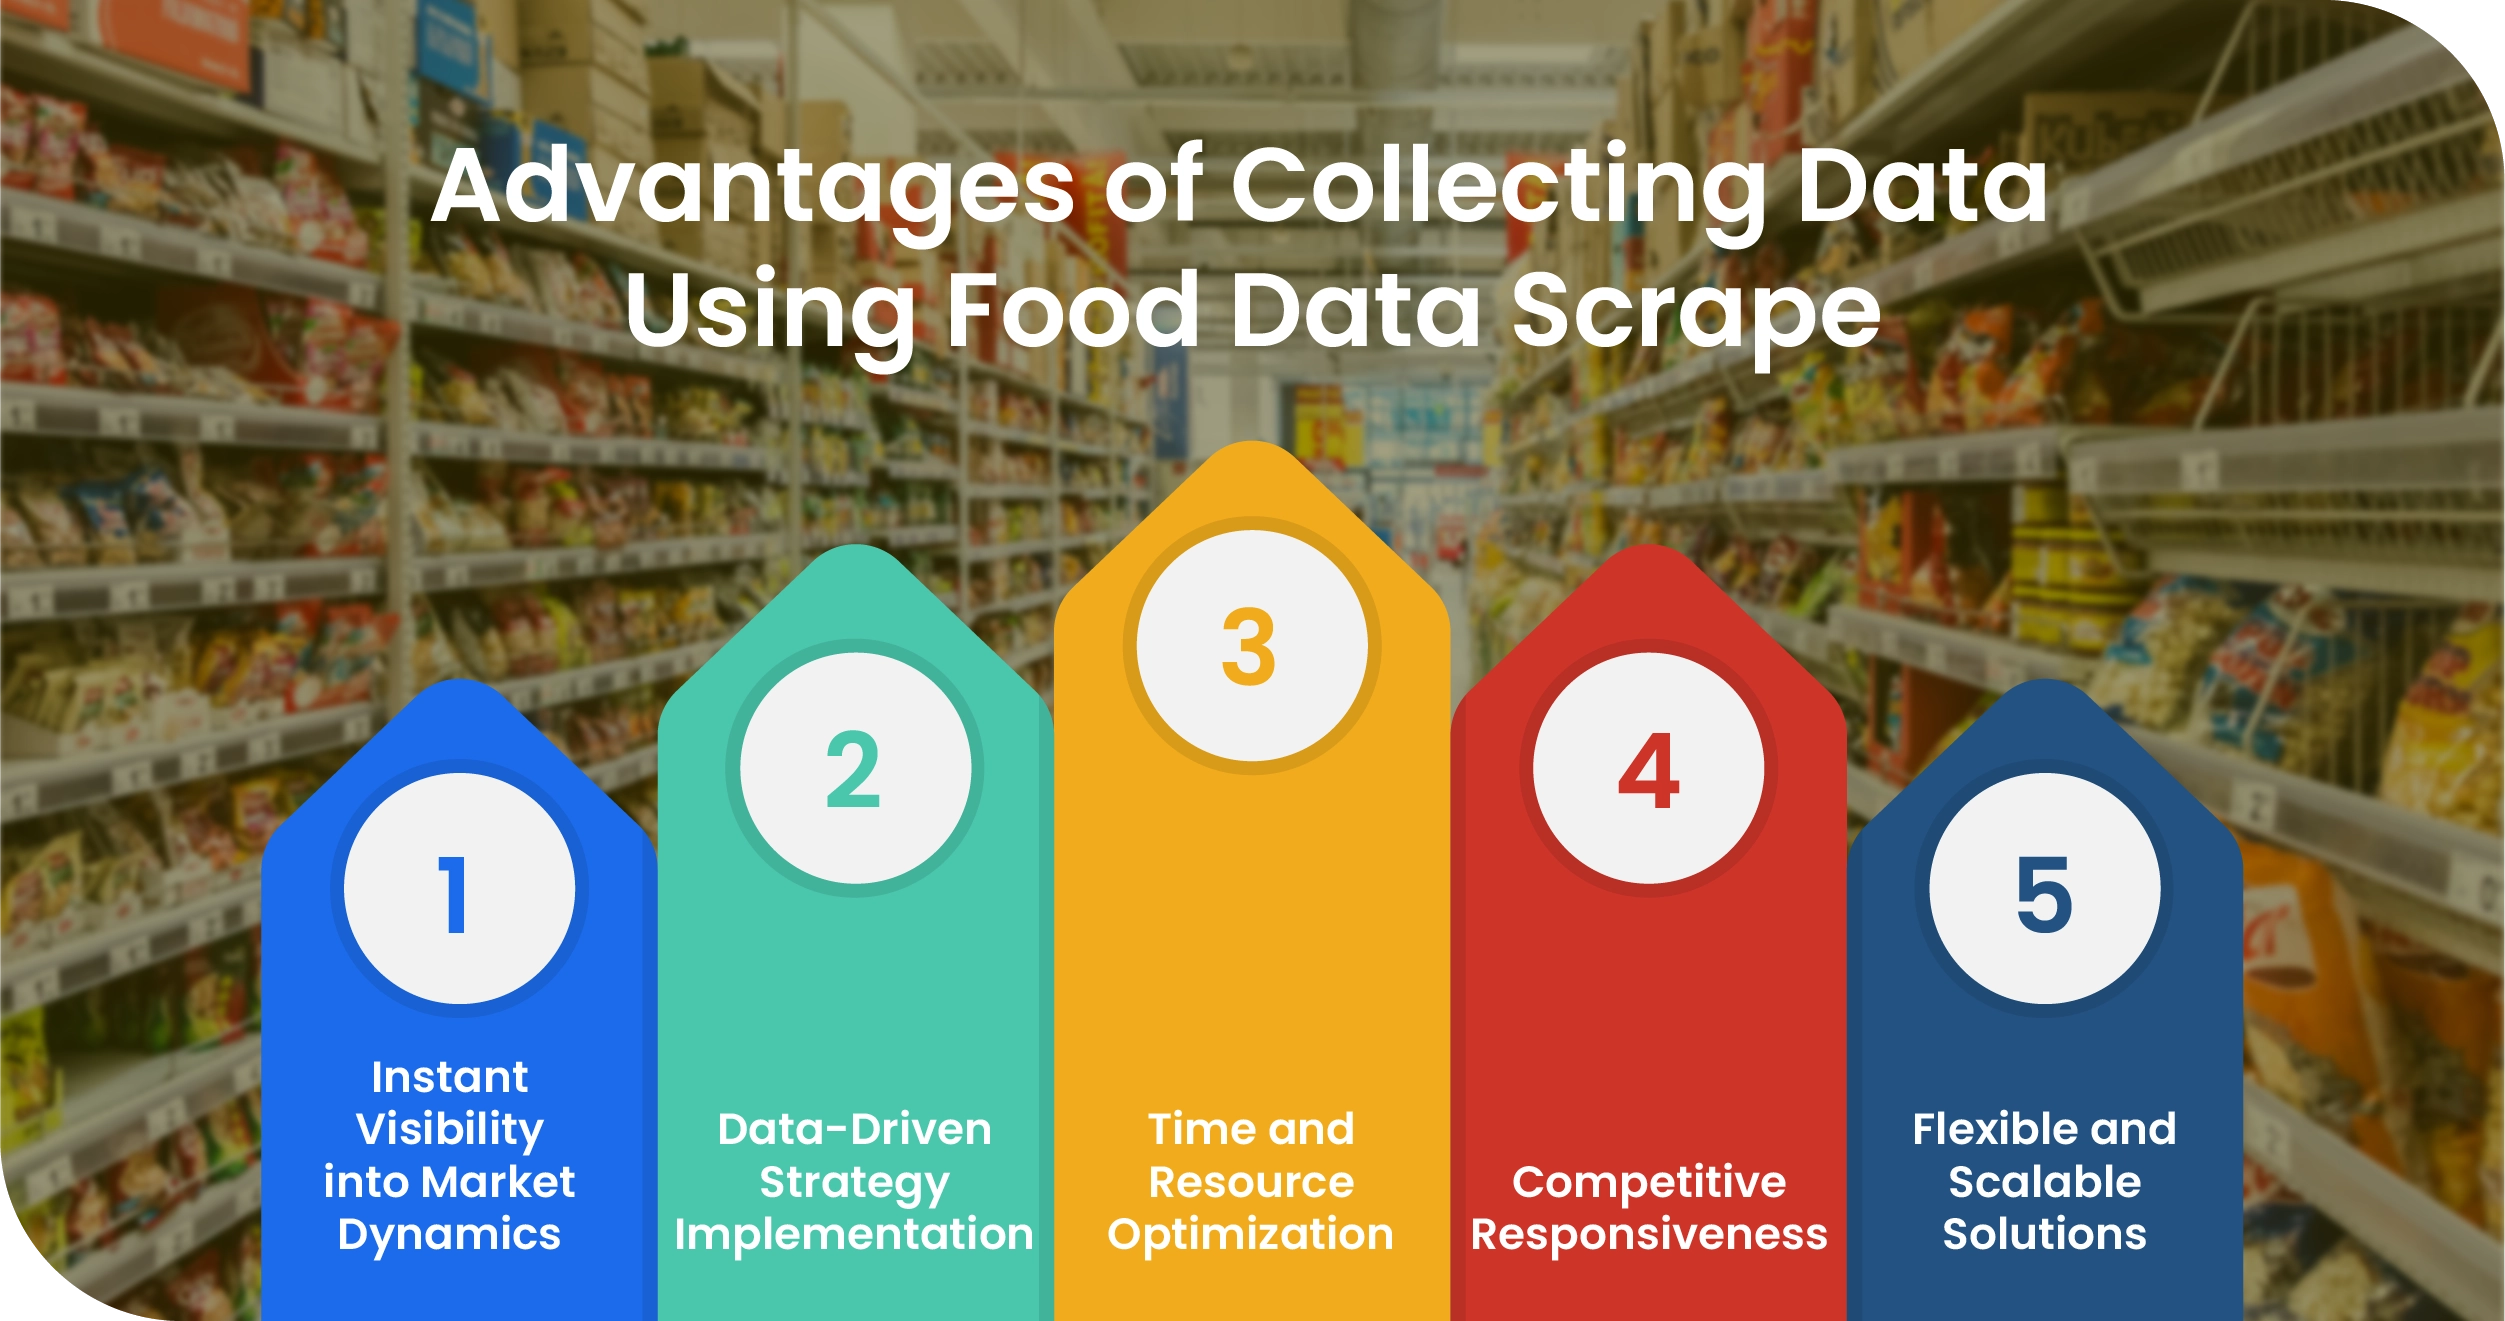
- Instant Visibility into Market Dynamics
Clients gain immediate insights into price movements, stock changes, and promotional campaigns across platforms. This visibility allows them to act quickly, anticipate trends, and maintain a strong presence in competitive, fast-moving markets. - Data-Driven Strategy Implementation
With organized, accurate datasets, clients can make informed decisions on pricing, inventory allocation, and product launches. This empowers businesses to develop strategies backed by concrete data rather than assumptions, enhancing profitability and operational efficiency. - Time and Resource Optimization
Automating data collection reduces manual monitoring and errors, allowing teams to focus on analysis and execution. This boosts efficiency, lowers operational costs, and ensures consistent access to reliable information. - Competitive Responsiveness
Real-time insights enable clients to swiftly react to competitor actions, price fluctuations, and stock shortages. Quick adjustments help maintain customer satisfaction, maximize revenue, and strengthen market positioning. - Flexible and Scalable Solutions
The system can handle multiple product categories, regions, and platforms. Clients can easily expand operations, integrate new data sources, and scale analysis without compromising speed or accuracy.
Client’s Testimonial
"Partnering with this team has transformed our approach to pricing and inventory management. Their solutions provided us with accurate, real-time insights into product demand, stock levels, and competitor strategies across multiple platforms. The structured datasets and automated monitoring empowered our team to make informed, data-driven decisions quickly. Their professionalism, technical expertise, and responsiveness ensured a seamless experience from implementation to execution. As a result, we optimized pricing strategies, reduced stockouts, and enhanced overall operational efficiency. Their services have been instrumental in driving our business growth and maintaining a competitive edge in a dynamic market."
Head of Operations
Final Outcome
The project delivered significant results, empowering the client with actionable insights into pricing, stock levels, and demand trends across multiple grocery platforms. With the implementation of a Grocery Price Tracking Dashboard, the client gained real-time visibility into competitor pricing and surge patterns, enabling proactive decision-making. Leveraging Grocery Pricing Data Intelligence, the team optimized pricing strategies, identified top-selling SKUs, and improved inventory management, particularly during high-demand periods such as festivals and weekends. Structured Grocery Store Datasets allowed seamless integration into analytics systems, supporting trend analysis and reporting. Overall, the client enhanced operational efficiency, minimized stockouts, maximized revenue opportunities, and strengthened market competitiveness, achieving data-driven business strategies that aligned with evolving consumer behavior and platform dynamics.

