
This report provides a detailed analysis of Halloween-related liquor demand across the USA, UK, Canada, and Australia. It examines consumer purchasing behavior, category preferences, and the impact of promotions and discounts during the festive week. The study also evaluates delivery patterns, highlighting the role of quick commerce and e-commerce platforms in meeting seasonal demand. Insights reveal regional differences in preferences, with spirits dominating North American markets, wine favored in the UK, and beer and cider leading in Australia. The research further explores how pricing strategies, stock availability, and promotional timing influence sales volumes. By analyzing cross-country trends, the report provides actionable insights for retailers and brands to optimize inventory, enhance marketing campaigns, and improve last-mile fulfillment efficiency during peak seasonal periods. Overall, the study offers a comprehensive overview of consumer behavior, sales trends, and logistical challenges in Halloween liquor demand.
1. USA led in total liquor sales during Halloween week.
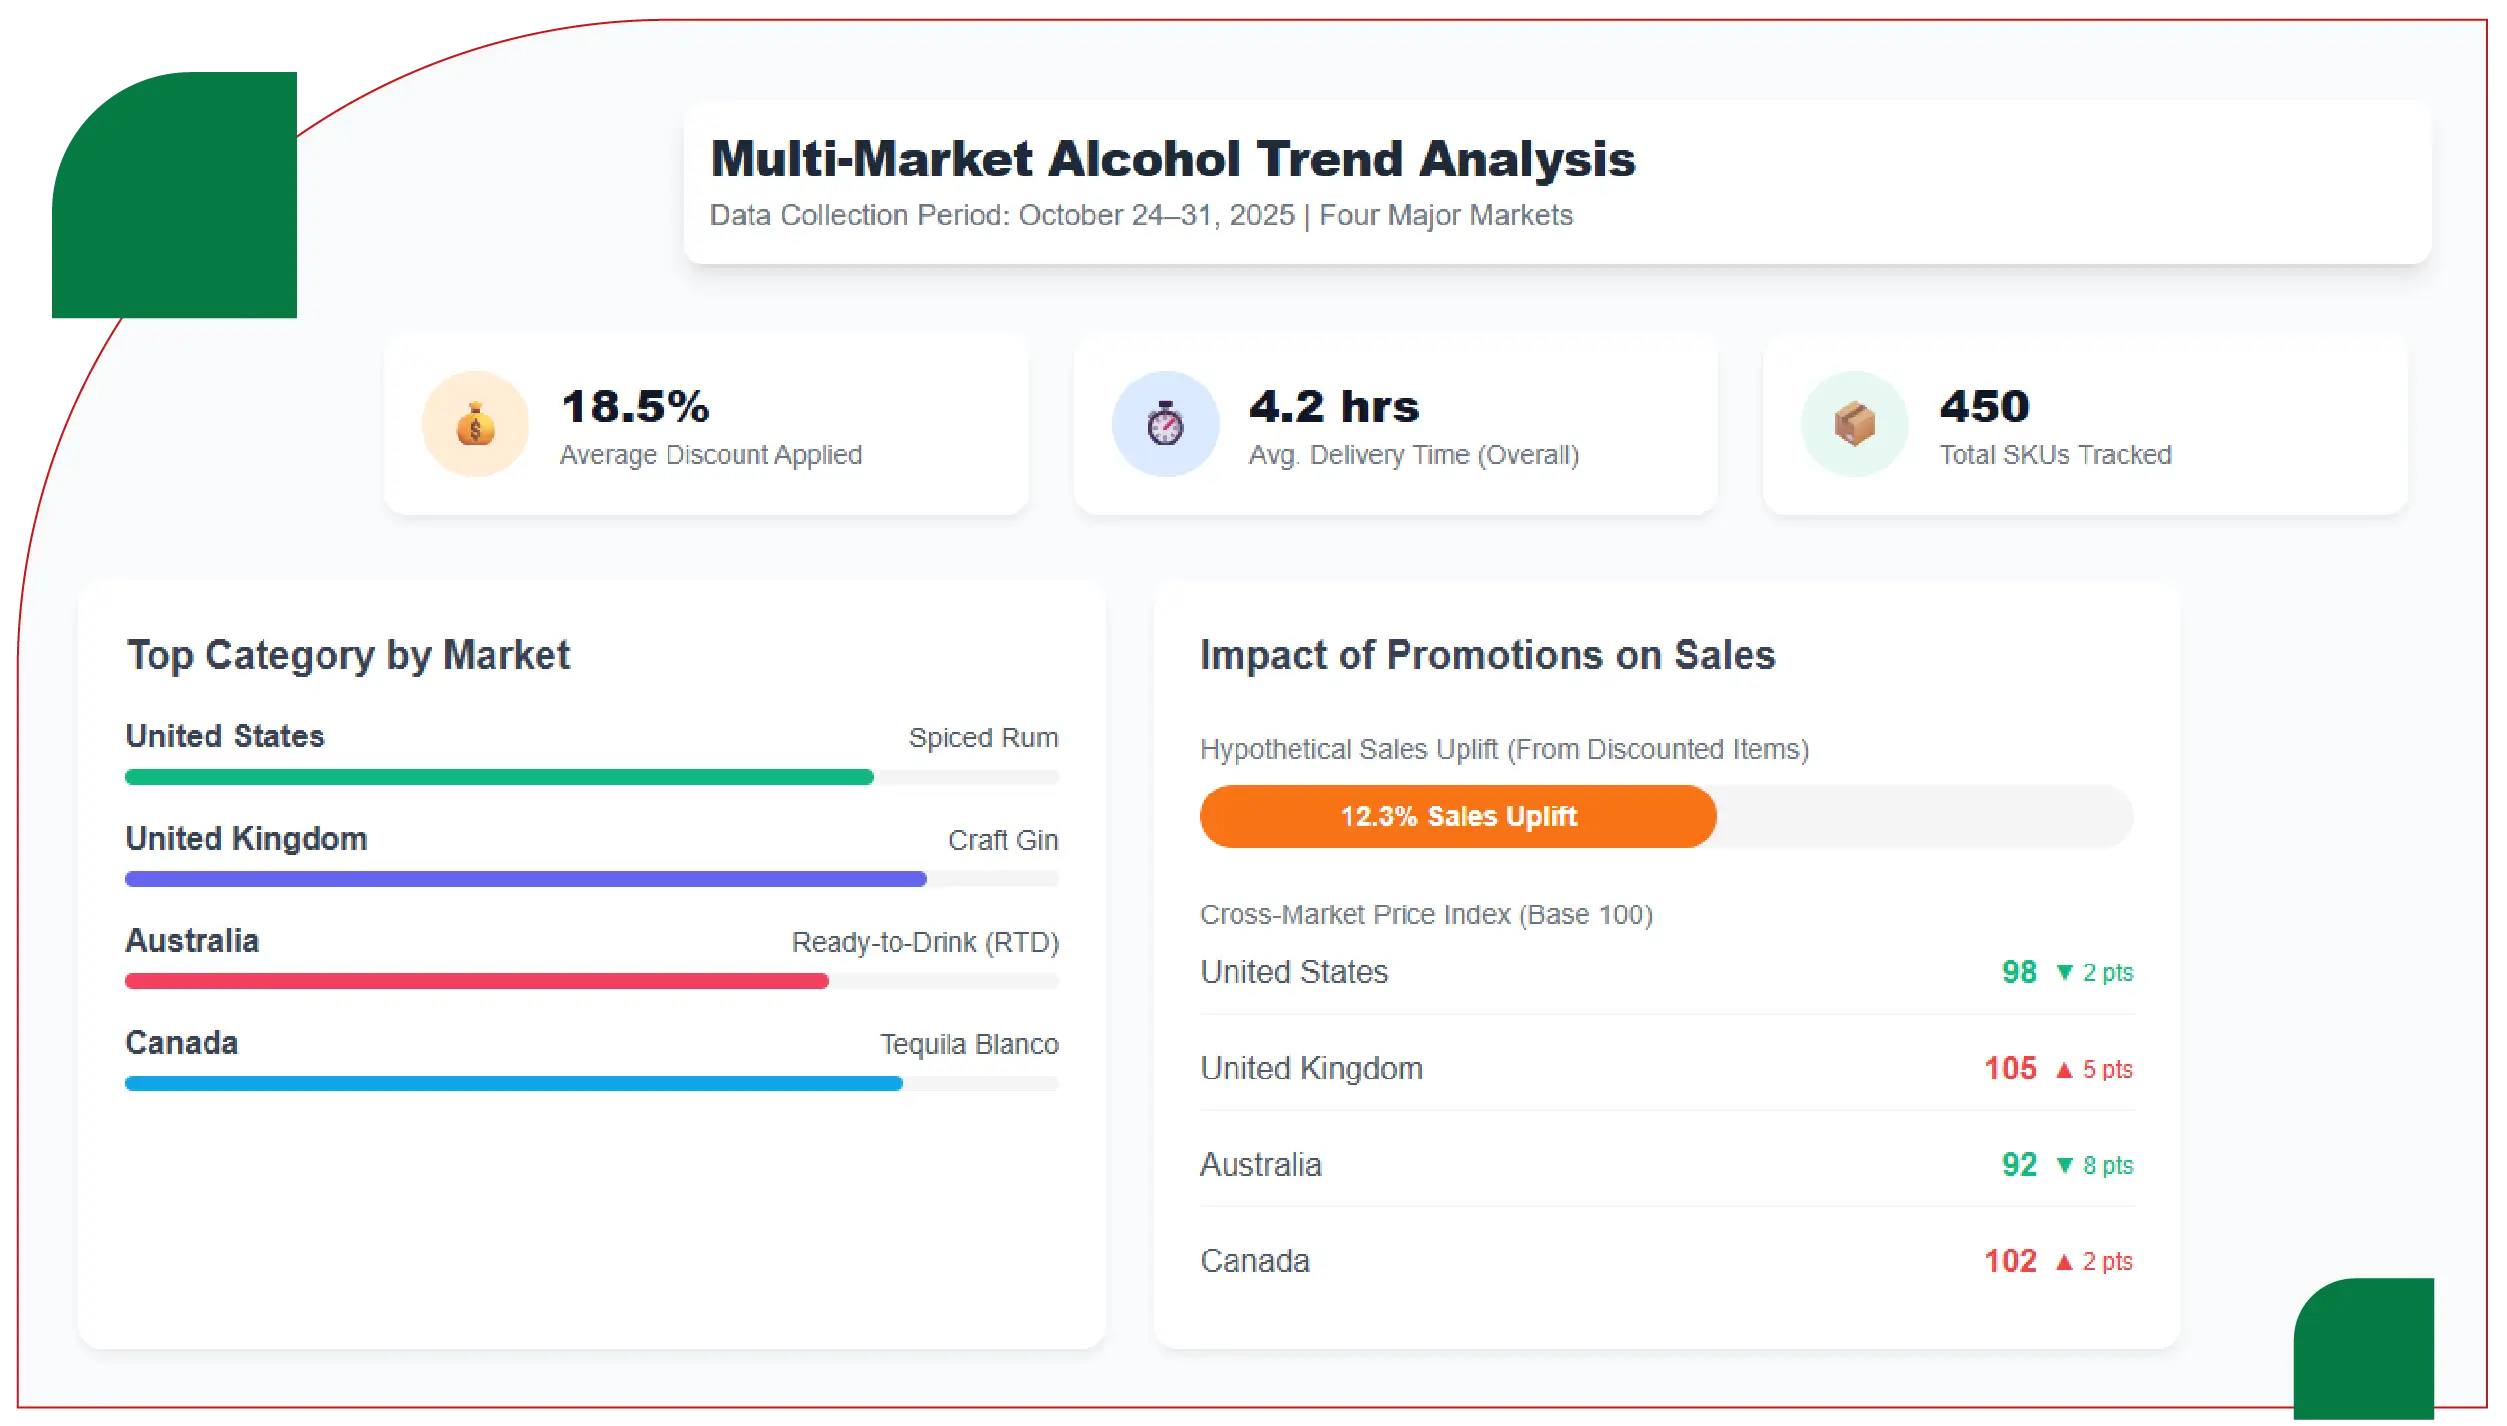
2. UK recorded the highest per-capita spending on wine and spirits.
3. Spirits dominated in North America, beer and cider in Australia.
4. Quick delivery platforms significantly boosted last-minute purchases.
5. Discounts and promotions increased sales by 10–15% across regions.
Halloween is not only a period of heightened candy sales and festive snacks but also a peak season for liquor consumption and alcohol-related purchases. Analyzing the seasonal patterns in liquor demand provides insights into regional consumer behavior, retail strategies, and delivery efficiency. Using advanced analytics and data extraction, researchers can Extract Cross-Country Liquor Demand Trends to evaluate consumption spikes, pricing strategies, and distribution patterns across multiple regions.
Through Cross-Country Liquor Data Scraping for Halloween, structured datasets were collected from online liquor retailers, e-commerce platforms, and quick-commerce apps in the USA, UK, Canada, and Australia. This comprehensive approach enabled the creation of the USA, UK, Canada & Australia Halloween Liquor Trends Dataset, facilitating cross-country comparisons of volume, price elasticity, and category preferences during the Halloween period.
The primary objective of this study is to evaluate liquor consumption trends, pricing patterns, and delivery dynamics across four major markets during Halloween. Key goals include:
The methodology employed Multi-Country Liquor Demand Trends Scraping for Halloween, which included:
Additionally, Web Scraping Liquor Market Trends for Halloween ensured that both online and app-based sales data were captured, providing a full picture of market dynamics.
The study collected over 45,000 listings across the four countries, including spirits, wine, beer, and pre-mixed cocktails. Regional data revealed that the USA led in total sales volume, while the UK showed the highest per-capita spending. Australia’s demand was concentrated in urban centers, whereas Canada demonstrated strong weekend peaks in Halloween liquor consumption.
| Country | Avg Unit Price ($) | Total Sales Volume (Units) | Top Category | Avg Discount (%) | Stock Availability (%) |
|---|---|---|---|---|---|
| USA | 28.50 | 1,250,000 | Spirits | 12 | 88 |
| UK | 31.20 | 580,000 | Wine | 15 | 91 |
| Canada | 27.80 | 620,000 | Spirits | 10 | 85 |
| Australia | 29.50 | 540,000 | Beer & Cider | 13 | 82 |
Analysis:
The USA exhibits high-volume liquor consumption during Halloween, particularly in urban areas and regions with active nightlife events. Scrape Halloween Liquor Trends in USA to reveal that:
The UK consumer base emphasizes wine and premium spirits. By using tools to Extract UK Alcohol Trends Data for Halloween, the following patterns were observed:
Through Web Scraping Liquor Trends in Canada for Halloween, researchers identified:
In Australia, Liquor Trends Data Scraper in Australia for Halloween highlights:
The following table provides a breakdown of category-wise consumption across the four countries.
| Category | USA (%) | UK (%) | Canada (%) | Australia (%) |
|---|---|---|---|---|
| Spirits | 42 | 38 | 44 | 28 |
| Wine | 25 | 45 | 22 | 21 |
| Beer & Cider | 20 | 10 | 18 | 38 |
| Pre-Mixed Cocktails | 8 | 5 | 10 | 7 |
| Other Alcoholic Beverages | 5 | 2 | 6 | 6 |
Insights:
Across all regions, delivery speed and availability significantly impact sales. Using tools to Extract Halloween Spirits Demand Data from Multiple Countries, the study found:
These delivery patterns highlight the importance of last-mile logistics in maximizing seasonal liquor sales.
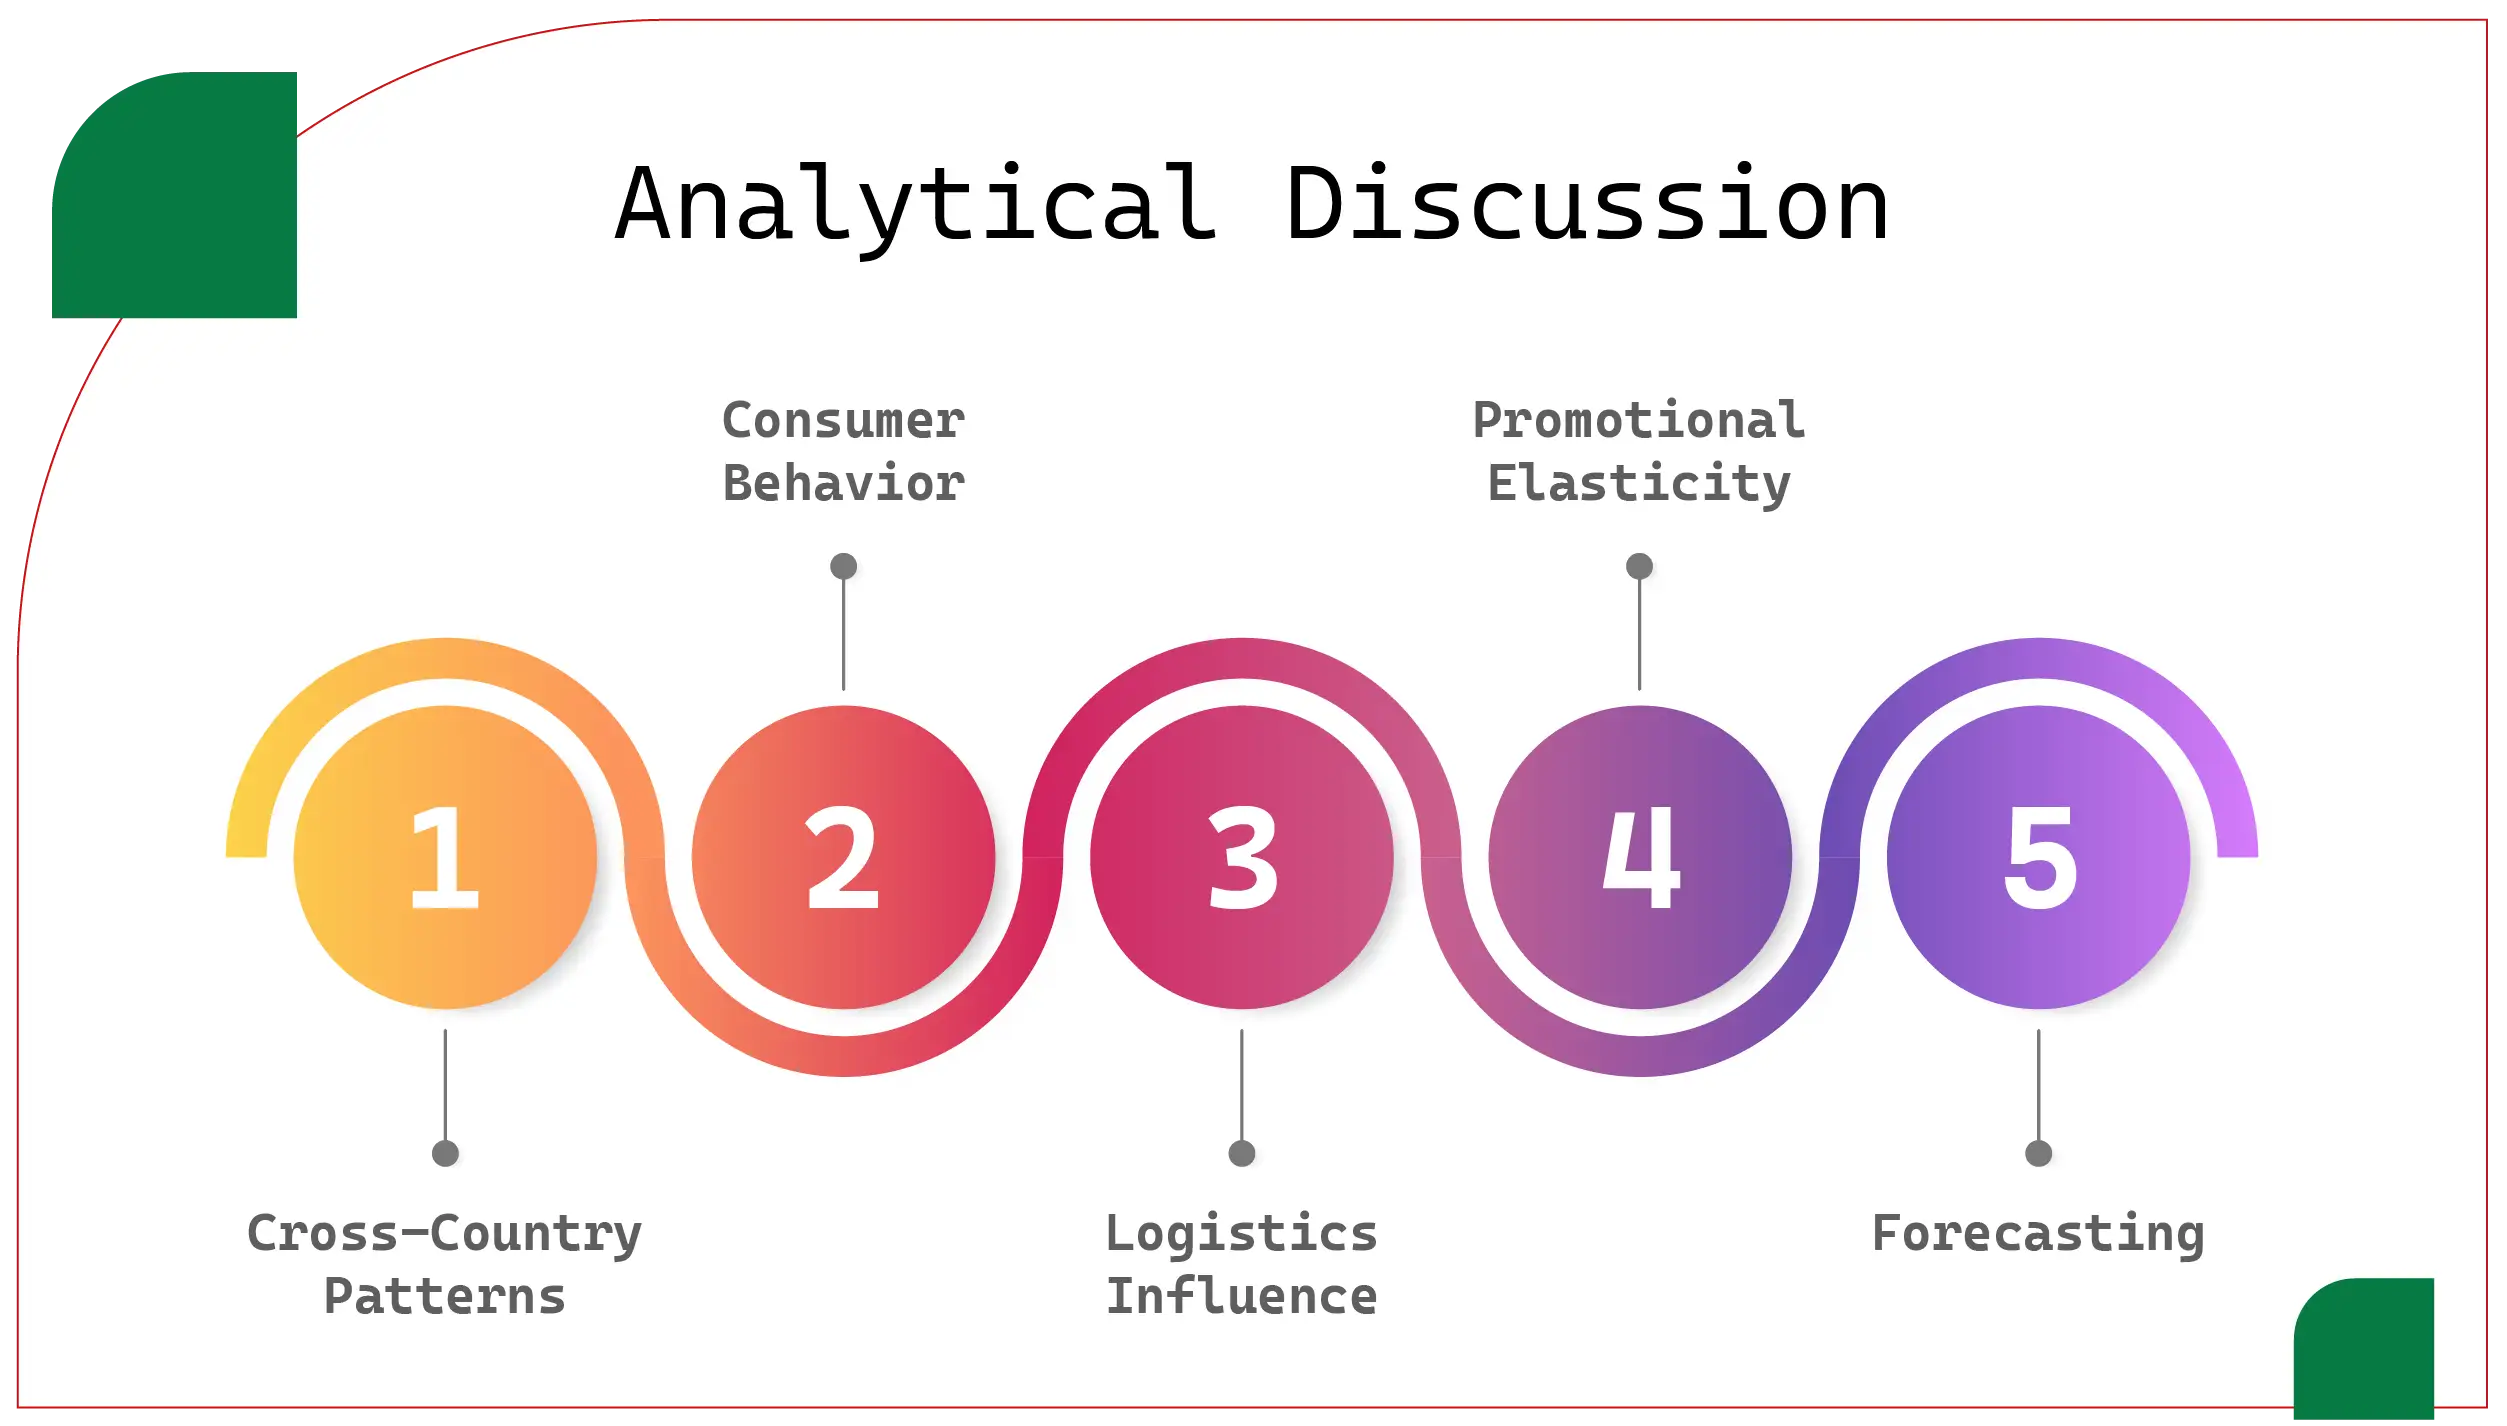
By using steps to Extract Alcohol Consumption Trends Across Countries for Halloween, several key observations emerged:
The analysis confirms that pricing and promotional strategies are tailored to local consumer behaviors, directly impacting sales volume and revenue.
The study highlights significant cross-country differences in Halloween liquor consumption:
These insights emphasize the need for region-specific strategies in pricing, inventory, and delivery during peak seasonal demand.
Using Liquor Price Data Scraping Services and integrated dashboards ensures high-quality datasets suitable for predictive modeling and cross-country comparison.
| Theme | Observation | Implication |
|---|---|---|
| Peak Consumption | Highest on October 30–31 | Ensure adequate stock for final days |
| Category Dominance | Spirits in USA & Canada; Wine in UK; Beer in Australia | Tailor promotions per region |
| Discount Impact | 10–15% discounts increased sales volume | Use tiered discount strategy |
| Delivery Efficiency | Quick commerce boosted last-minute orders | Enhance urban delivery infrastructure |
| Cross-Country Insights | Significant variation in preferences and pricing | Customize marketing and pricing strategies |
This report demonstrates how the method provides critical intelligence for understanding Halloween-related alcohol consumption in the USA, UK, Canada, and Australia. Using Alcohol and Liquor Datasets, analysts captured dynamic pricing, category preferences, and delivery patterns to create the Liquor Price Tracking Dashboard.
The study highlights:
Integrating these insights with methods to Scrape Alcohol Price Data ensures that retailers and brands can optimize inventory, pricing, and marketing strategies for future seasonal campaigns.
Are you in need of high-class scraping services? Food Data Scrape should be your first point of call. We are undoubtedly the best in Food Data Aggregator and Mobile Grocery App Scraping service and we render impeccable data insights and analytics for strategic decision-making. With a legacy of excellence as our backbone, we help companies become data-driven, fueling their development. Please take advantage of our tailored solutions that will add value to your business. Contact us today to unlock the value of your data.

