
This report analyzes the geographical distribution of Kroger's 2,757 grocery stores across 35 U.S. states as of June 2025 based on publicly available retail location datasets. It examines store counts by state, city, and key banners, such as Kroger, Harris Teeter, and Ralphs, providing insights into market penetration and regional strategies. Two tables highlight store distribution across top states and banner diversity, supported by an analysis of population per store and competitive dynamics. The report identifies Kroger's strong presence in Ohio, California, and Texas, alongside opportunities for expansion in high-growth and untapped markets. Key observations emphasize Kroger's tailored banner approach and competitive positioning, offering strategic recommendations for growth in a dynamic retail landscape.
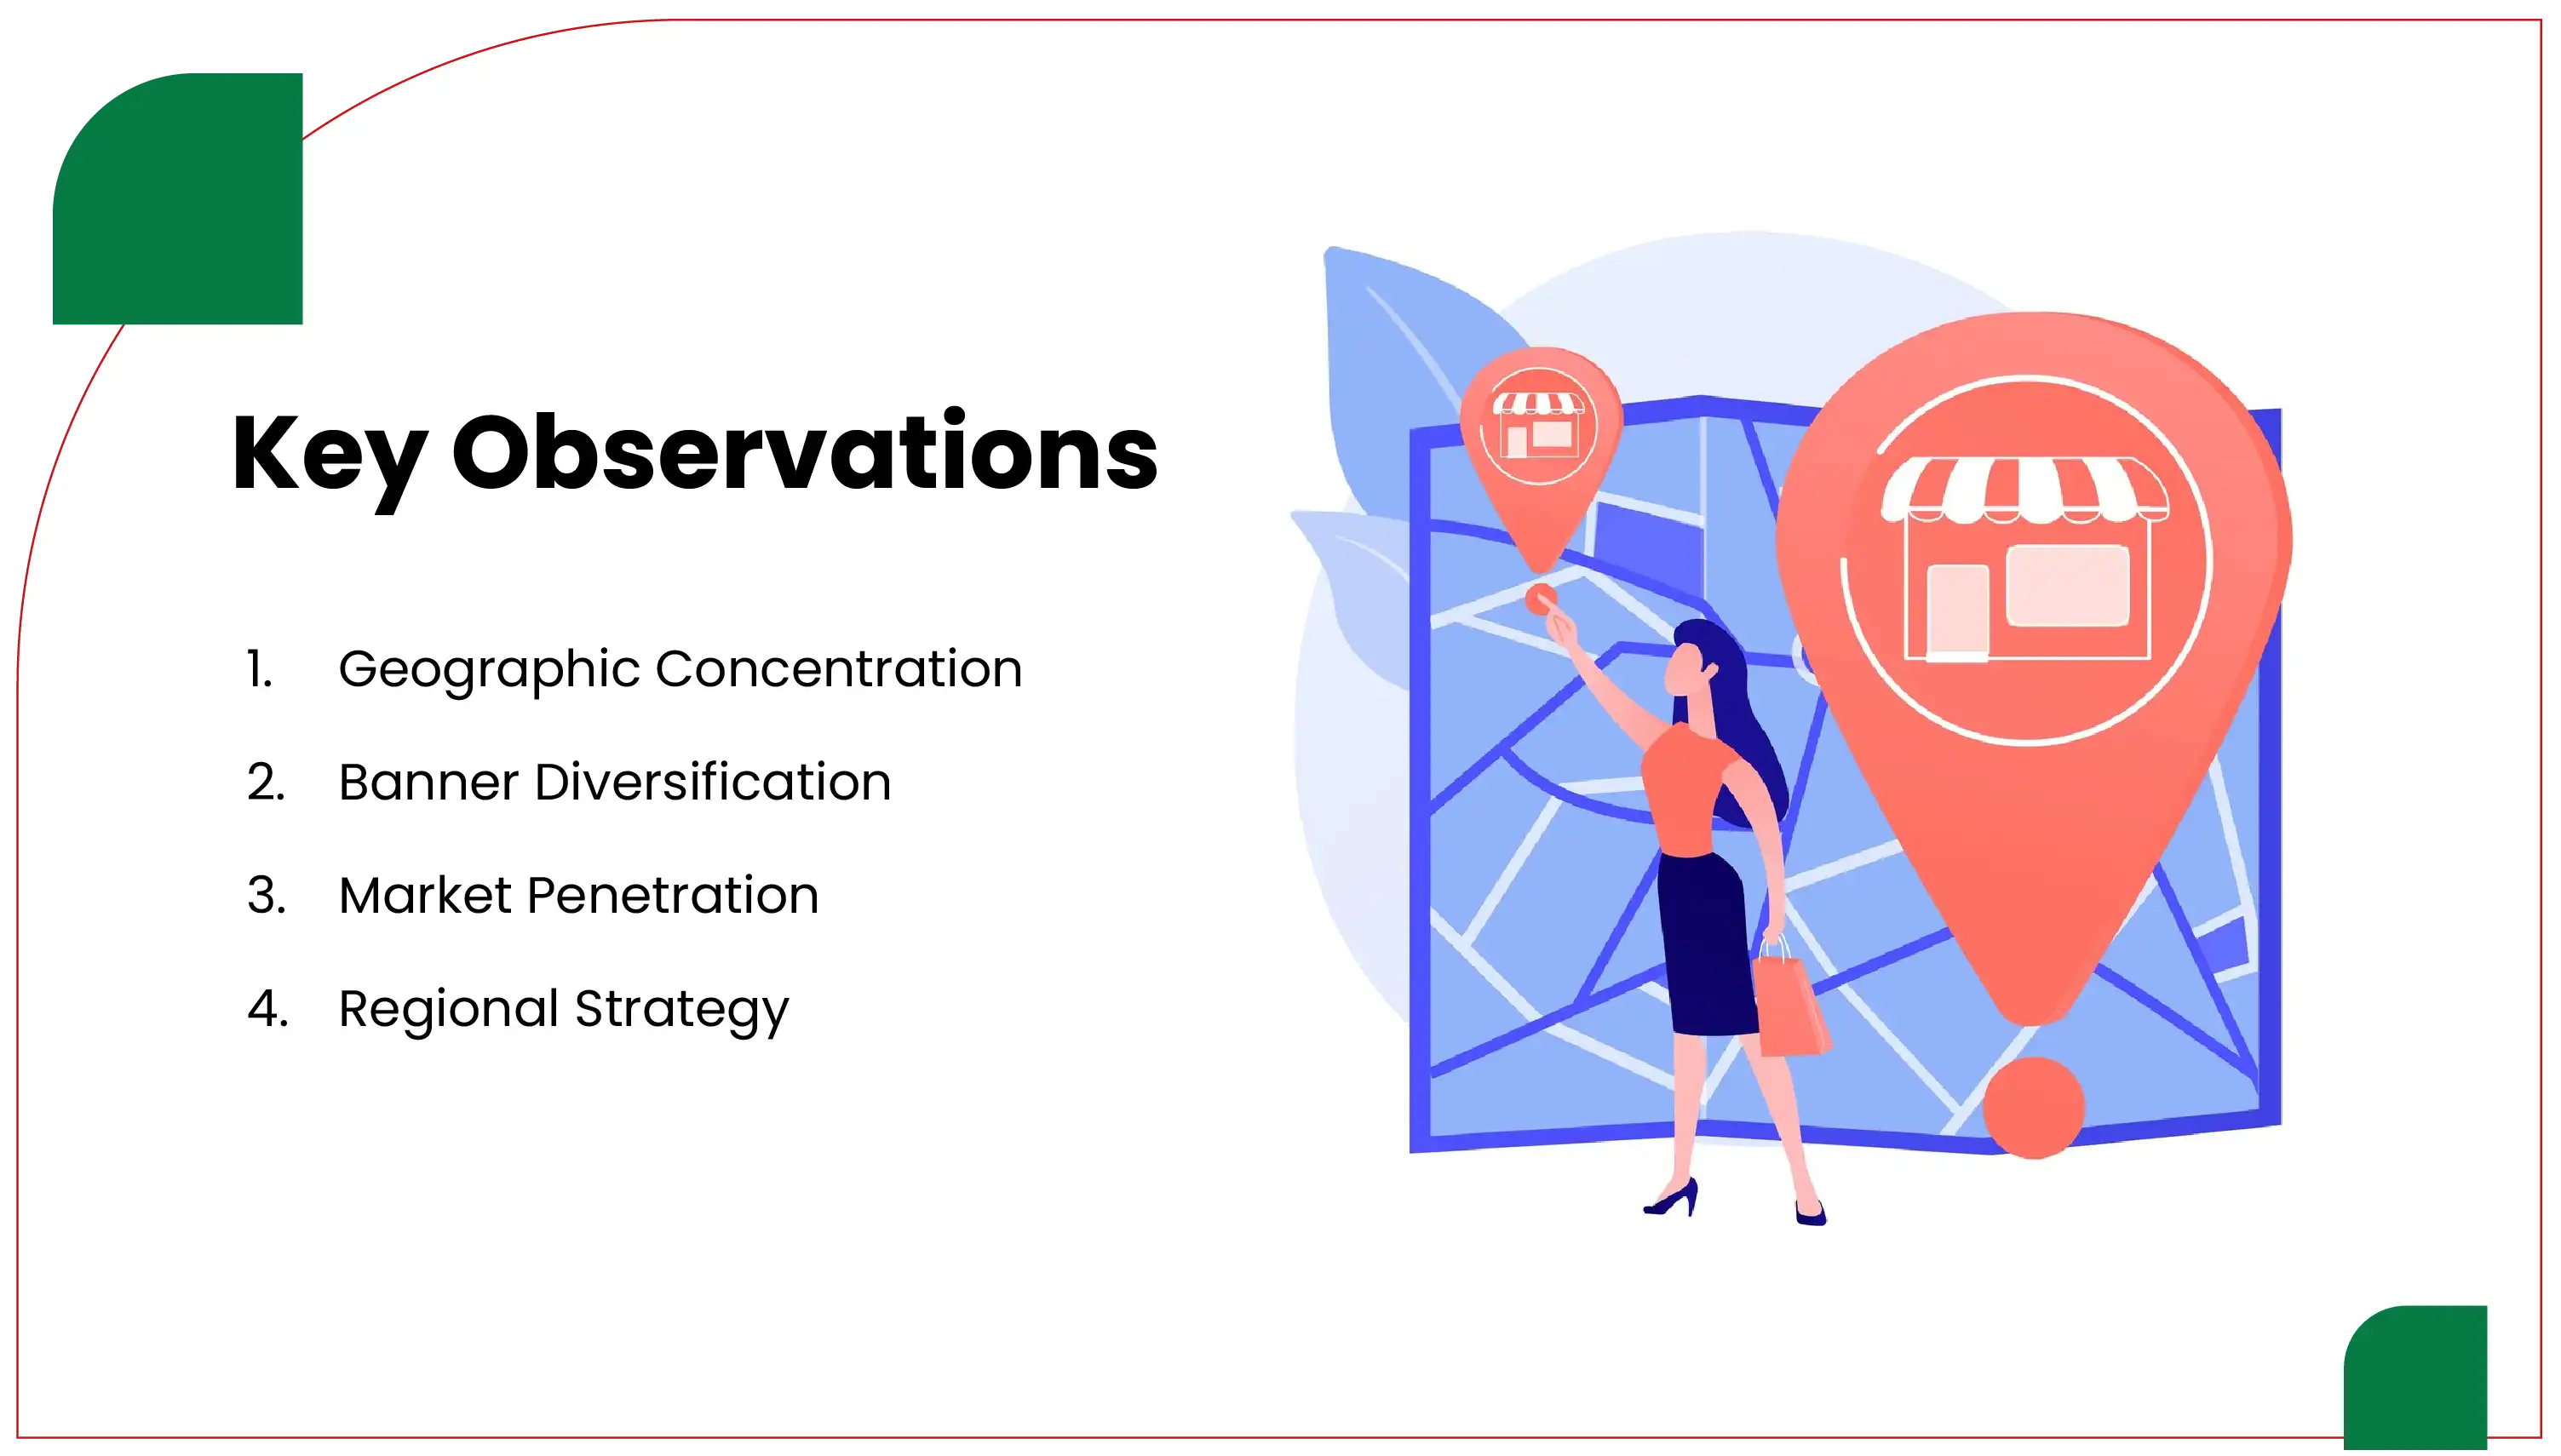
1. Geographic Reach: Kroger operates 2,757 stores in 35 states, with California (299 stores), Texas (209), and Ohio (204) leading the pack.
2. Market Density: Ohio and Kentucky show the highest store density, with 57,843 and 47,368 people per store, respectively.
3. Banner Diversity: The Kroger banner accounts for 48.7% of stores, while Harris Teeter and Ralphs target upscale and regional markets.
4. Growth Potential: High population-per-store ratios in California (131,103) and Texas (138,737) indicate room for expansion amid competition.
5. Regional Strategy: Banners like Fred Meyer and Smith's Food & Drug align with regional preferences in the Northwest and Southwest.
The Kroger Company is one of the largest supermarket chains in the United States. It was founded by Bernard Kroger in Cincinnati, Ohio, in 1883, and most Kroger stores have that name. In addition to Kroger, the company operates Ralphs, Harris Teeter, and Fred Meyer and, as of June 2025, approximately 2,757 stores in 35 states. Kroger holds a distinct position in the U.S. retail grocery market.
Studying the geographic pattern and characteristics of Kroger's statewide and regional store locations is valuable for market analysis and competitor comparisons in future seasons. This report will Extract Kroger Grocery Store Locations Data to clarify the regional patterns in Kroger's store penetration and to uncover ruling patterns of indeterminate presence. By leveraging advanced data scraping tools and spatial analysis techniques, we also Extract Kroger Store Addresses and Geolocation Data to evaluate market density and logistical reach. This approach enables a clearer understanding of where Kroger holds market strength and where expansion opportunities may lie.
The analysis includes two tables summarizing store counts and banner distribution, key observations, and an in-depth examination of the data's implications for Kroger's market strategy. All insights are derived from the Kroger Store Locations Dataset, offering a reliable foundation for strategic business planning and competitive intelligence.
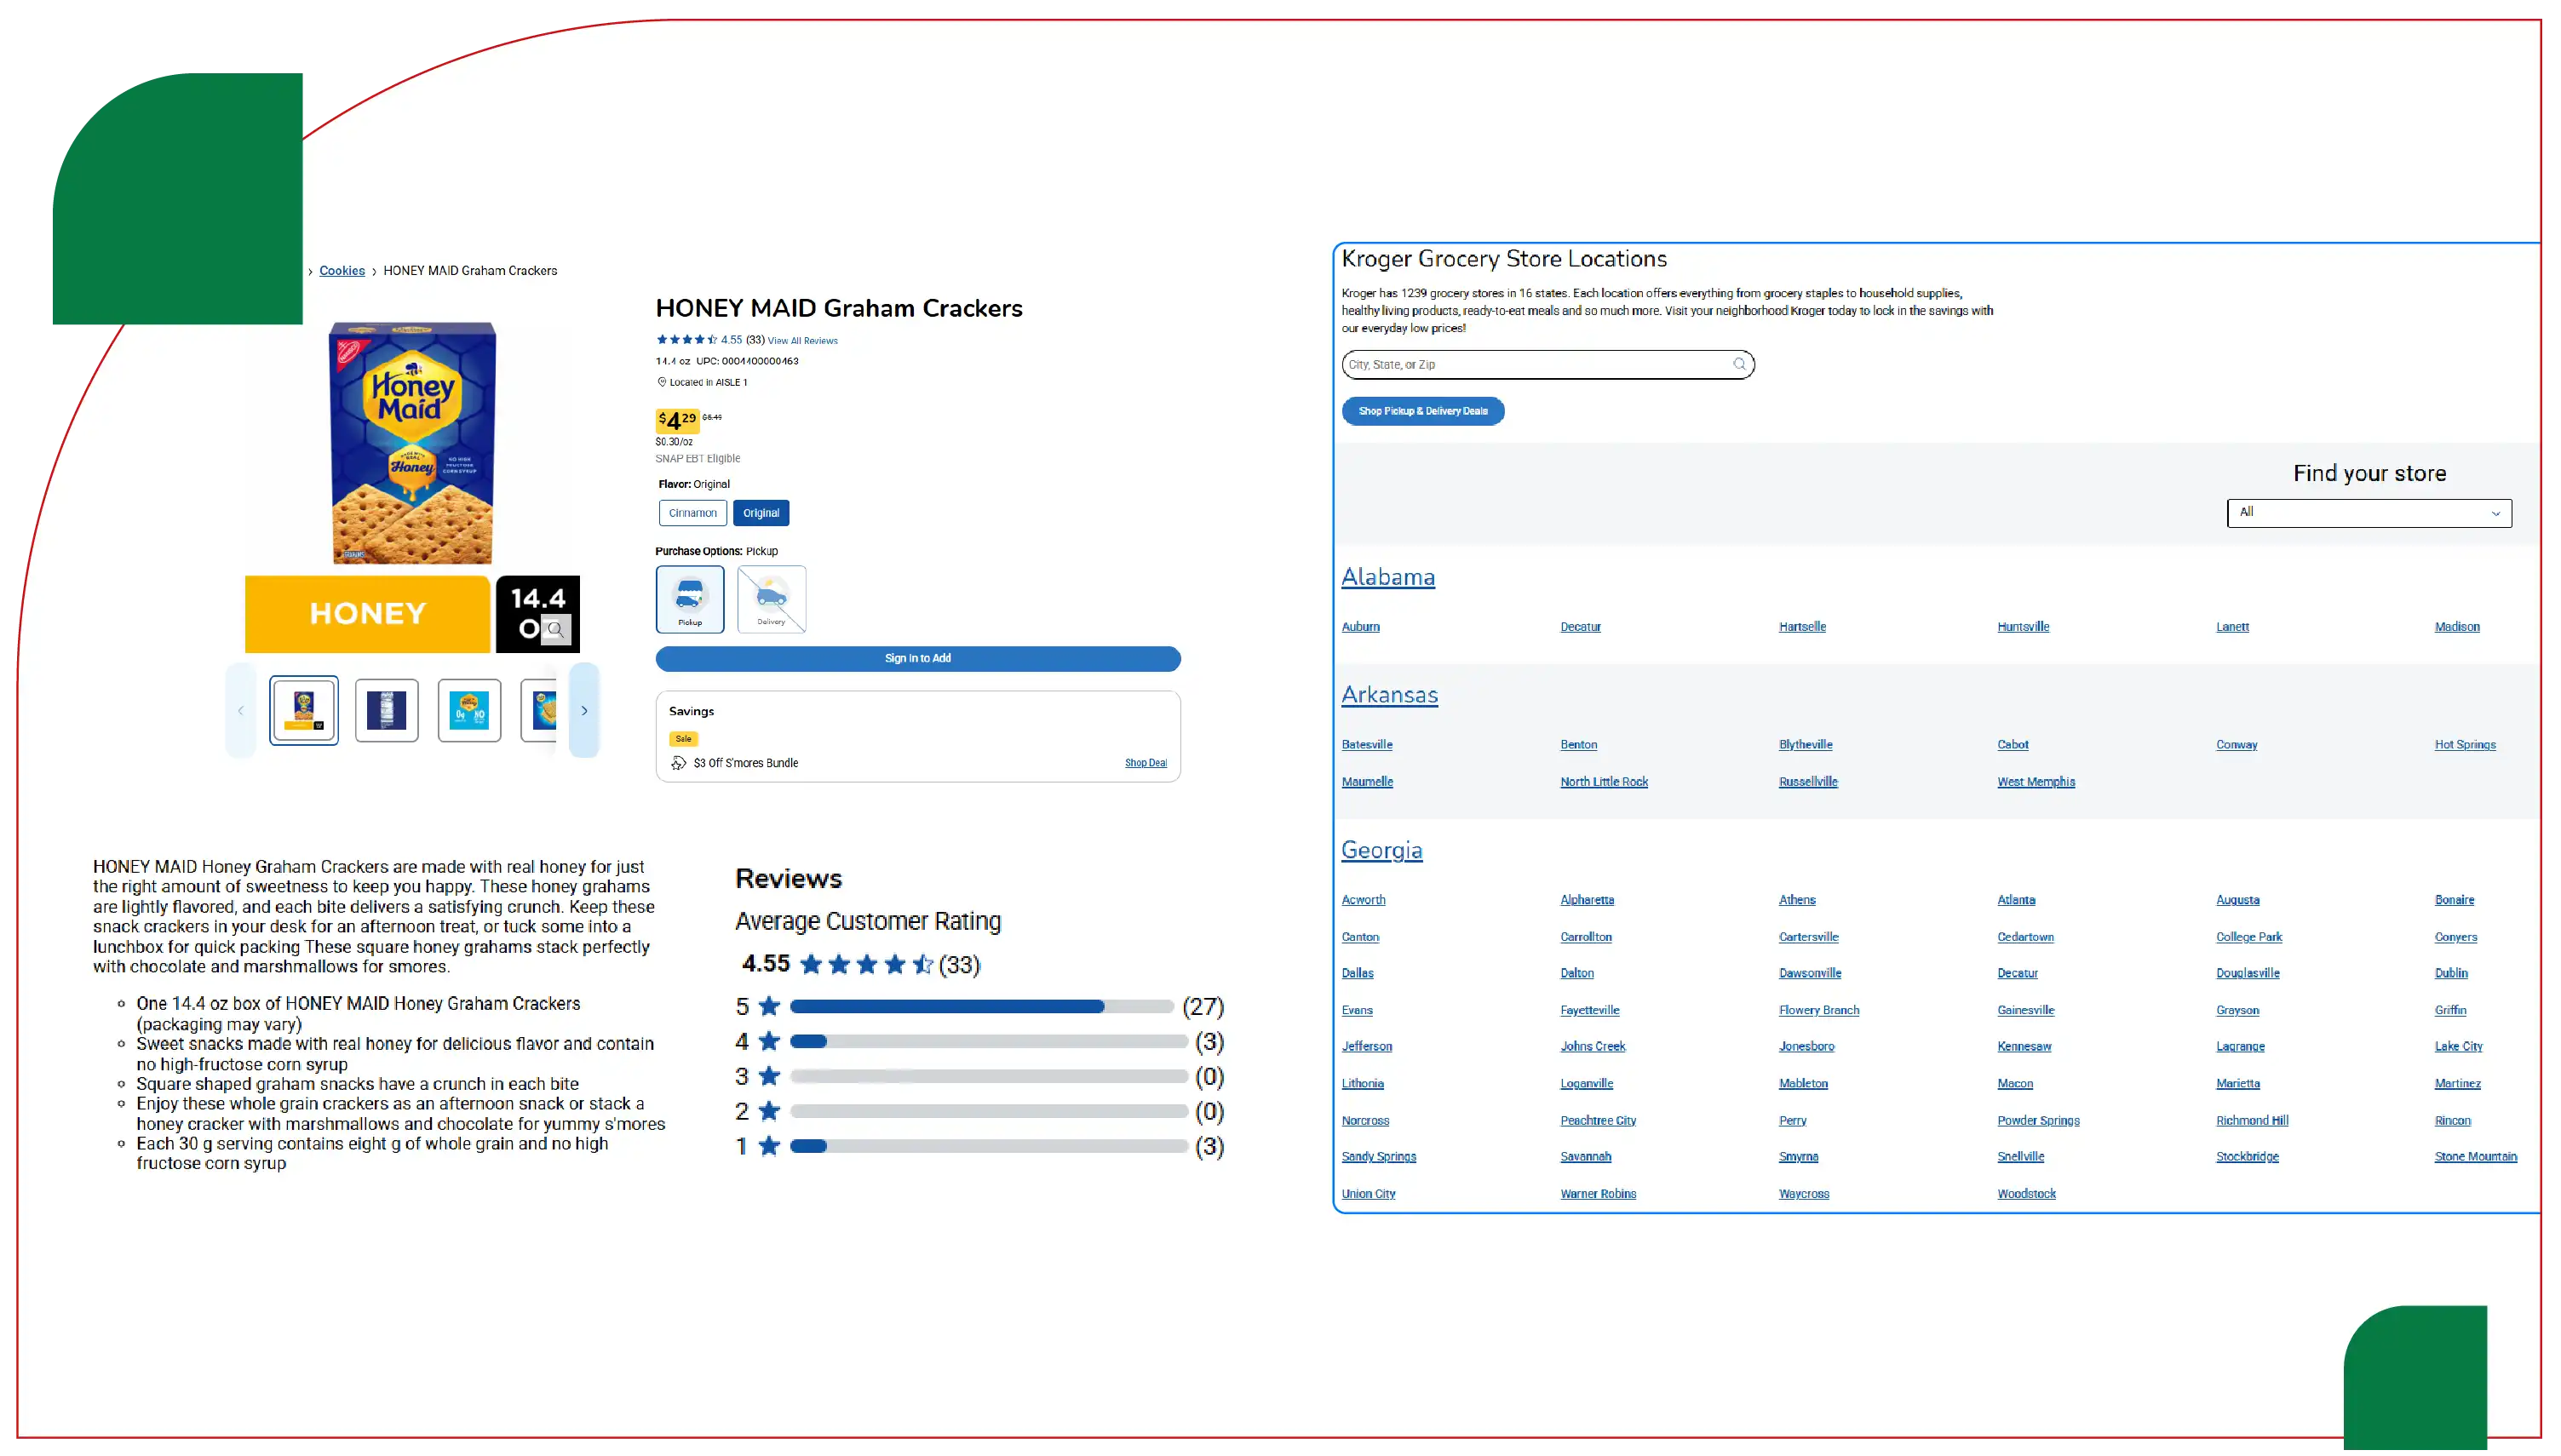
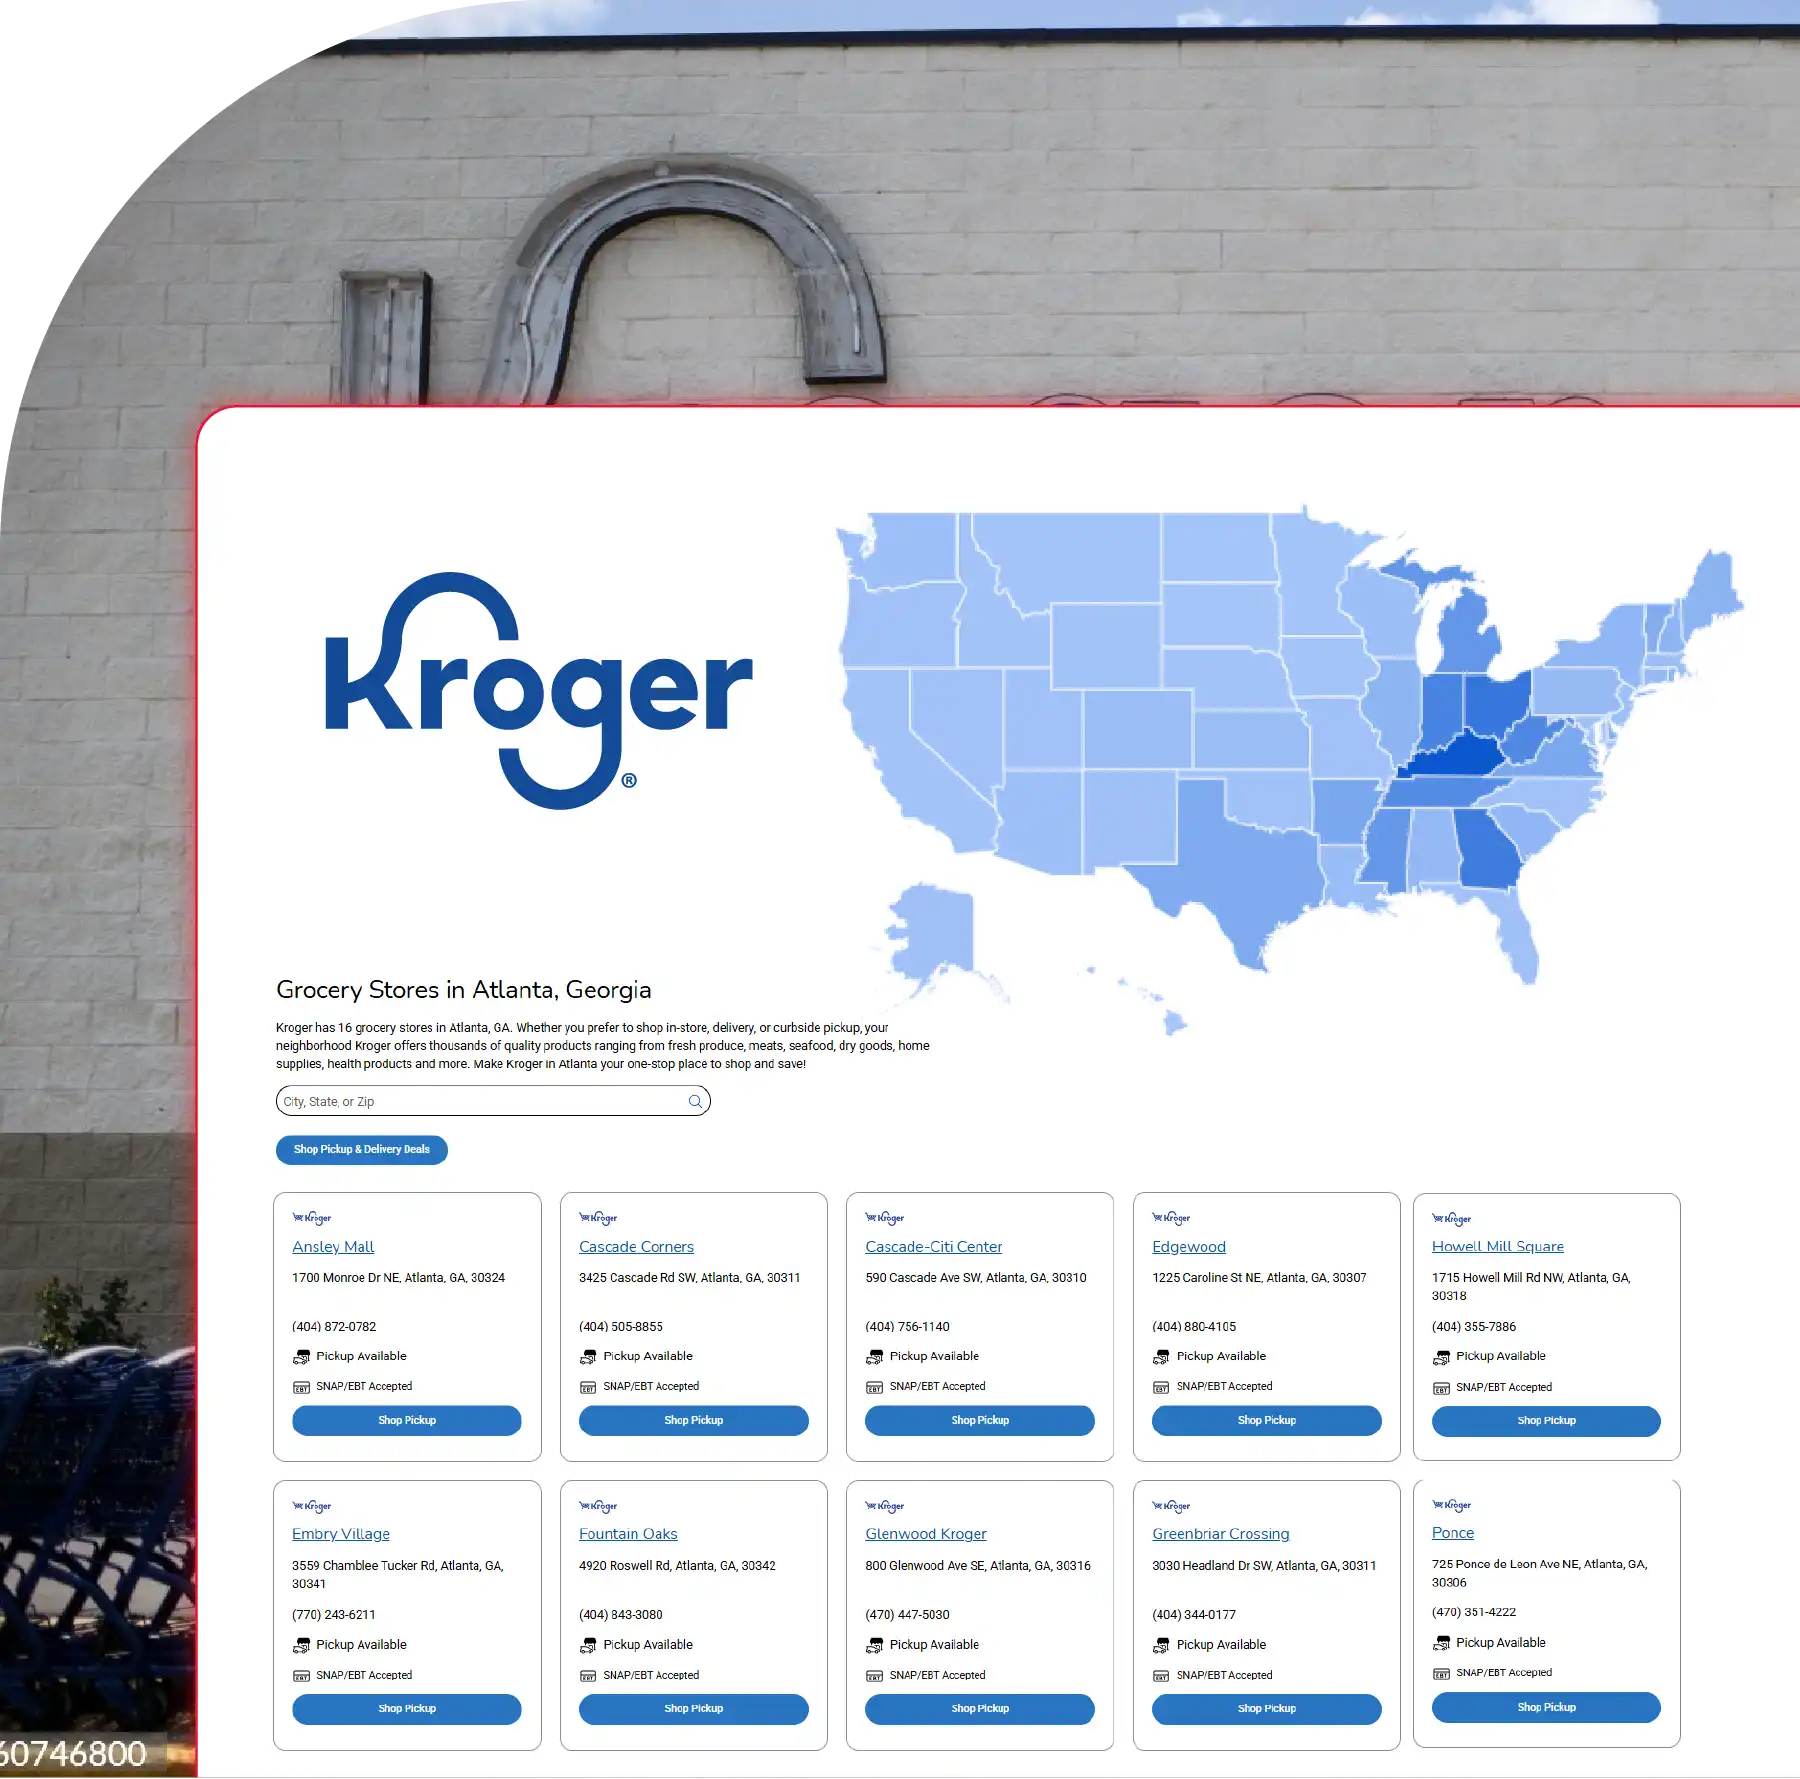
The data for this report was sourced from publicly available datasets specializing in retail location information. These datasets provide comprehensive details, including geocoded addresses, phone numbers, opening hours, and store banner specifics. The data reflects Kroger's store locations as of June 2025, encompassing both Kroger-branded stores and those under its subsidiary banners. This process involved Mapping Kroger Store Locations using Web Scraping techniques to ensure accurate and up-to-date spatial coverage of store assets. The datasets include store counts by state and city and the distribution of specific banners like Harris Teeter, Fred Meyer, and Smith's Food and Drug. By leveraging Kroger Supermarket Locations Data Scraping, we ensured a granular understanding of Kroger's diverse store formats and banner representation across various regions.
This analysis focuses on the 2,757 grocery stores reported by industry sources, cross-referenced with a broader dataset of 4,157 locations for the Kroger Company. This comprehensive count includes additional business formats such as pharmacies and fuel centers. The effort to Scrape Kroger Grocery Store Details ensures that this report offers a reliable foundation for location-based market analysis, expansion planning, and competitive benchmarking.
Data Analysis
Table 1: Kroger Store Locations by Top 15 States (2024 Data)
| State | Number of Stores | Percentage of Total Stores (%) | Population per Store (Approx.) |
|---|---|---|---|
| California | 299 | 7.2 | 131,103 |
| Texas | 209 | 5.0 | 138,737 |
| Ohio | 204 | 4.9 | 57,843 |
| Georgia | 171 | 4.1 | 62,573 |
| North Carolina | 151 | 3.6 | 69,536 |
| Virginia | 126 | 3.0 | 68,254 |
| Tennessee | 119 | 2.9 | 58,824 |
| Colorado | 108 | 2.6 | 53,704 |
| Washington | 105 | 2.5 | 73,333 |
| Indiana | 104 | 2.5 | 65,385 |
| Arizona | 99 | 2.4 | 73,434 |
| Kentucky | 95 | 2.3 | 47,368 |
| Illinois | 92 | 2.2 | 137,391 |
| Oregon | 87 | 2.1 | 48,736 |
| Michigan | 85 | 2.0 | 118,259 |
Analysis of Table 1
Table 1 presents the distribution of Kroger stores across the top 15 states in the U.S. as of 2024, based on a dataset of 4,157 Kroger Company locations. This data was compiled using advanced Kroger Grocery Chain Data Scraping methods to ensure comprehensive coverage of all store formats. California leads with 299 stores, representing 7.2% of the total, followed by Texas (209 stores, 5.0%) and Ohio (204 stores, 4.9%).
The population per store metric provides insight into market penetration. Ohio and Kentucky show the highest density, with 57,843 and 47,368 people per store respectively—highlighting Kroger’s deep regional presence and customer loyalty in its home state and neighboring areas. In contrast, California and Texas exhibit higher population-per-store figures (131,103 and 138,737), indicating more dispersed store networks likely shaped by intense competition from major retailers like Walmart, Costco, and regional leaders such as H-E-B.
Additionally, the dataset—sourced in part through Kroger Grocery Delivery Scraping API Services—reveals Kroger's strategic positioning in rapidly growing states such as Georgia and North Carolina. While store counts in these regions are strong, their lower density suggests room for expansion. This geographic intelligence, enhanced by efforts to Scrape Online Kroger Grocery Delivery App Data, offers valuable input for competitive benchmarking and future market planning.
Table 2: Kroger Store Distribution by Key Banners (2024 Data)
| Banner Name | Number of Stores | Percentage of Total Stores (%) | Primary States of Operation |
|---|---|---|---|
| Kroger | 1,342 | 48.7 | OH, GA, KY, IN, TN |
| Fred Meyer | 134 | 4.9 | WA, OR, ID, AK |
| Harris Teeter | 258 | 9.4 | NC, SC, VA, GA |
| Ralphs | 184 | 6.7 | CA |
| King Soopers | 117 | 4.2 | CO, WY |
| Smith’s Food & Drug | 142 | 5.2 | UT, NV, AZ, NM |
| Fry’s Food Stores | 123 | 4.5 | AZ |
| Others | 457 | 16.6 | Various |
Source: Publicly available retail location dataset (2024)
Table 2 details the distribution of Kroger’s stores across its key banners, based on the 2,757 grocery stores reported for 2024. This banner-level breakdown was enriched using Grocery App Data Scraping Services, allowing a precise view of Kroger's retail strategy by brand identity and geography. The Kroger banner dominates, accounting for 48.7% of stores (1,342 locations), with a stronghold in states like Ohio, Georgia, Kentucky, Indiana, and Tennessee—illustrating the brand's deep roots in the Midwest and Southeast.
Harris Teeter, with 258 stores (9.4%), plays a significant role in the Southeast, especially in North Carolina and Virginia, where it serves a more upscale consumer base. Fred Meyer (134 stores, 4.9%) and Ralphs (184 stores, 6.7%) highlight Kroger’s regional strategy in the Pacific Northwest and California, respectively. Smith’s Food & Drug and Fry’s Food Stores, with 142 and 123 stores, mainly serve the Southwest, focusing on Utah and Arizona. This data, sourced via Web Scraping Quick Commerce Data, provides insights into Kroger’s ability to target local market demands effectively.
The “Others” category, comprising 457 stores (16.6%), includes niche and regional brands like Food 4 Less and QFC. These diverse banners reflect Kroger’s adaptability and customer segmentation strategy. Powered by Grocery Delivery Scraping API Services, this analysis underscores how Kroger leverages its multi-banner structure to cater to varying regional preferences and shopping behaviors.

The data underscores Kroger’s strategic approach to maintaining a strong national presence while adapting to regional market dynamics. The concentration of stores in Ohio and Kentucky reflects a stronghold in the Midwest, where Kroger benefits from brand recognition and operational efficiencies. However, the lower store density in high-population states like California and Texas suggests opportunities for expansion, particularly as these states continue to experience population growth.
The company’s diverse banner portfolio enables it to compete with a range of retailers, from discount chains like Walmart to premium grocers like Whole Foods. For instance, Harris Teeter’s focus on the Southeast positions Kroger to capture higher-margin customers, while Fry’s and Smith’s target price-sensitive consumers in the Southwest.
Using enriched Grocery Store Datasets, Kroger can identify new market opportunities, optimize store placement, and enhance operational efficiency. This strategic use of Grocery Pricing Data Intelligence ensures Kroger remains agile and responsive across varied market landscapes, strengthening its competitiveness and long-term growth in the U.S. grocery sector.
The data also highlights potential vulnerabilities. In states like California and Texas, where population per store is high, Kroger faces intense competition from regional and national chains. Expanding in these markets may require investing in smaller-format stores or enhancing digital offerings, such as online grocery delivery, to compete with Amazon and Walmart.
Additionally, the reliance on the Kroger banner for nearly half of its stores could pose risks if consumer preferences shift toward specialized formats, necessitating continued investment in banner diversification.
From a strategic perspective, Kroger’s presence in 35 states suggests a balanced approach to national coverage, but the absence of stores in 15 states indicates untapped markets. Exploring these regions, particularly in the Northeast where Kroger has limited presence, could drive future growth. Furthermore, the data suggests Kroger could leverage its regional banners to test innovative store formats or sustainability initiatives, aligning with consumer trends toward eco-friendly and locally sourced products.
The analysis of Kroger's 2,757 grocery store locations across 35 states highlights the company's strategic and well-balanced market presence. California, Texas, and Ohio emerge as key markets, with Ohio and Kentucky showing particularly high store density due to Kroger’s historical roots and regional loyalty. Its multi-banner approach—including brands like Harris Teeter, Fred Meyer, Ralphs, and Smith’s Food & Drug—enables it to adapt to diverse regional consumer preferences and market conditions.
By leveraging a Grocery Price Dashboard, stakeholders can visualize pricing strategies and assess regional market strengths with precision. The use of a Grocery Price Tracking Dashboard further enhances decision-making by enabling real-time monitoring of pricing trends, competitive movement, and market saturation levels.
Are you in need of high-class scraping services? Food Data Scrape should be your first point of call. We are undoubtedly the best in Food Data Aggregator and Mobile Grocery App Scraping service and we render impeccable data insights and analytics for strategic decision-making. With a legacy of excellence as our backbone, we help companies become data-driven, fueling their development. Please take advantage of our tailored solutions that will add value to your business. Contact us today to unlock the value of your data.

