
This detailed report examines the nationwide presence of Total Wine & More as of 2025, highlighting its extensive retail network across 29 states with 285 stores. It offers a clear picture of store distribution by state and major cities, emphasizing the company’s stronghold in high-consumption markets like California, Texas, and Florida. The report also identifies regions where the brand has yet to expand, largely due to regulatory limitations. Additionally, it explores recent growth trends, economic contributions, and future prospects, providing valuable insights for businesses and analysts interested in the alcoholic beverage retail sector.
• Total Wine & More operates 285 stores across 29 U.S. states.
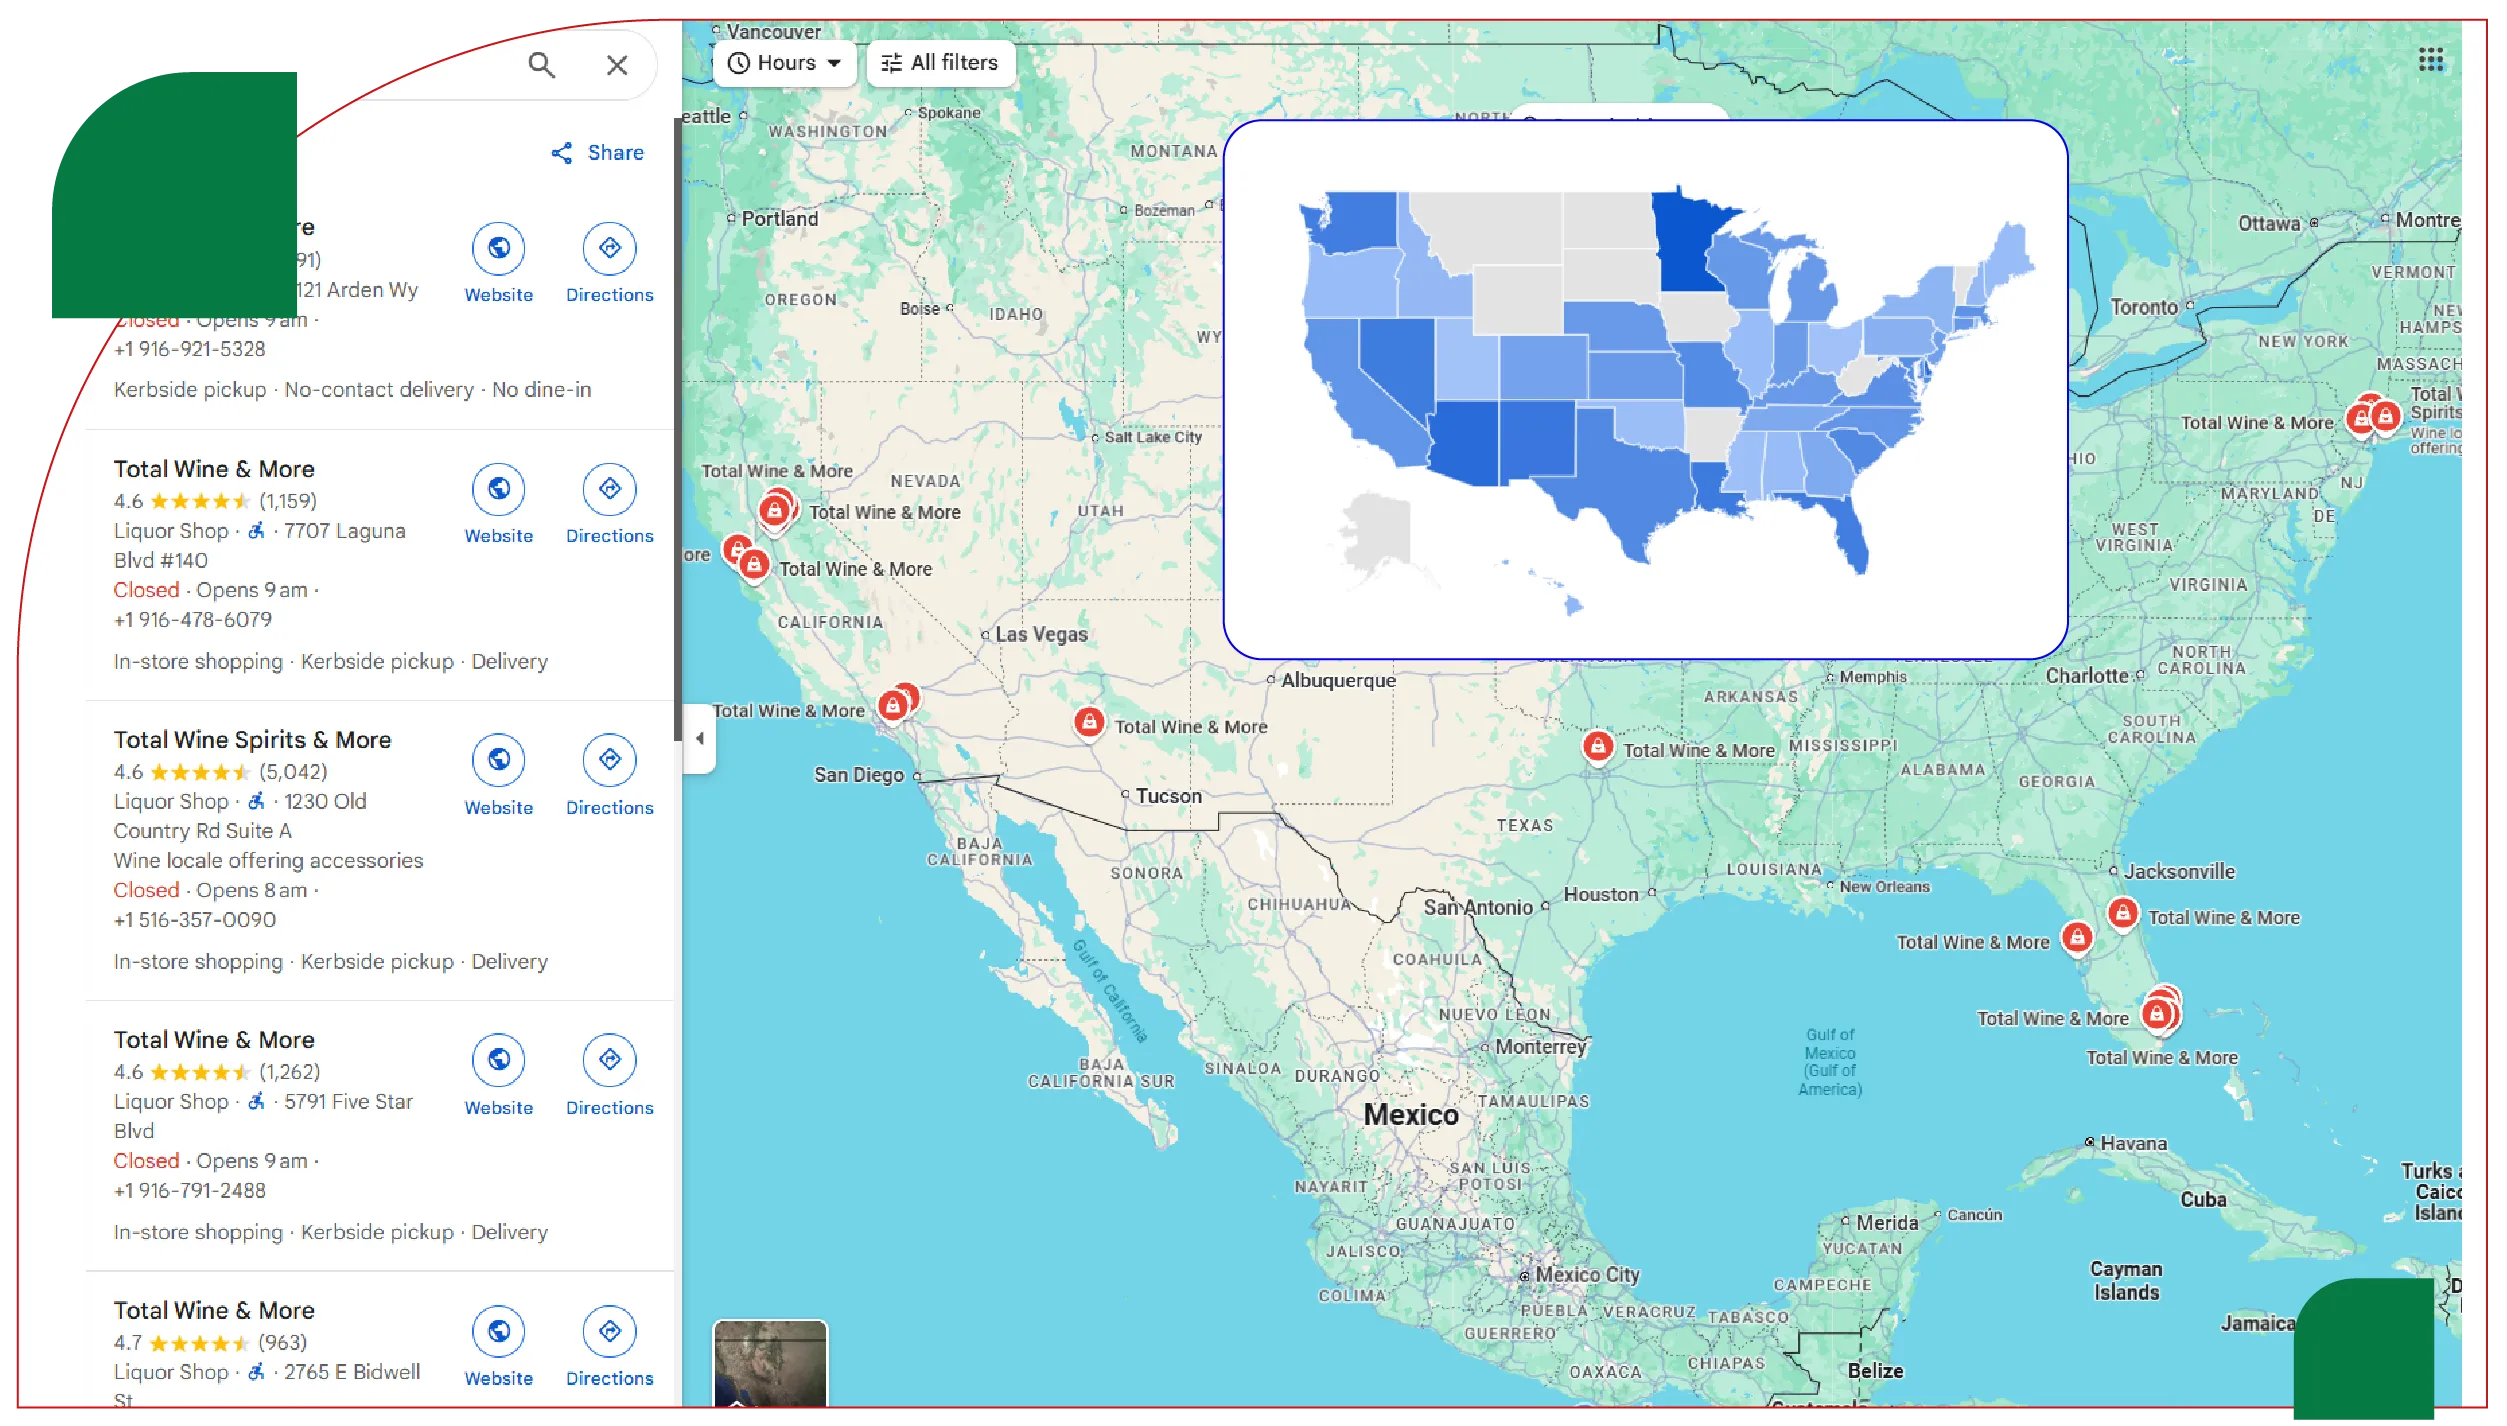
• The highest store concentrations are in California, Florida, and Texas.
• Major metro areas host dense clusters of retail outlets.
• Several states and territories remain without any store presence.
• The company plans steady growth with new store openings through 2030.
Total Wine & More has secured its position as the number one wine, beer, and spirits retailer across the United States, with 285 stores in 29 states. The company's ability to find deep penetration in the marketplace is attributed to three main objectives: smart geographic placement, a full range of alcoholic beverages, and a unique regional presence. This report for 2025 takes a look at the company's reach as a retailer across the country in detail. The report aims to Extract Total Wine & More Store Locations USA 2025 and put a pin in where the brand is strong and where there might be white space for growth opportunities.
This report includes thorough research and retail analytics. It addresses a complete US Total Wine and More Store Locations Data Set that outlines the store distribution in each US state, city, and region. The report details growth states like California, Texas, and Florida but also continues to track the States of opportunity identified, notably Alaska, Mississippi, and Utah. Companies or analysts intending to Scrape Total Wine & More Store Count by State -2025 could gain relevant insights from this report. Suppose companies can utilize the Web Scraping Total Wine & More Retail Chain Data USA. In that case, they can better understand competitor preference and positioning, supply chain efficiencies, and location-based strategies defining Total Wine's retail dominance across the American alcohol landscape.
Founded in 1991, Total Wine & More is headquartered in Bethesda, Maryland, and has become one of America's most prominent alcohol retailers. Each location is a one-stop destination for wine, beer, and spirits enthusiasts, offering thousands of product options under one roof. Total Wine & More Store Data Extraction USA 2025 provides insights into the company's expansive and strategic retail footprint. Store sizes typically range from 20,000 to 50,000 square feet and often include tasting bars, event spaces, and knowledgeable staff to guide purchasing decisions. Scrape Total Wine & More Store Addresses in the USA 2025 to analyze the layout and structure of each retail outlet across major urban markets.
This immersive experience enhances customer loyalty and reflects the brand's dedication to alcohol education and service. Scrape Total Wine & More Store Addresses in the USA 2025 to gather accurate and location-specific data on store environments.
Growth Philosophy:
As of mid-2025, Total Wine & More operates 285 store locations across the United States, reflecting steady and strategic growth over the past five years. The brand's expansion has been robust in high-consumption states like California, Texas, and Florida, where demand for premium alcoholic beverages remains consistently high. Total Wine Liquor Price Scrapinghas become essential for businesses monitoring pricing trends and competitor positioning in these markets. With a growing retail footprint and diverse pricing strategies, companies now seek to Extract Total Wine and More Liquor Price Data to better understand regional variations and promotional patterns.
Advanced users often rely on tools to Extract API For Total Wine Liquor Prices for real-time data collection and analytics integration.
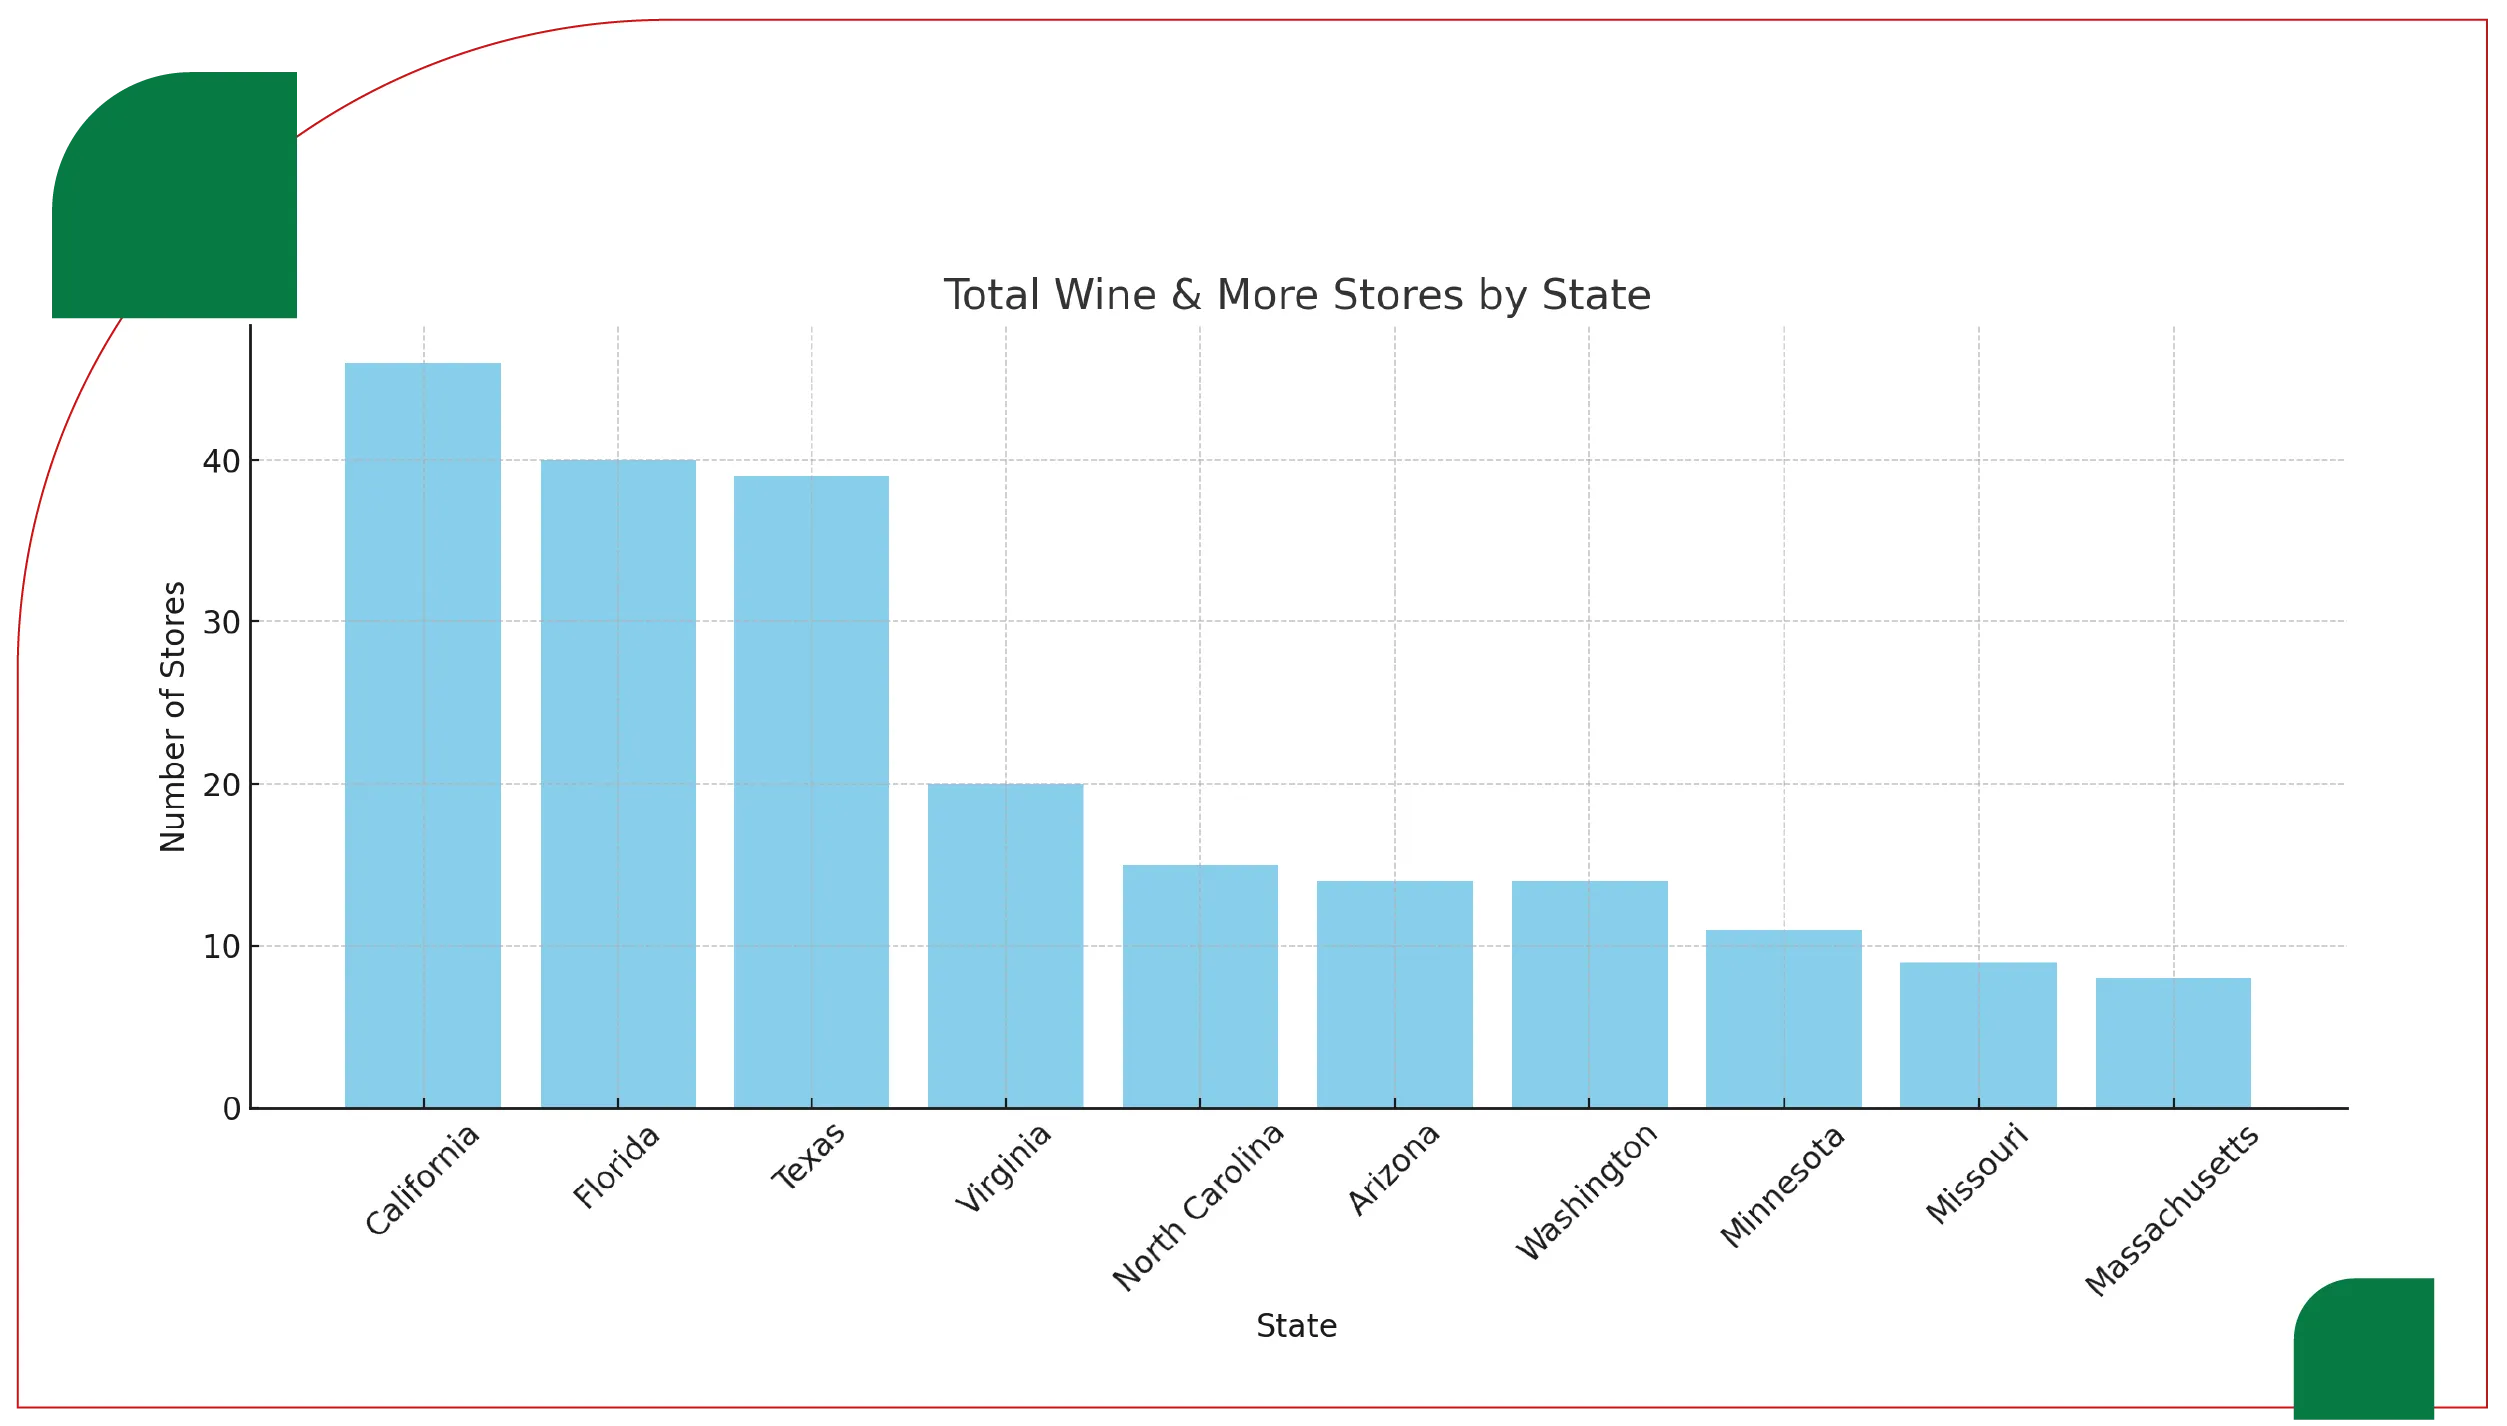
The following table presents the distribution of Total Wine & More stores across the top 10 states:
Table 1: Total Wine & More Stores by State
| State | Number of Stores | % of National Total |
|---|---|---|
| California | 46 | 16% |
| Florida | 40 | 14% |
| Texas | 39 | 14% |
| Virginia | 20 | 7% |
| North Carolina | 15 | 5% |
| Arizona | 14 | 5% |
| Washington | 14 | 5% |
| Minnesota | 11 | 4% |
| Missouri | 9 | 3% |
| Massachusetts | 8 | 3% |
Insight:
These 10 states collectively account for 76% of all Total Wine stores. The company's emphasis on these markets stems from population density, regulatory freedom, and purchasing behavior.
Several major metro areas across the United States host dense clusters of Total Wine & More outlets, especially in regions known for high footfall, strong retail ecosystems, and diverse, cosmopolitan consumers. These locations are carefully selected based on demographics, purchasing behavior, and proximity to other major retail chains. Total Wine Liquor Prices Dataset from these urban centers reveals pricing strategies tailored to local demand and competition.
Retailers, analysts, and suppliers increasingly turn to Alcohol Price Data Scraping Services to monitor how Total Wine adjusts its prices across different cities.
By leveraging Liquor Price Data Scraping Services, businesses can analyze patterns, track promotions, and respond effectively to market fluctuations in these high-performance zones.
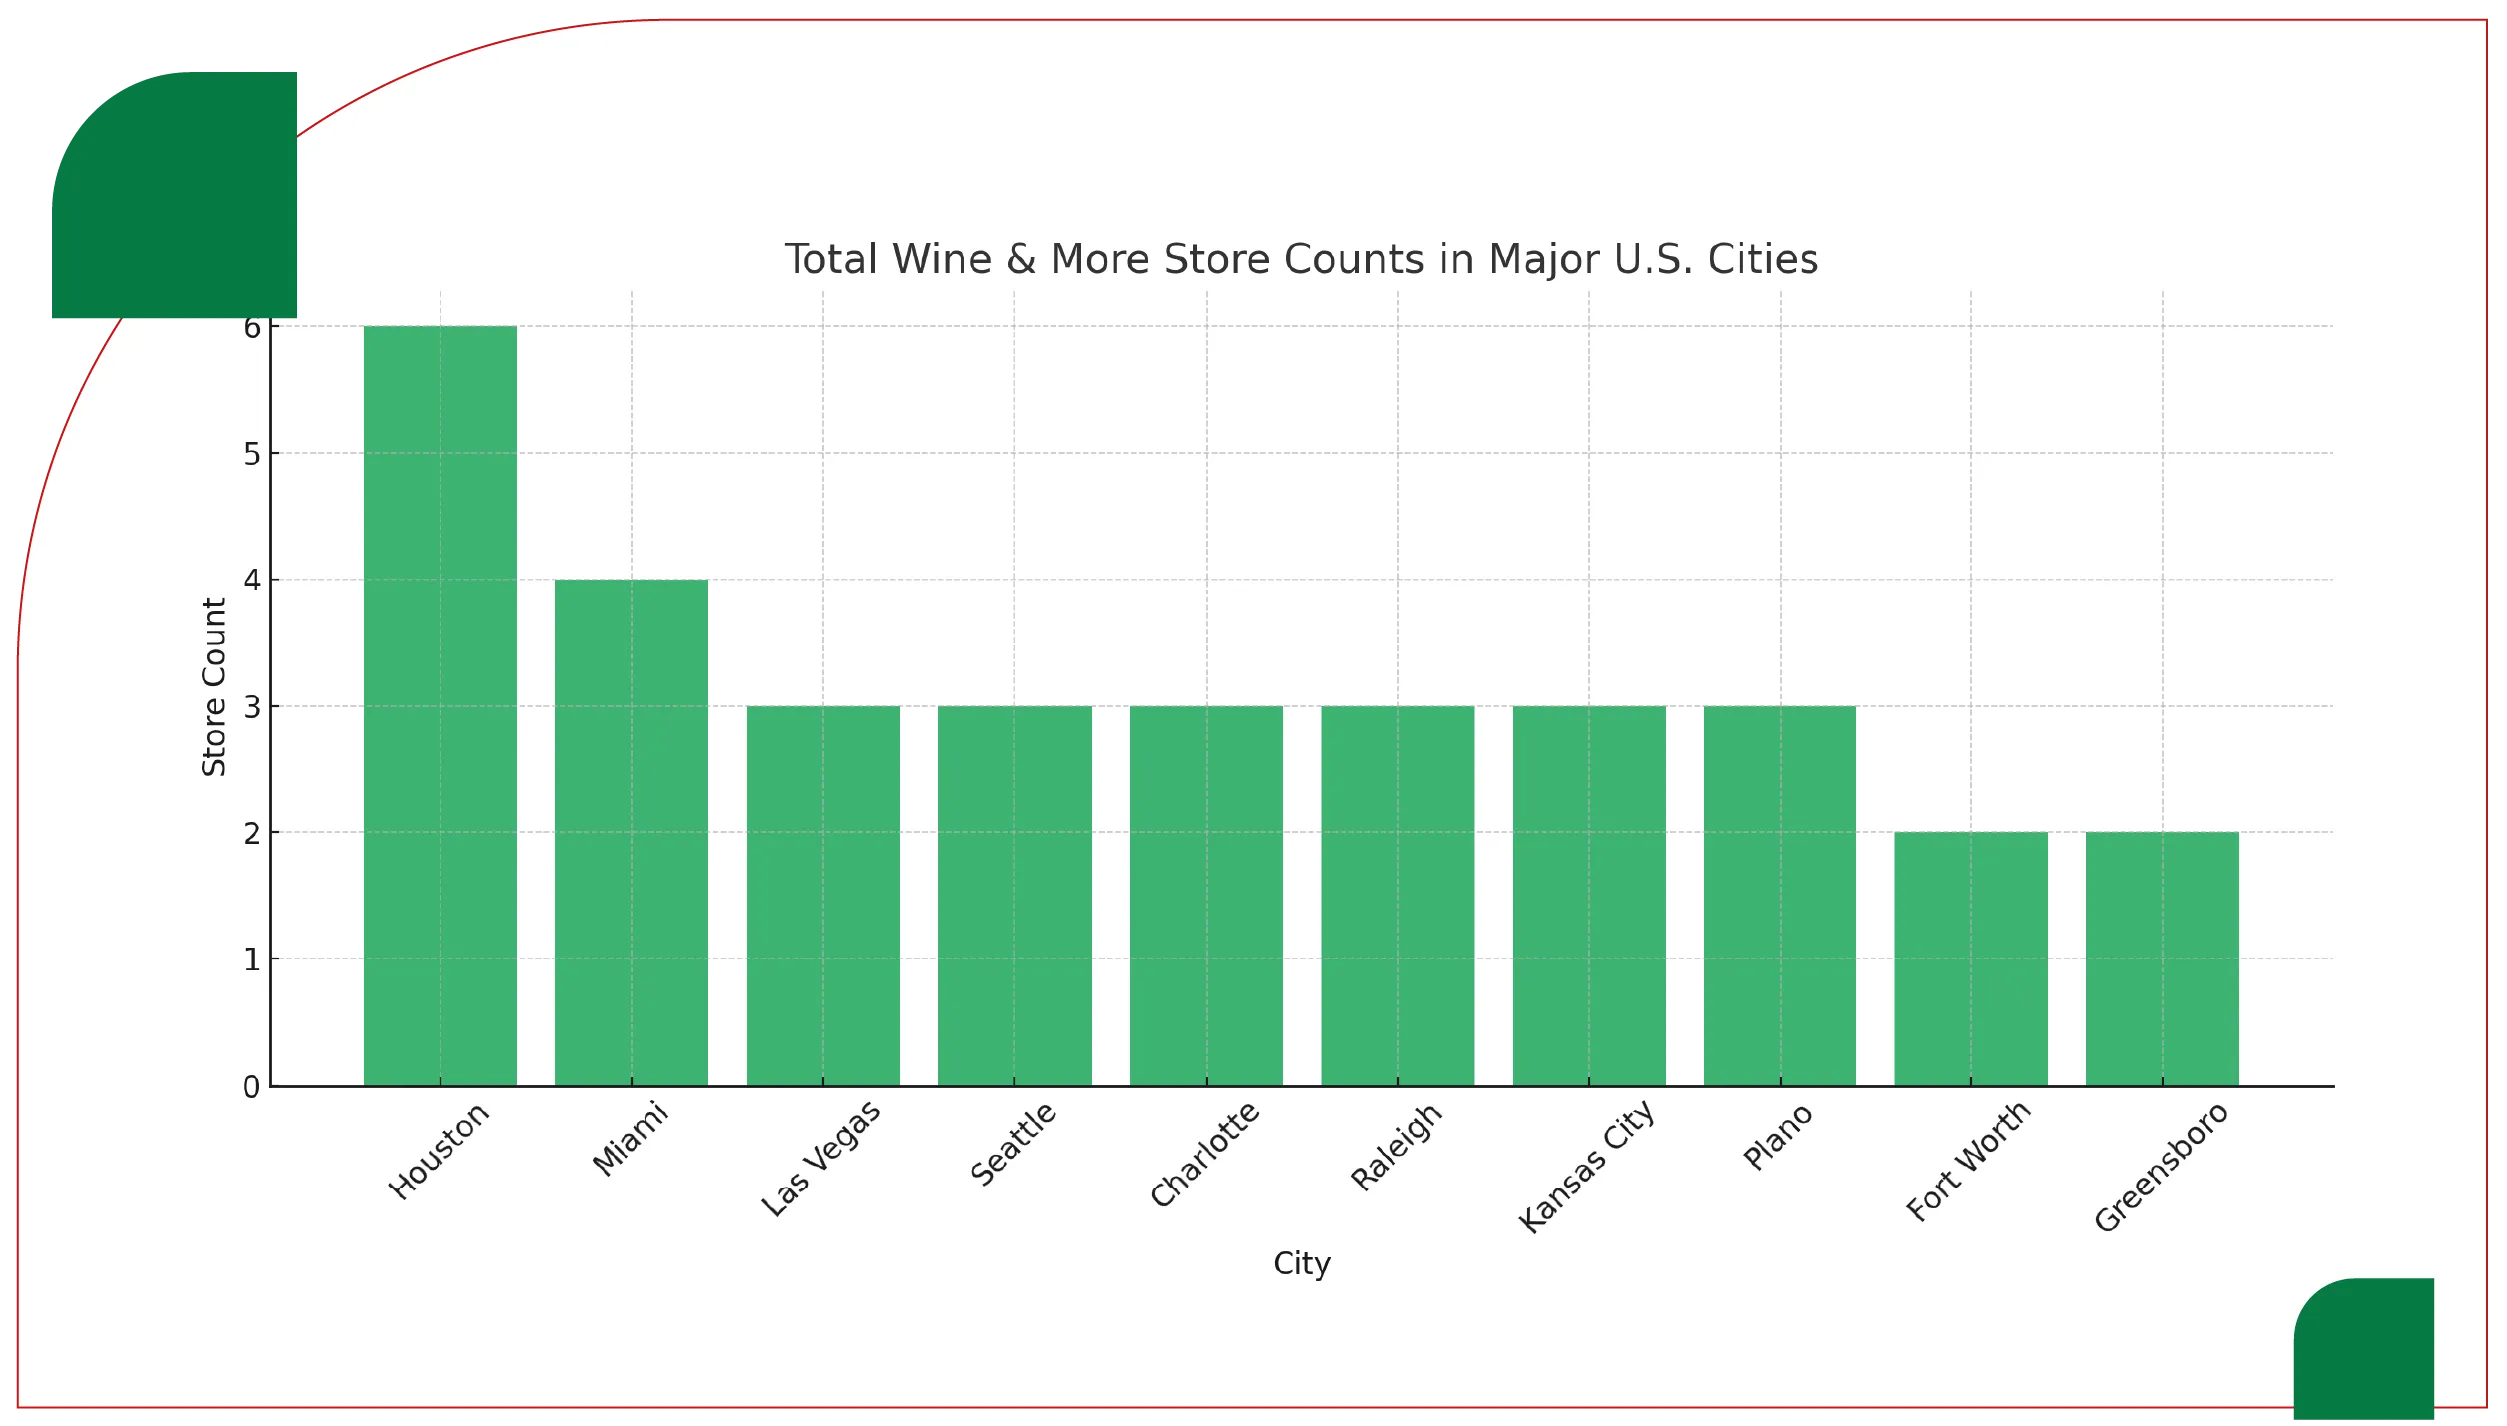
Table 2: Store Counts in Major U.S. Cities
| City | State | Store Count |
|---|---|---|
| Houston | Texas | 6 |
| Miami | Florida | 4 |
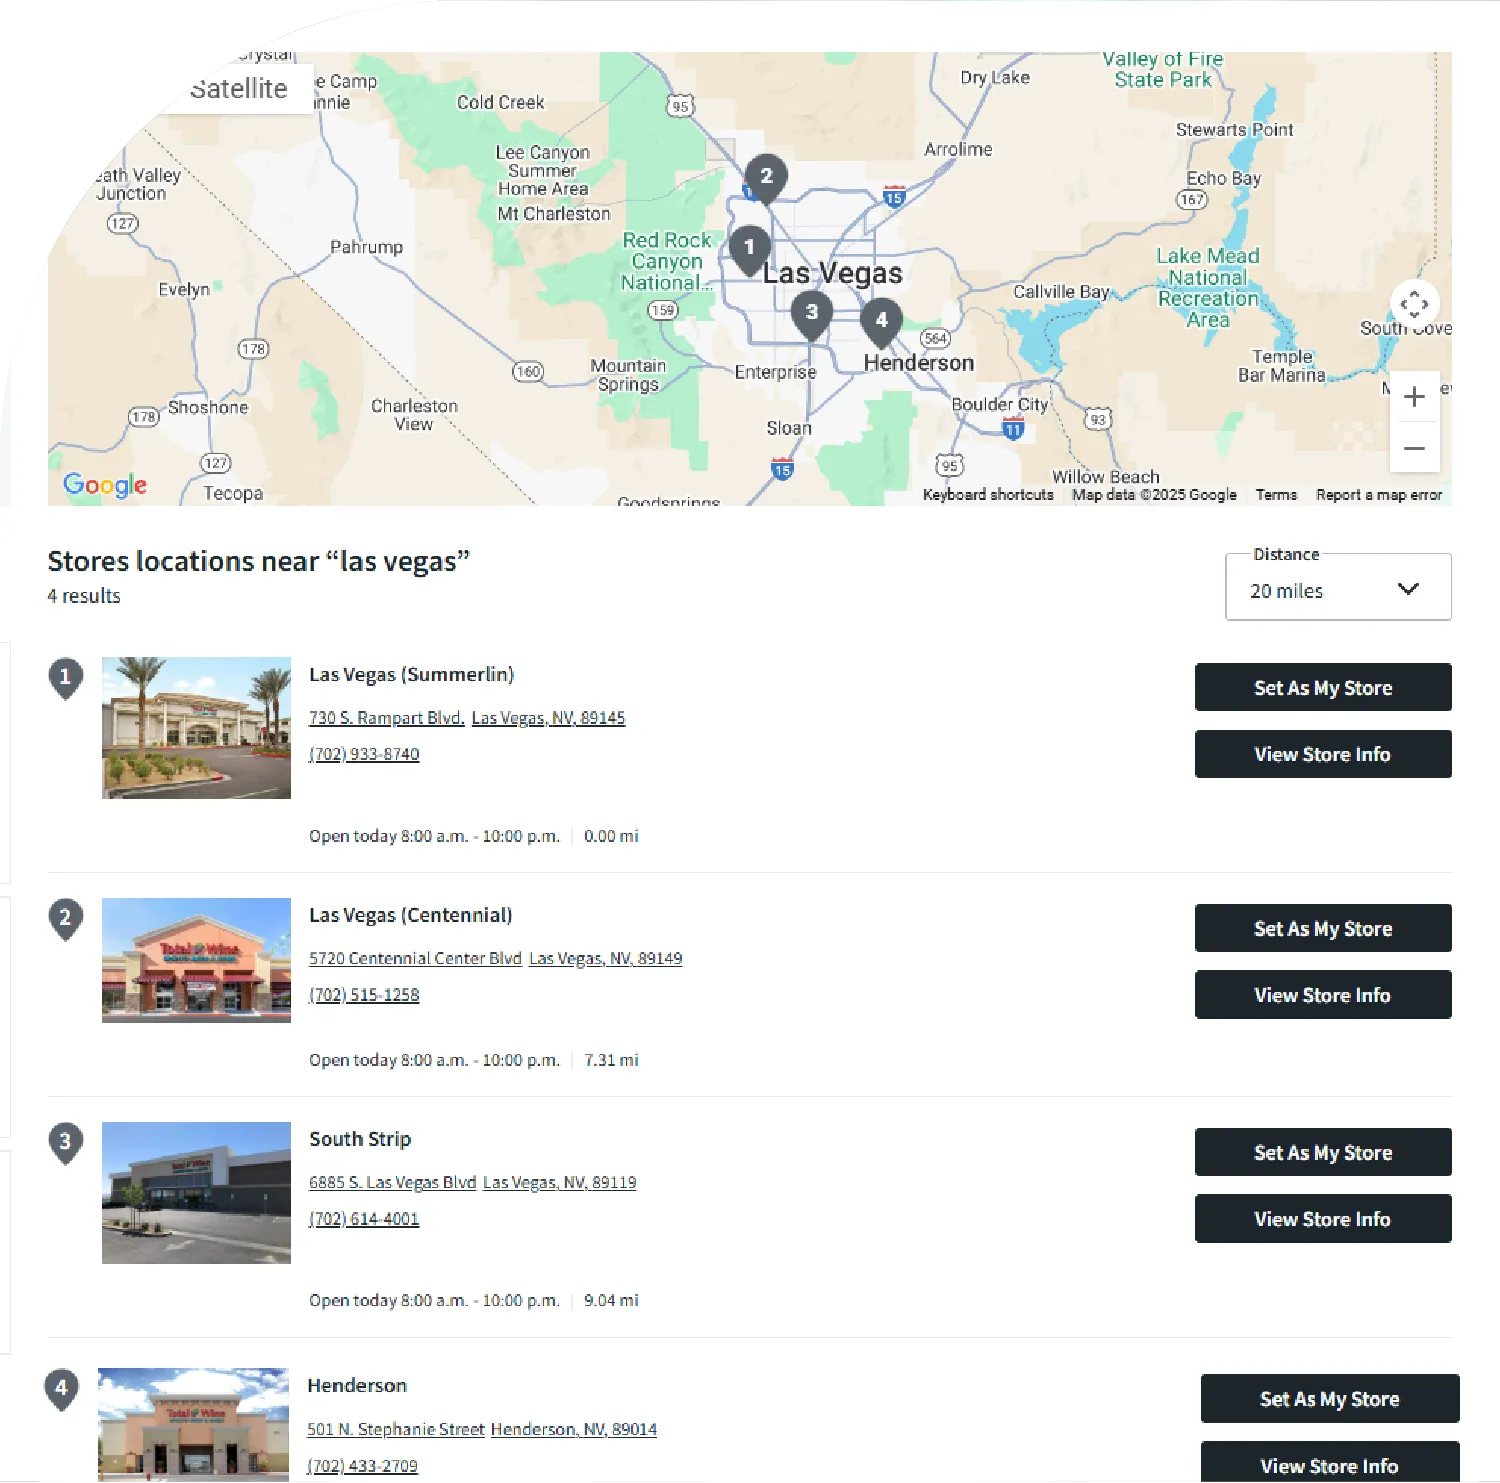
| Las Vegas | Nevada | 3 |
| Seattle | Washington | 3 |
| Charlotte | North Carolina | 3 |
| Raleigh | North Carolina | 3 |
| Kansas City | Missouri | 3 |
| Plano | Texas | 3 |
| Fort Worth | Texas | 2 |
| Greensboro | North Carolina | 2 |
Insight:
Texas cities dominate this list, especially Houston, which hosts the highest number of Total Wine outlets in a single U.S. city. This confirms the brand's appeal in urban areas with sophisticated customer bases.
Geographic Gaps: U.S. States and Territories Without Total Wine Stores
Despite its growth, there are 27 U.S. states and territories where Total Wine has no presence. The reasons range from restrictive alcohol sales laws to lack of strategic market size.
Table 3: U.S. States & Territories Without Total Wine & More Stores
| No Stores in These States/Territories |
|---|
| Idaho, Alaska, Hawaii, Utah, Mississippi, South Dakota, Connecticut, Oregon |
| Maine, Rhode Island, Montana, Vermont, West Virginia, New Hampshire |
| North Dakota, Iowa, Alabama, Arkansas, Oklahoma, Pennsylvania, Wyoming |
| District of Columbia, Puerto Rico, Guam, American Samoa, U.S. Virgin Islands |
| Northern Mariana Islands |
Insight:
Several of these regions operate under state-controlled alcohol distribution systems, which limit the entry of private alcohol retailers. In some cases, geographic or logistic constraints also influence the company’s expansion decisions.
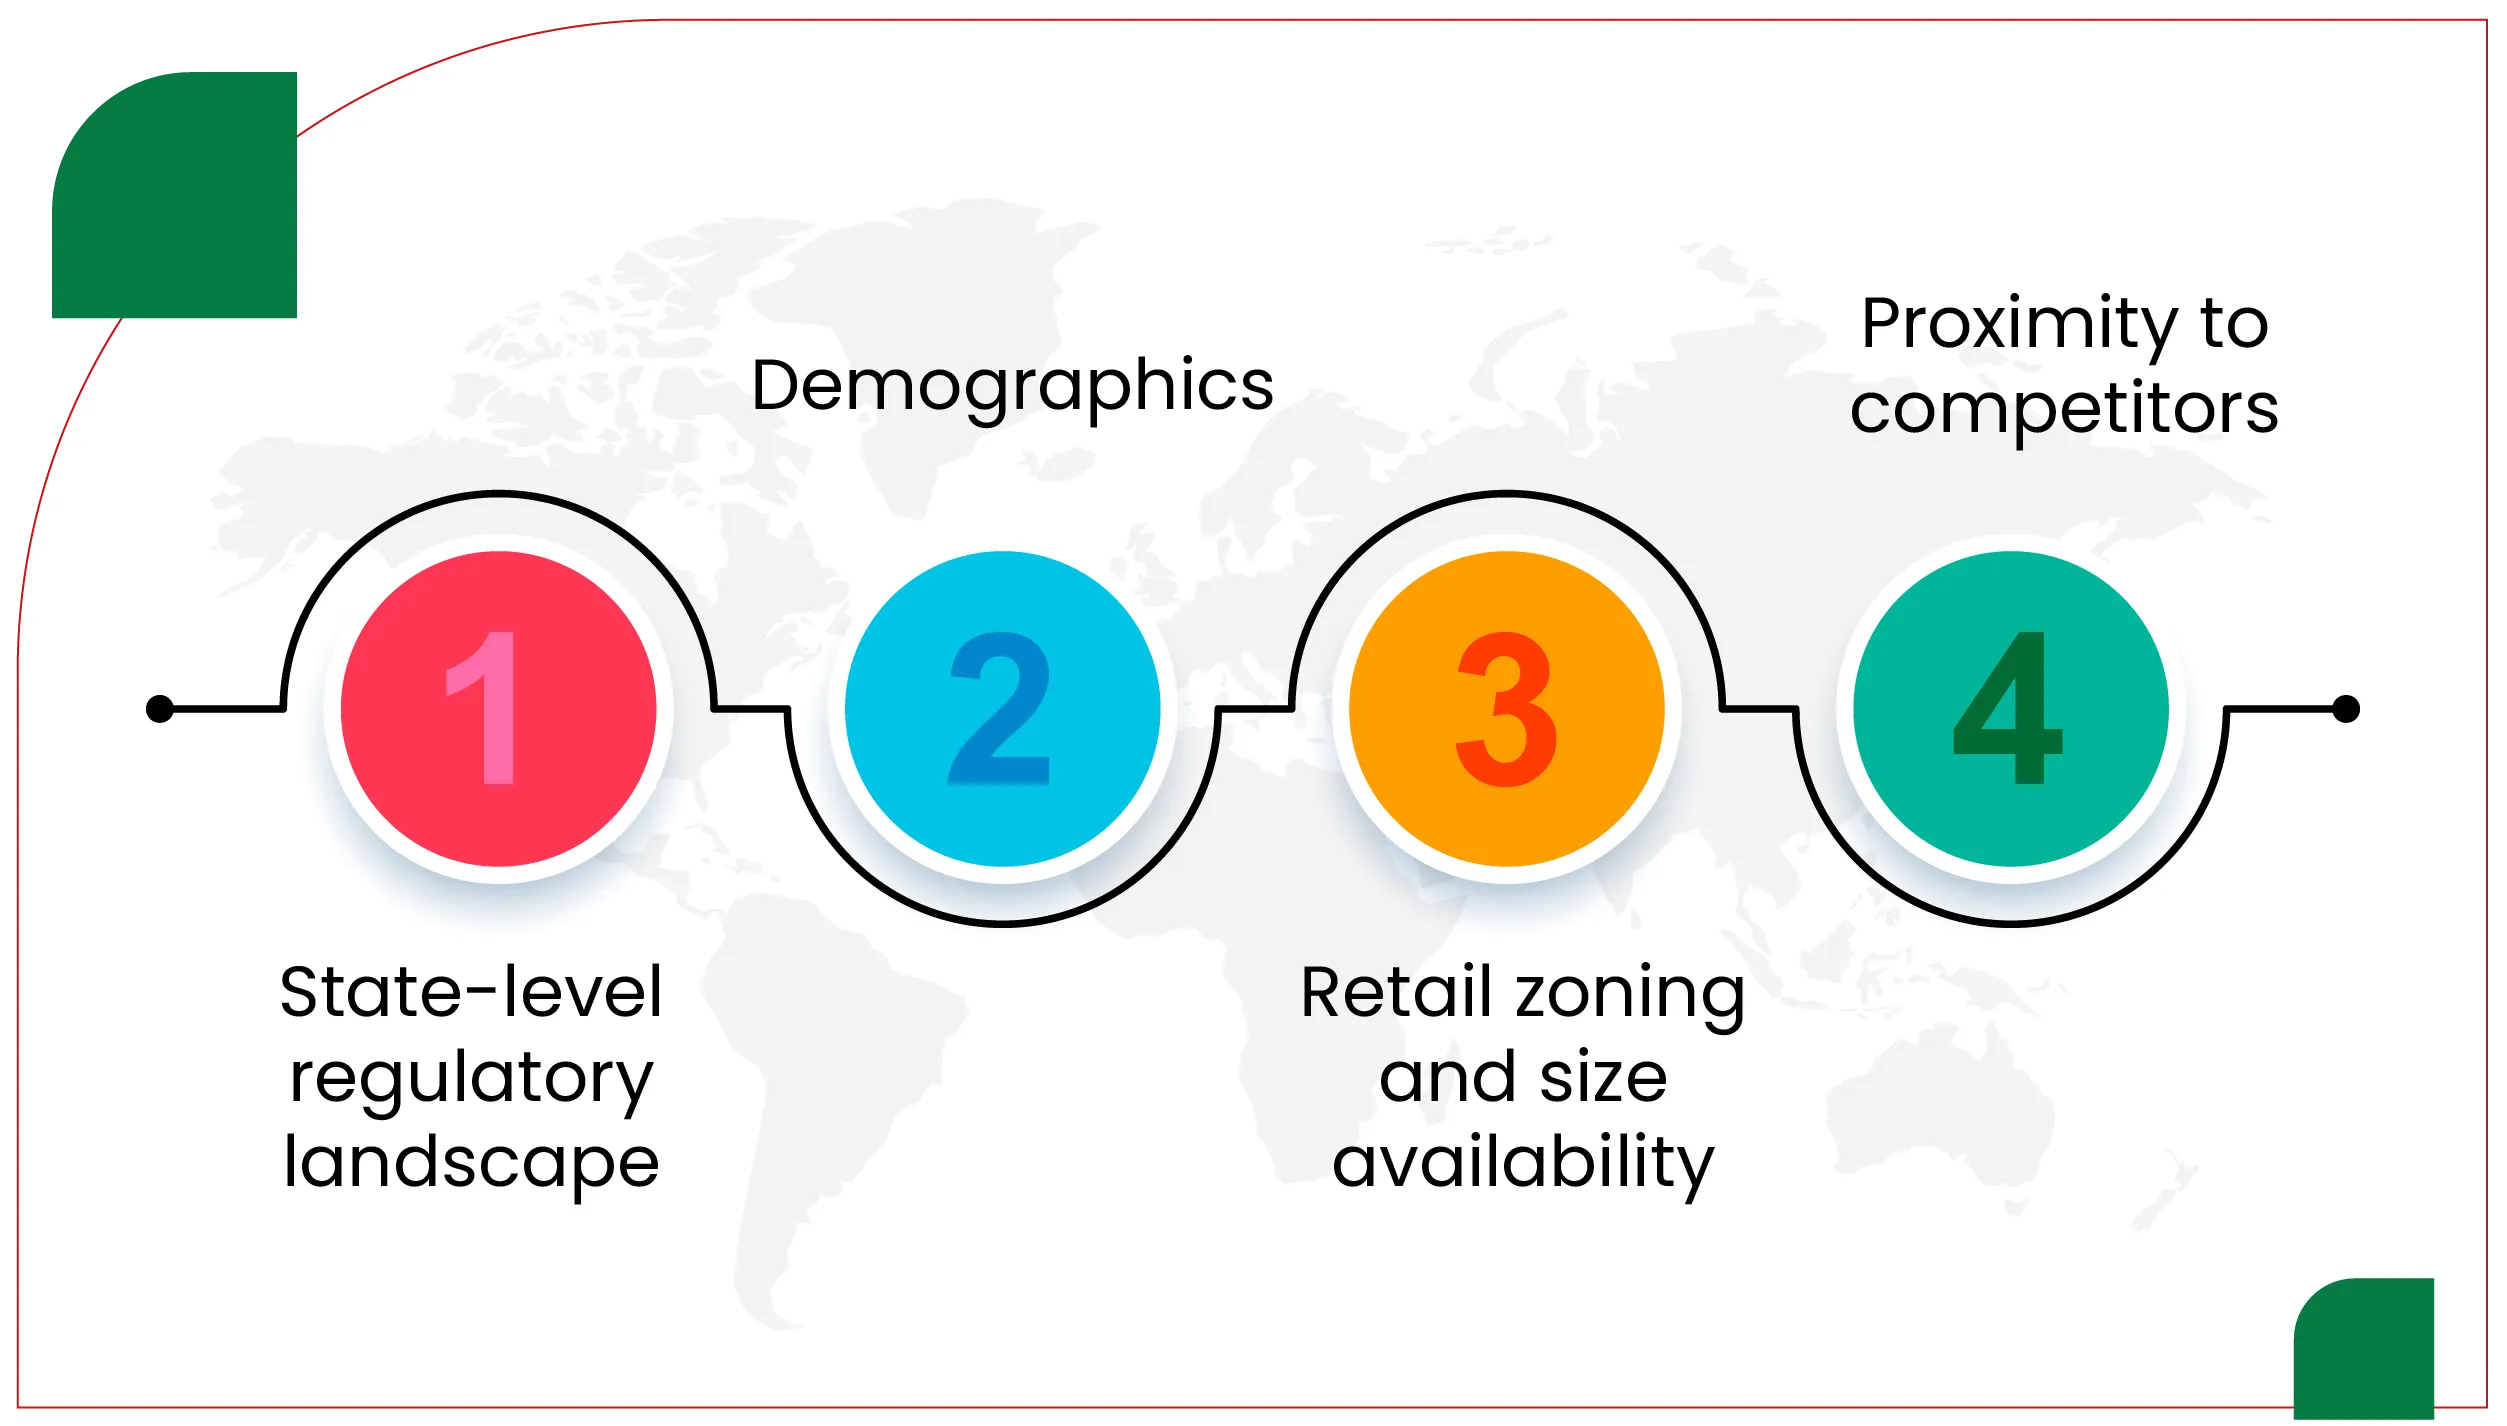
Total Wine & More selects store locations based on a combination of:
Between 2020 and 2025, Total Wine & More added 58 new stores, averaging 11–12 new openings per year. The most significant expansions were in:
This reflects the company’s sustained investment in high-consumption and growth-oriented states.

Total Wine & More contributes to local economies by:
This community-oriented approach enhances brand loyalty and positions Total Wine as a stakeholder in the beverage economy of each region.
Based on current trends, Total Wine & More is projected to:
Additionally, the brand may explore urban micro-store formats and delivery-only hubs to cater to evolving urban shopping habits.
Total Wine & More has established a formidable national footprint, commanding a majority share of the specialty wine and spirits retail market. With 285 stores across 29 states, the brand is strategically positioned for ongoing expansion in the U.S. market. Scrape Liquor Price Data from Total Wine & More to uncover region-specific trends, competitive benchmarks, and pricing models.
The company’s data-driven approach to store placement and extensive product catalog has enabled it to thrive in key urban centers while maintaining strong profitability. However, regulatory restrictions continue to hinder complete nationwide presence. Businesses, investors, and distributors can benefit from accessing Alcohol and Liquor Datasets to map growth opportunities.
By using Web Scraping Liquor Prices Data, stakeholders gain valuable insights into Total Wine’s pricing dynamics and retail influence.
Are you in need of high-class scraping services? Food Data Scrape should be your first point of call. We are undoubtedly the best in Food Data Aggregator and Mobile Grocery App Scraping service and we render impeccable data insights and analytics for strategic decision-making. With a legacy of excellence as our backbone, we help companies become data-driven, fueling their development. Please take advantage of our tailored solutions that will add value to your business. Contact us today to unlock the value of your data.

