
The Indian grocery sector is witnessing a rapid transformation, driven by shifting consumption patterns across urban and Tier-2 cities. Urban markets prioritize convenience, premium, and specialty products, while Tier-2 regions show rising adoption of online grocery platforms, with stronger focus on affordability, bulk purchases, and essential goods. Comparative insights reveal differences in category demand, pricing sensitivity, and seasonal buying behaviour. By analysing region-specific grocery consumption, businesses can optimize distribution, pricing strategies, inventory management, and promotional planning. Advanced data collection and analytical tools enable real-time monitoring of product availability, demand fluctuations, and competitive activity, supporting smarter retail strategies and sustainable growth across diverse city tiers.

Urban Premium Preference: Strong demand for convenience, specialty, and premium product categories in metro regions.
Tier-2 Value Focus: Higher dependency on discounts, affordability, and bulk household essentials.
Category Performance Gaps: Distinct growth patterns across dairy, staples, snacks, and frozen foods.
Pricing Sensitivity: Platform-wise and region-wise price differences significantly influence purchasing behaviour.
Future Growth Potential: Tier-2 markets expanding fastest due to rapid digital adoption.
Understanding the shifting dynamics of grocery consumption across different geographies is essential for retailers, FMCG brands, delivery apps, and supply chain decision-makers in India. Today, enterprises aim to Extract Urban vs Tier-2 Grocery Demand Data in India, enabling them to benchmark consumer preferences, identify regional variations, and optimize distribution strategies. Modern analytical approaches rely heavily on Web Scraping Urban vs Tier-2 Grocery Demand Data in India, providing real-time insights into grocery category performance, inventory fluctuations, and price variations across metropolitan and emerging second-tier markets.
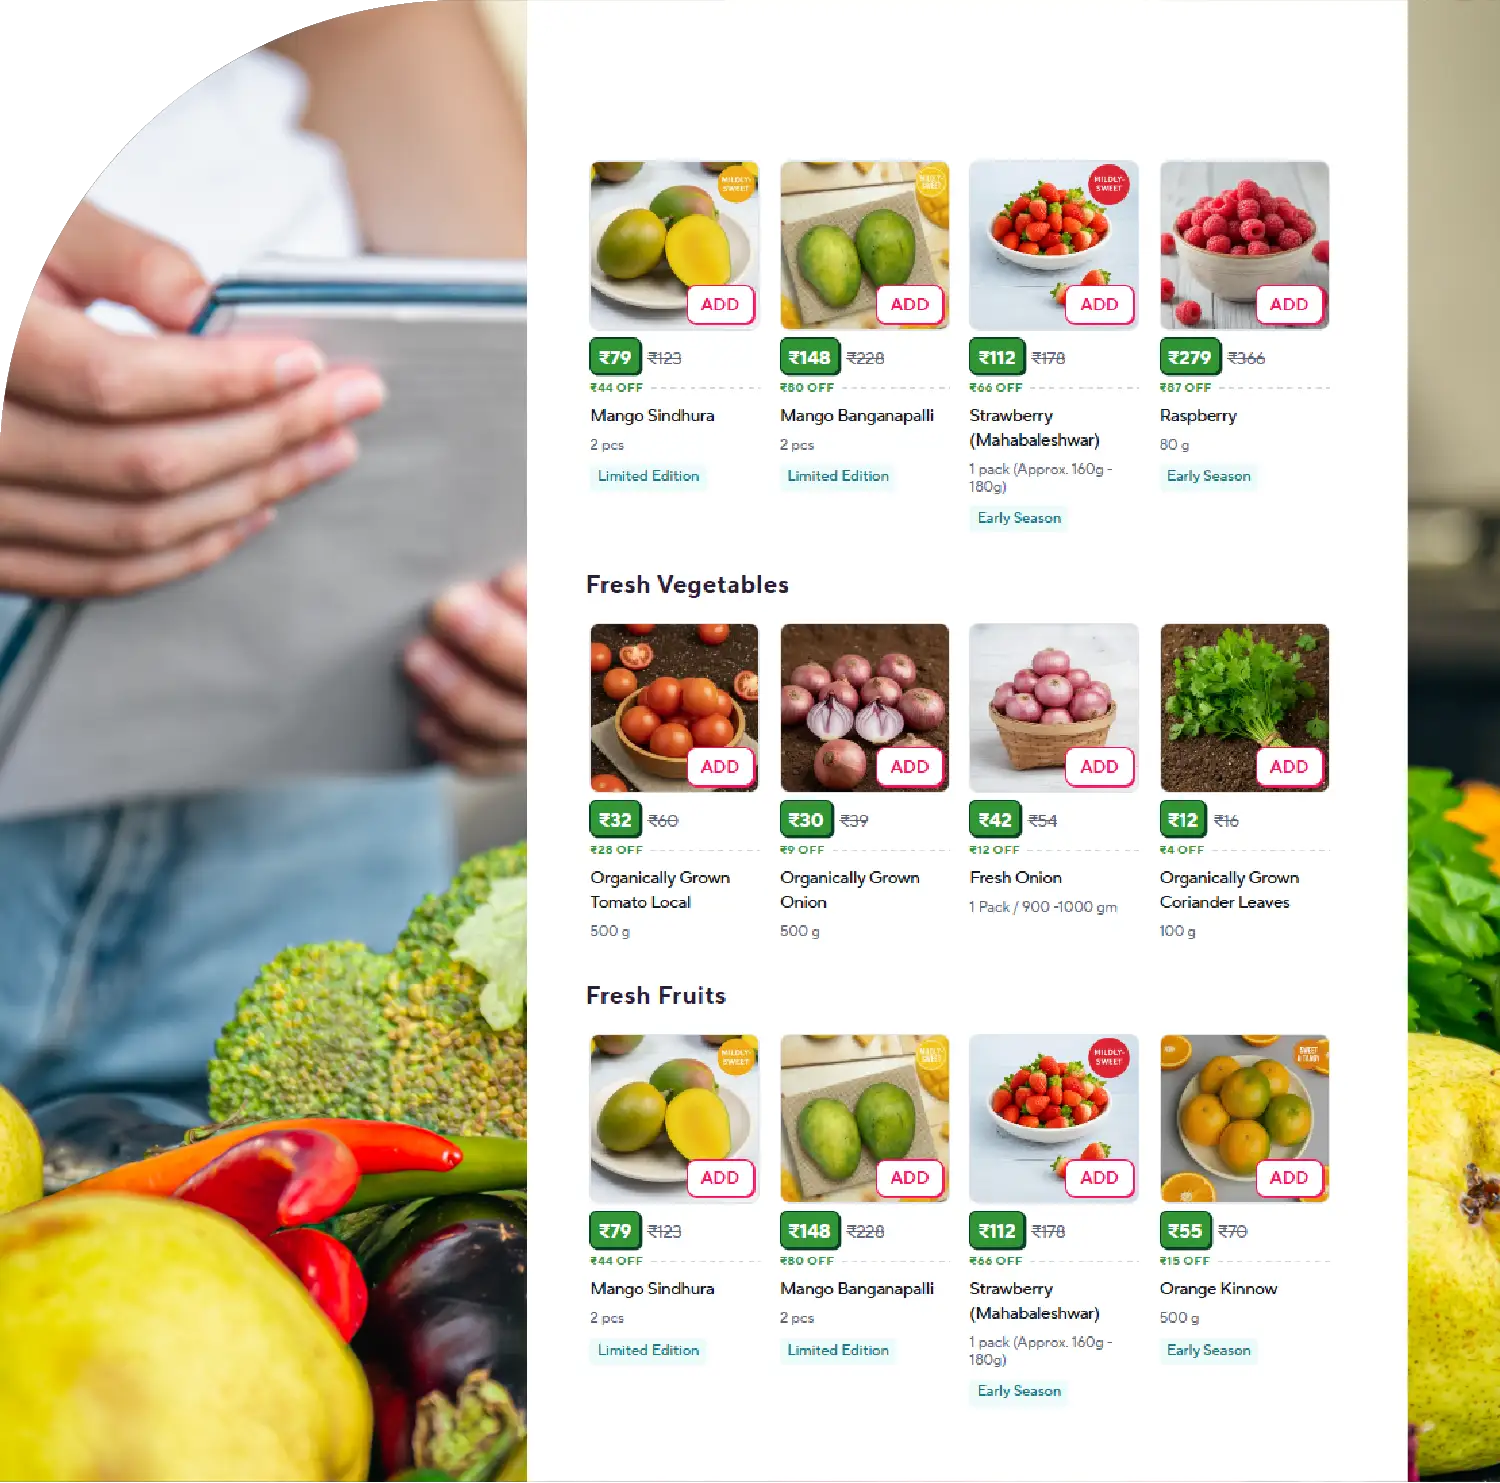
Urban grocery markets—such as Delhi NCR, Mumbai, Bengaluru, and Hyderabad—show strong demand for convenience, premium, and specialty product categories, driven by higher disposable incomes and time-constrained lifestyles. Meanwhile, Tier-2 cities like Indore, Jaipur, Coimbatore, Lucknow, and Bhubaneswar are experiencing a rapid surge in online grocery adoption, expanded assortment demand, and rising interest in price-sensitive essential goods. By analysing the Urban vs Tier-2 Grocery Consumption Dataset India, businesses can decode variability in shopping behaviours and seasonal trends.
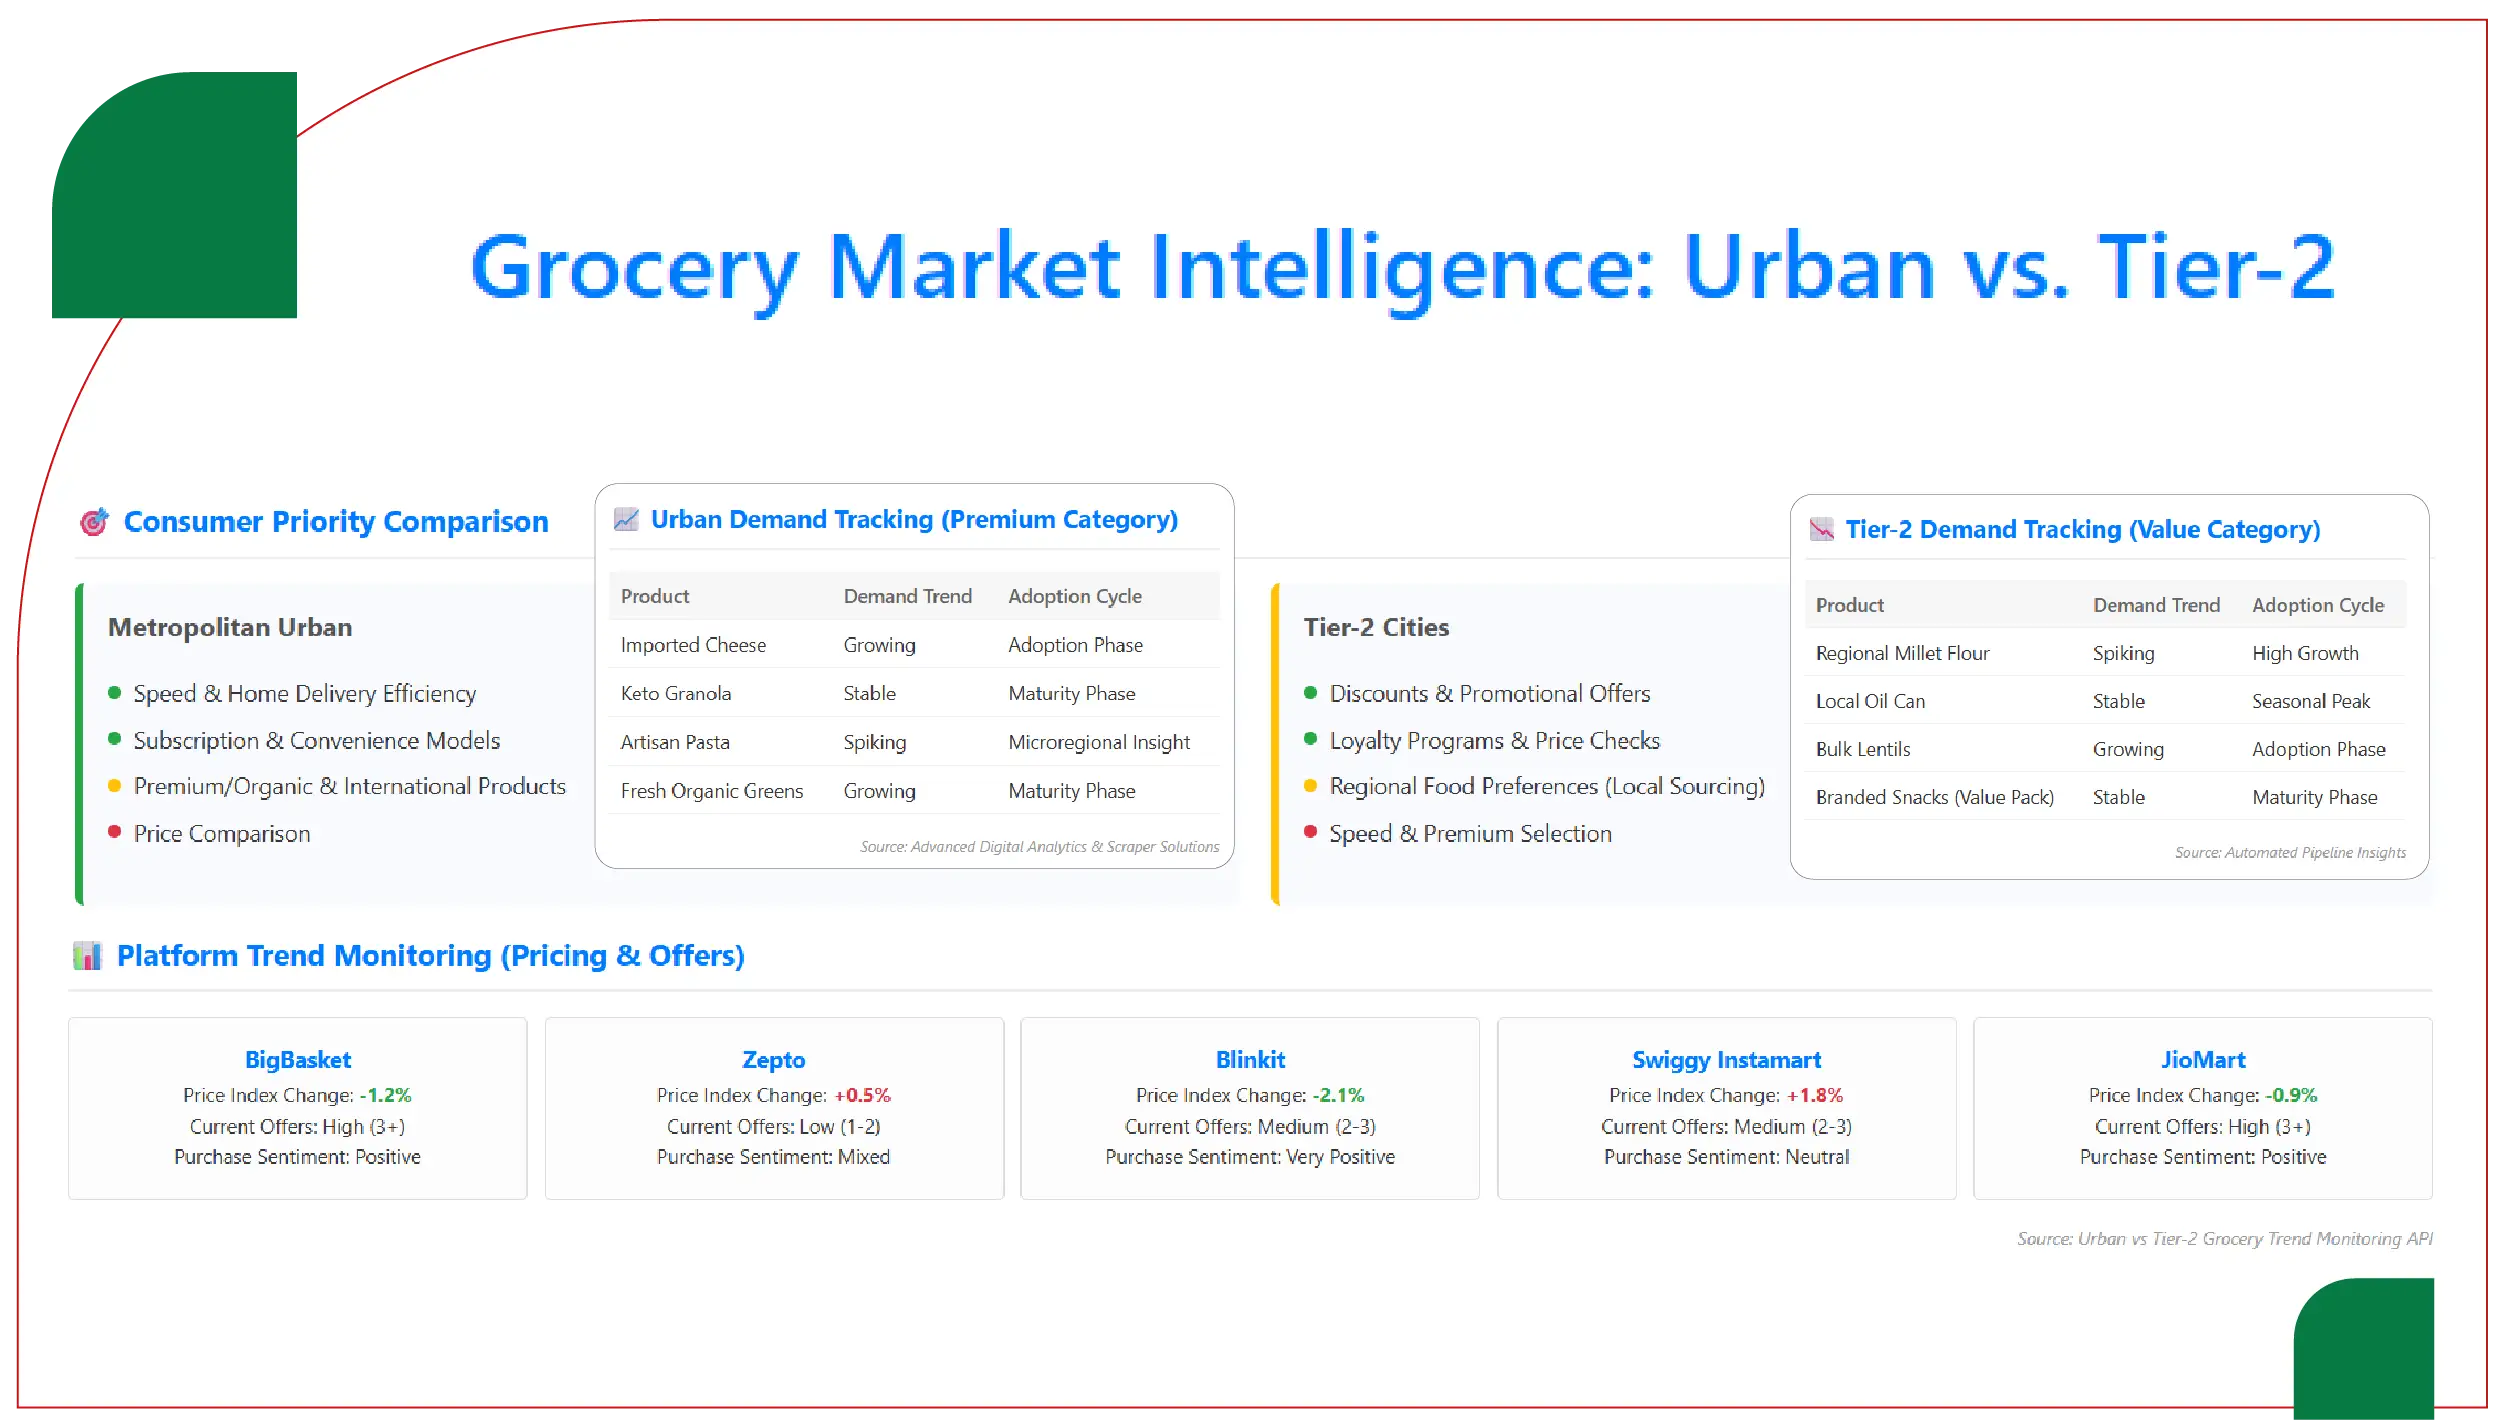
Urban consumers prioritize speed, home delivery efficiency, subscription models, and premium organic and international product offerings. Tier-2 users, in contrast, rely more on discounts, loyalty programs, price comparisons, and regional food preferences.
Advanced digital analytics and scraper-based solutions enable Real-Time Grocery Demand Tracking – Urban & Tier-2 India, allowing category managers and supply chain teams to monitor consumption patterns continuously. Moreover, brands increasingly adopt automated pipelines for Category-Wise Grocery Demand Scraping for Indian Cities, helping identify microregional insights and product adoption cycles.
Technology providers now focus on Urban vs Tier-2 Grocery Trend Monitoring API India, which extracts product availability, pricing changes, offers, and customer purchase sentiment across top grocery delivery platforms like BigBasket, Zepto, Blinkit, Swiggy Instamart, and JioMart.
| Category | Urban Demand Index (Base=100) | Tier-2 Demand Index (Base=100) | Key Insight |
|---|---|---|---|
| Fruits & Vegetables | 135 | 118 | Higher preference for premium organic varieties in Urban cities |
| Dairy & Bakery | 142 | 125 | Tier-2 demand growing due to branded packaged dairy |
| Staples & Grains | 110 | 148 | Higher Tier-2 household consumption volume |
| Snacks & Packaged Foods | 150 | 112 | Urban consumers prefer newer & international variants |
| Frozen & Ready-to-Eat | 160 | 92 | Strong urban convenience-driven demand |
| Beverages & Juices | 143 | 103 | Seasonal spikes higher in metros |
| Health & Organic | 175 | 72 | Emerging category for Tier-2, highly mature in Urban |
| Household Essentials | 130 | 140 | Tier-2 customers prioritize bulk buying & lower prices |
Scraping tools, pricing intelligence systems, and grocery app monitoring pipelines enable digital demand modelling. Solutions such as Urban vs Tier-2 Grocery Demand Data Scraper in India help collect structured category-level and SKU-level information.
Data parameters typically collected include:
These datasets are used to build forecasting models, optimize purchasing, and design promotional campaigns.
| Category | Avg Price Urban (INR) | Avg Price Tier-2 (INR) | Price Difference % | Demand Impact |
|---|---|---|---|---|
| Premium Milk | ₹78 | ₹68 | -12.8% | Tier-2 buyers more price-sensitive |
| Atta (10kg) | ₹410 | ₹360 | -13% | Bulk ordering prevalent in Tier-2 |
| Cold-pressed Oil (1L) | ₹280 | ₹245 | -12.5% | Urban adoption more trend-driven |
| Chips & Packaged Snacks | ₹38 | ₹33 | -13% | Higher urban impulse purchase |
| Bread (400g) | ₹46 | ₹40 | -13% | Tier-2 demand rising for packaged options |
| Instant Noodles | ₹17 | ₹15 | -11.8% | Youth-driven growth in mid-sized cities |
| Frozen Paratha | ₹95 | ₹78 | -17.8% | Convenience product more urban focused |
| Stakeholder | Benefit Derived |
|---|---|
| FMCG Brands | Optimize distribution by consumption geography |
| Retail Chains | Predict demand & reduce stock-out risk |
| Grocery Delivery Apps | Improve pricing intelligence & dynamic discounting |
| Packaging & Supplier Networks | Plan supply loads & logistics |
| Investors & Consultants | Assess emerging retail opportunities |
Companies today rely on structured extraction pipelines and marketplace monitoring systems to automate and optimize data-driven retail strategy. By using Grocery App Data Scraping services, businesses can collect detailed information from multiple grocery delivery platforms, including store-level pricing updates, product availability, discount strategies, and evolving SKU performance trends. These automated pipelines also support regional purchase behaviour analysis, enabling better demand forecasting and improved supply allocation decisions across diverse markets.
In addition, advanced Grocery Delivery Scraping API Services allow organizations to capture fluctuations in order volume, promotional campaign cycles, real-time delivery slot variations, and competitor pricing dynamics with high accuracy.
To strengthen visualization, monitoring, and benchmarking abilities, many enterprises adopt analytical tools such as Grocery Price Dashboard, helping teams compare pricing across locations, improve margin planning, and respond faster to changing consumption trends.
The Indian grocery digital commerce industry is projected to surpass $50 billion by 2027, driven by hyperlocal fulfillment networks and Tier-2 & Tier-3 market expansion. Tier-2 demand is expected to grow at a CAGR of 32% compared to 18% for metros, making geographic segmentation crucial.
AI-driven demand forecasting, real-time trend monitoring APIs, predictive pricing engines, sustainability-focused product preferences, and multi-warehouse intelligent routing will shape the next evolution of grocery retail intelligence.
Cross-regional grocery behaviour in India is evolving at a rapid pace, making data-backed decision-making essential for competitive growth. Companies that effectively analyse category-wise consumption patterns will strengthen forecasting, distribution planning, and market positioning. Intelligent tools like Grocery Price Tracking Dashboard allow retail and FMCG teams to monitor real-time price changes, product availability shifts, and demand fluctuations across cities. By adopting scalable Grocery Pricing Data Intelligence frameworks and leveraging curated datasets from Grocery Store Datasets, organizations can generate actionable insights for different city tiers. This approach enhances resource allocation, improves inventory accuracy, and enables targeted promotions. Ultimately, a strong digital intelligence infrastructure supports smarter competition across both metro regions and rapidly expanding Tier-2 grocery markets.
Are you in need of high-class scraping services? Food Data Scrape should be your first point of call. We are undoubtedly the best in Food Data Aggregator and Mobile Grocery App Scraping service and we render impeccable data insights and analytics for strategic decision-making. With a legacy of excellence as our backbone, we help companies become data-driven, fueling their development. Please take advantage of our tailored solutions that will add value to your business. Contact us today to unlock the value of your data.

