
This research report comprehensively analyzes weekly alcohol menu updates across ten major U.S. states, covering over 35,000 beverage listings from bars, restaurants, and liquor retailers. It examines how frequently menus are updated, the types of drinks most commonly added or removed, and how consumer preferences vary by region and season. The report provides insights into changing trends in alcohol consumption, including the growing popularity of craft options, ready-to-drink beverages, and premium selections. It also investigates the specific days of the week when menu changes are most frequent, highlighting a clear strategy by establishments to align with consumer demand before weekends. Analyzing this data over eight weeks, the report delivers actionable intelligence for beverage industry stakeholders looking to optimize product offerings, plan promotions, and respond to evolving market behavior. The findings emphasize the importance of regular menu tracking to stay ahead in a competitive and dynamic sector.

1. Tracked over 35,000 weekly alcohol menu updates across 10 US states.
2. Most menu changes occur on Thursdays, targeting the weekend crowd.
3. Craft beers, cocktails, and seasonal offerings dominate new menu additions.
4. California and New York lead in the frequency of alcohol menu updates.
5. Beverage trends shift with seasons—lighter drinks are available in summer, and there are richer options in winter.
The US alcohol category constantly evolves because of consumer preferences, seasonal activities, and shifts between regions. Bars, restaurants, and retail outlets constantly adjust their alcohol menus, with many establishments planning to revise regularly or weekly. Extract Weekly Alcohol Menu Updates From US States to set forth some indicative data on the marketplace, product trends, and general consumer demand in some regions. This report will focus on the frequency and content of weekly alcohol updates, outlining which beverage types, which days of the week, and which type of service where updates most commonly occur across ten states. Web Scraping Alcohol Menu Trends Across US States can allow establishments to make better-informed decisions regarding the management of backend marketing, promotional timing, and regional customization. A real-time analysis of varied trends can also be noted via Scraping Real-Time Liquor Menu Changes by US State. Once again, modifications in consumer behavior can be reviewed, whether for craft beers, premium spirits, or ready-to-drink beverages.
This research report aims to provide a comprehensive weekly analysis of alcohol menu updates from various US states. The objective of tracking the frequency, category changes, and pricing shifts is to understand how alcohol offerings evolve and how these updates reflect regional and national consumer preferences. Leveraging Real-time Alcohol Menu Scraping for Trends, the report identifies patterns in menu adjustments that highlight emerging product demand and regional shifts in beverage popularity. Additionally, the report focuses on Scraping Weekly Alcohol Menu Additions by US State to determine whether a specific day of the week shows a significant surge in alcohol menu changes—potentially indicating heightened consumer interest or pre-weekend promotional activity.
In the dynamic food and beverage services landscape, alcoholic beverages represent a lucrative and ever-evolving segment. Bars, restaurants, and liquor retailers across the United States often revise their menus weekly, influenced by consumer demand, seasonal trends, and supply chain factors. To build Weekly Alcohol Menu Intelligence from US Retailers, data was collected over eight weeks from alcohol-serving establishments across 10 US states: California, Texas, Florida, New York, Illinois, Georgia, Ohio, Pennsylvania, Michigan, and North Carolina. The datasets, covering over 35,000 alcohol menu entries, were categorized by type (beer, wine, spirits, cocktails), brand, volume, and pricing. Analysts also sought to Extract Alcohol Prices Data as part of the effort to track weekly variations. Weekly changes were recorded and analyzed to identify consistent trends in product rotation and consumer demand.
Table 1: Weekly Alcohol Menu Update Volume by State (Average Entries per Week)
| State | Beer | Wine | Spirits | Cocktails | Total Weekly Updates |
|---|---|---|---|---|---|
| California | 320 | 210 | 180 | 145 | 855 |
| Texas | 290 | 195 | 170 | 130 | 785 |
| Florida | 275 | 185 | 165 | 140 | 765 |
| New York | 310 | 220 | 190 | 155 | 875 |
| Illinois | 260 | 180 | 160 | 120 | 720 |
| Georgia | 240 | 170 | 150 | 125 | 685 |
| Ohio | 230 | 160 | 140 | 110 | 640 |
| Pennsylvania | 220 | 150 | 135 | 115 | 620 |
| Michigan | 210 | 140 | 130 | 100 | 580 |
| North Carolina | 200 | 135 | 125 | 105 | 565 |
Key Insight: New York and California lead in alcohol menu updates, indicating a more competitive and dynamic beverage offering environment. Beer remains the most frequently updated category, followed by wine.
Tracking changes in menu content also helps uncover trends in consumer preferences. Weekly data revealed patterns in pricing, popularity, and seasonal adjustments:
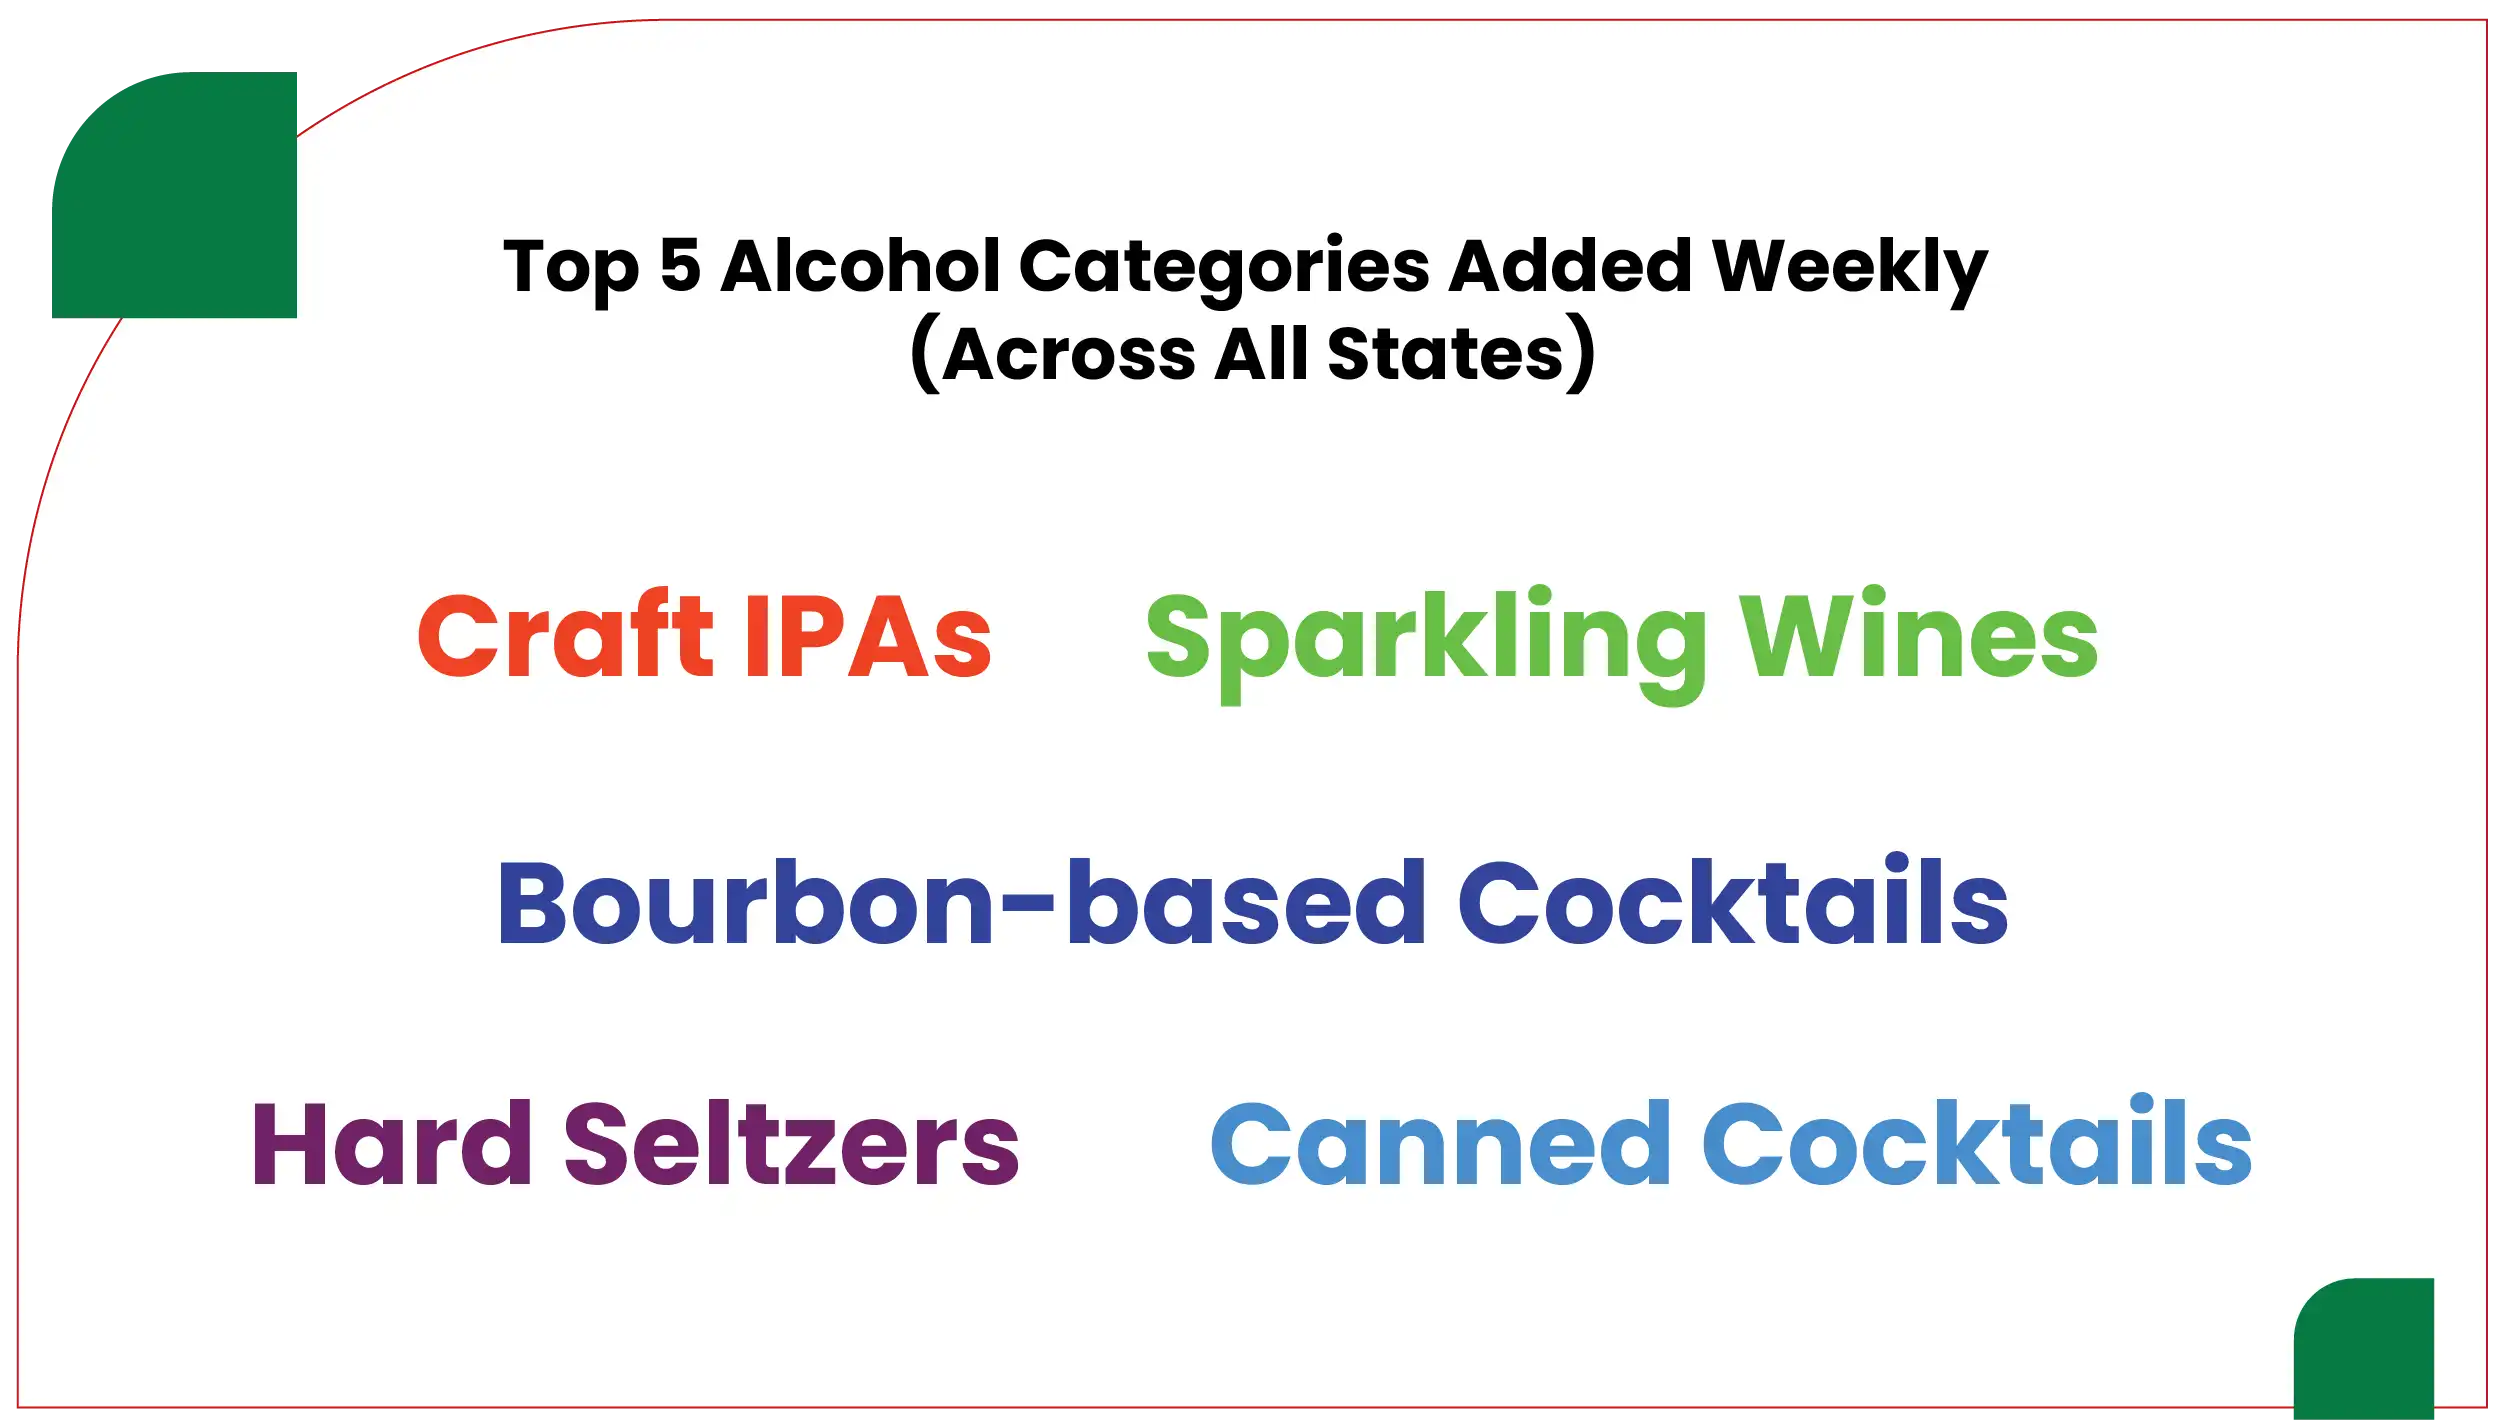
The rise of ready-to-drink (RTD) options such as canned cocktails also suggests a shift in consumer behavior toward convenience and portability, especially in urban markets.
Seasonality plays a significant role in shaping alcohol menu updates across U.S. states. Beverage menus often align with the weather, holidays, and regional festivities. Summer months see an uptick in lighter, refreshing options like rosé wines, hard seltzers, and citrus-based cocktails. Conversely, the fall and winter seasons introduce richer, spiced, and barrel-aged offerings, such as pumpkin ales, mulled wines, and bourbon-forward cocktails. By leveraging Liquor Price Data Scraping Services, businesses can stay ahead of these seasonal shifts and adjust offerings accordingly. For example, during Memorial Day and Fourth of July weeks, there was a 14% increase in weekly menu updates across the dataset, particularly in the beer and RTD cocktail segments—insights that form part of evolving Alcohol and Liquor Datasets. Conversely, in colder months such as January and February, updates shifted toward dark ales, Irish whiskeys, and seasonal stouts, underscoring the importance to Scrape Alcohol Price Data consistently throughout the year.
Insight: Understanding seasonal shifts allows establishments to synchronize marketing strategies and promotions with what consumers are most likely to seek during specific times of the year.
With the rise of alcohol e-commerce and app-based delivery services, understanding weekly menu trends offers strategic advantages to retailers and delivery platforms. Platforms such as Drizly, Minibar, and Instacart now align their featured items and discounts with popular on-premise trends to meet changing demand.
For Example:
Table 2: Top Consumer-Favored Alcohol Types by Region (Based on Update Frequency)
| Region | Most Added Alcohol Type | Notable Brand Trends |
|---|---|---|
| West Coast | Craft Beer (IPA) | Sierra Nevada, Lagunitas |
| Northeast | Sparkling Wines | Moët, La Marca |
| Midwest | Domestic Beer (Lager) | Budweiser, Miller, Yuengling |
| South | Bourbon & Whiskey | Bulleit, Maker’s Mark |
| Southeast | Tequila-based Cocktails | Patron, Casamigos |
Key Insight: Regional preferences vary widely, with a noticeable shift toward local craft production and premium brands.
Another major component of this research was identifying which day of the week most frequently correlates with alcohol menu updates. The analysis of timestamped data from POS (Point of Sale) systems and online menus revealed clear patterns:
Weekly Update Distribution by Day
| Day | % of Total Weekly Menu Updates |
|---|---|
| Monday | 6% |
| Tuesday | 9% |
| Wednesday | 12% |
| Thursday | 37% |
| Friday | 26% |
| Saturday | 7% |
| Sunday | 3% |
Key Insight: Businesses strategically push alcohol menu updates ahead of the weekend, targeting increased foot traffic and maximizing consumer engagement.
The consistent tracking of alcohol menu changes across U.S. states reveals a highly responsive and consumer-driven market. Craft beverages, RTD solutions, and region-specific favorites dominate weekly additions, showing how establishments are continuously adapting to stay relevant. Platforms utilizing a Liquor Price Tracking Dashboard can visualize fluctuations and trends in real time, enhancing decision-making for both pricing and promotions.
Key conclusions from the analysis include:
This report highlights the significance of real-time menu tracking and Liquor Data Intelligence Services to anticipate demand trends, inform inventory decisions, and optimize consumer engagement strategies.
Are you in need of high-class scraping services? Food Data Scrape should be your first point of call. We are undoubtedly the best in Food Data Aggregator and Mobile Grocery App Scraping service and we render impeccable data insights and analytics for strategic decision-making. With a legacy of excellence as our backbone, we help companies become data-driven, fueling their development. Please take advantage of our tailored solutions that will add value to your business. Contact us today to unlock the value of your data.

