Introduction
Ward 2 covers Georgetown, Foggy Bottom, and Dupont Circle: median household income $128,000, four full-service grocery stores within a half-mile radius. Ward 8 covers Congress Heights, Anacostia, and Bellevue: median household income $36,000, two grocery stores serving 78,000 residents across a territory where food insecurity reaches 28%. Giant Food operates across both ends of that spectrum. Its Flexible Rewards member price on a 2lb boneless chicken breast in Ward 2: $6.49. The same SKU, same week, same chain, at the Giant Food in Ward 7s Fort Dupont: $6.99. The shelf-to-member price discount depth: 32% in Ward 2, 21% in Ward 8. The Giant Food Washington DC ward price data 2026 dataset captures that gradient — 8 wards, 20-plus stores, one chain — and produces the most politically charged grocery price dataset in any American city.
DCs status as the nations capital amplifies the commercial and policy significance of every Giant Food data point. Food pricing in Americas capital city is a federal policy argument. It appears in Congressional testimony on food assistance programmes. It informs DC Council health equity legislation. It surfaces in White House food policy briefs prepared by the Office of Science and Technology Policy. The DC grocery scraping guide that produces ward-level price stratification data from Giant Foods 20-plus DC locations creates an intelligence asset that simultaneously serves CPG brands, food equity researchers, DC government agencies, and national food policy institutions. Food Data Scrape built the DC pipeline with ward_number, income_zone, food_desert_flag, and flexible_rewards_discount_pct fields from the first collection run — because the policy research use case requires that granularity from day one.
DCs Eight Wards — Grocery Geography as Economic Geography
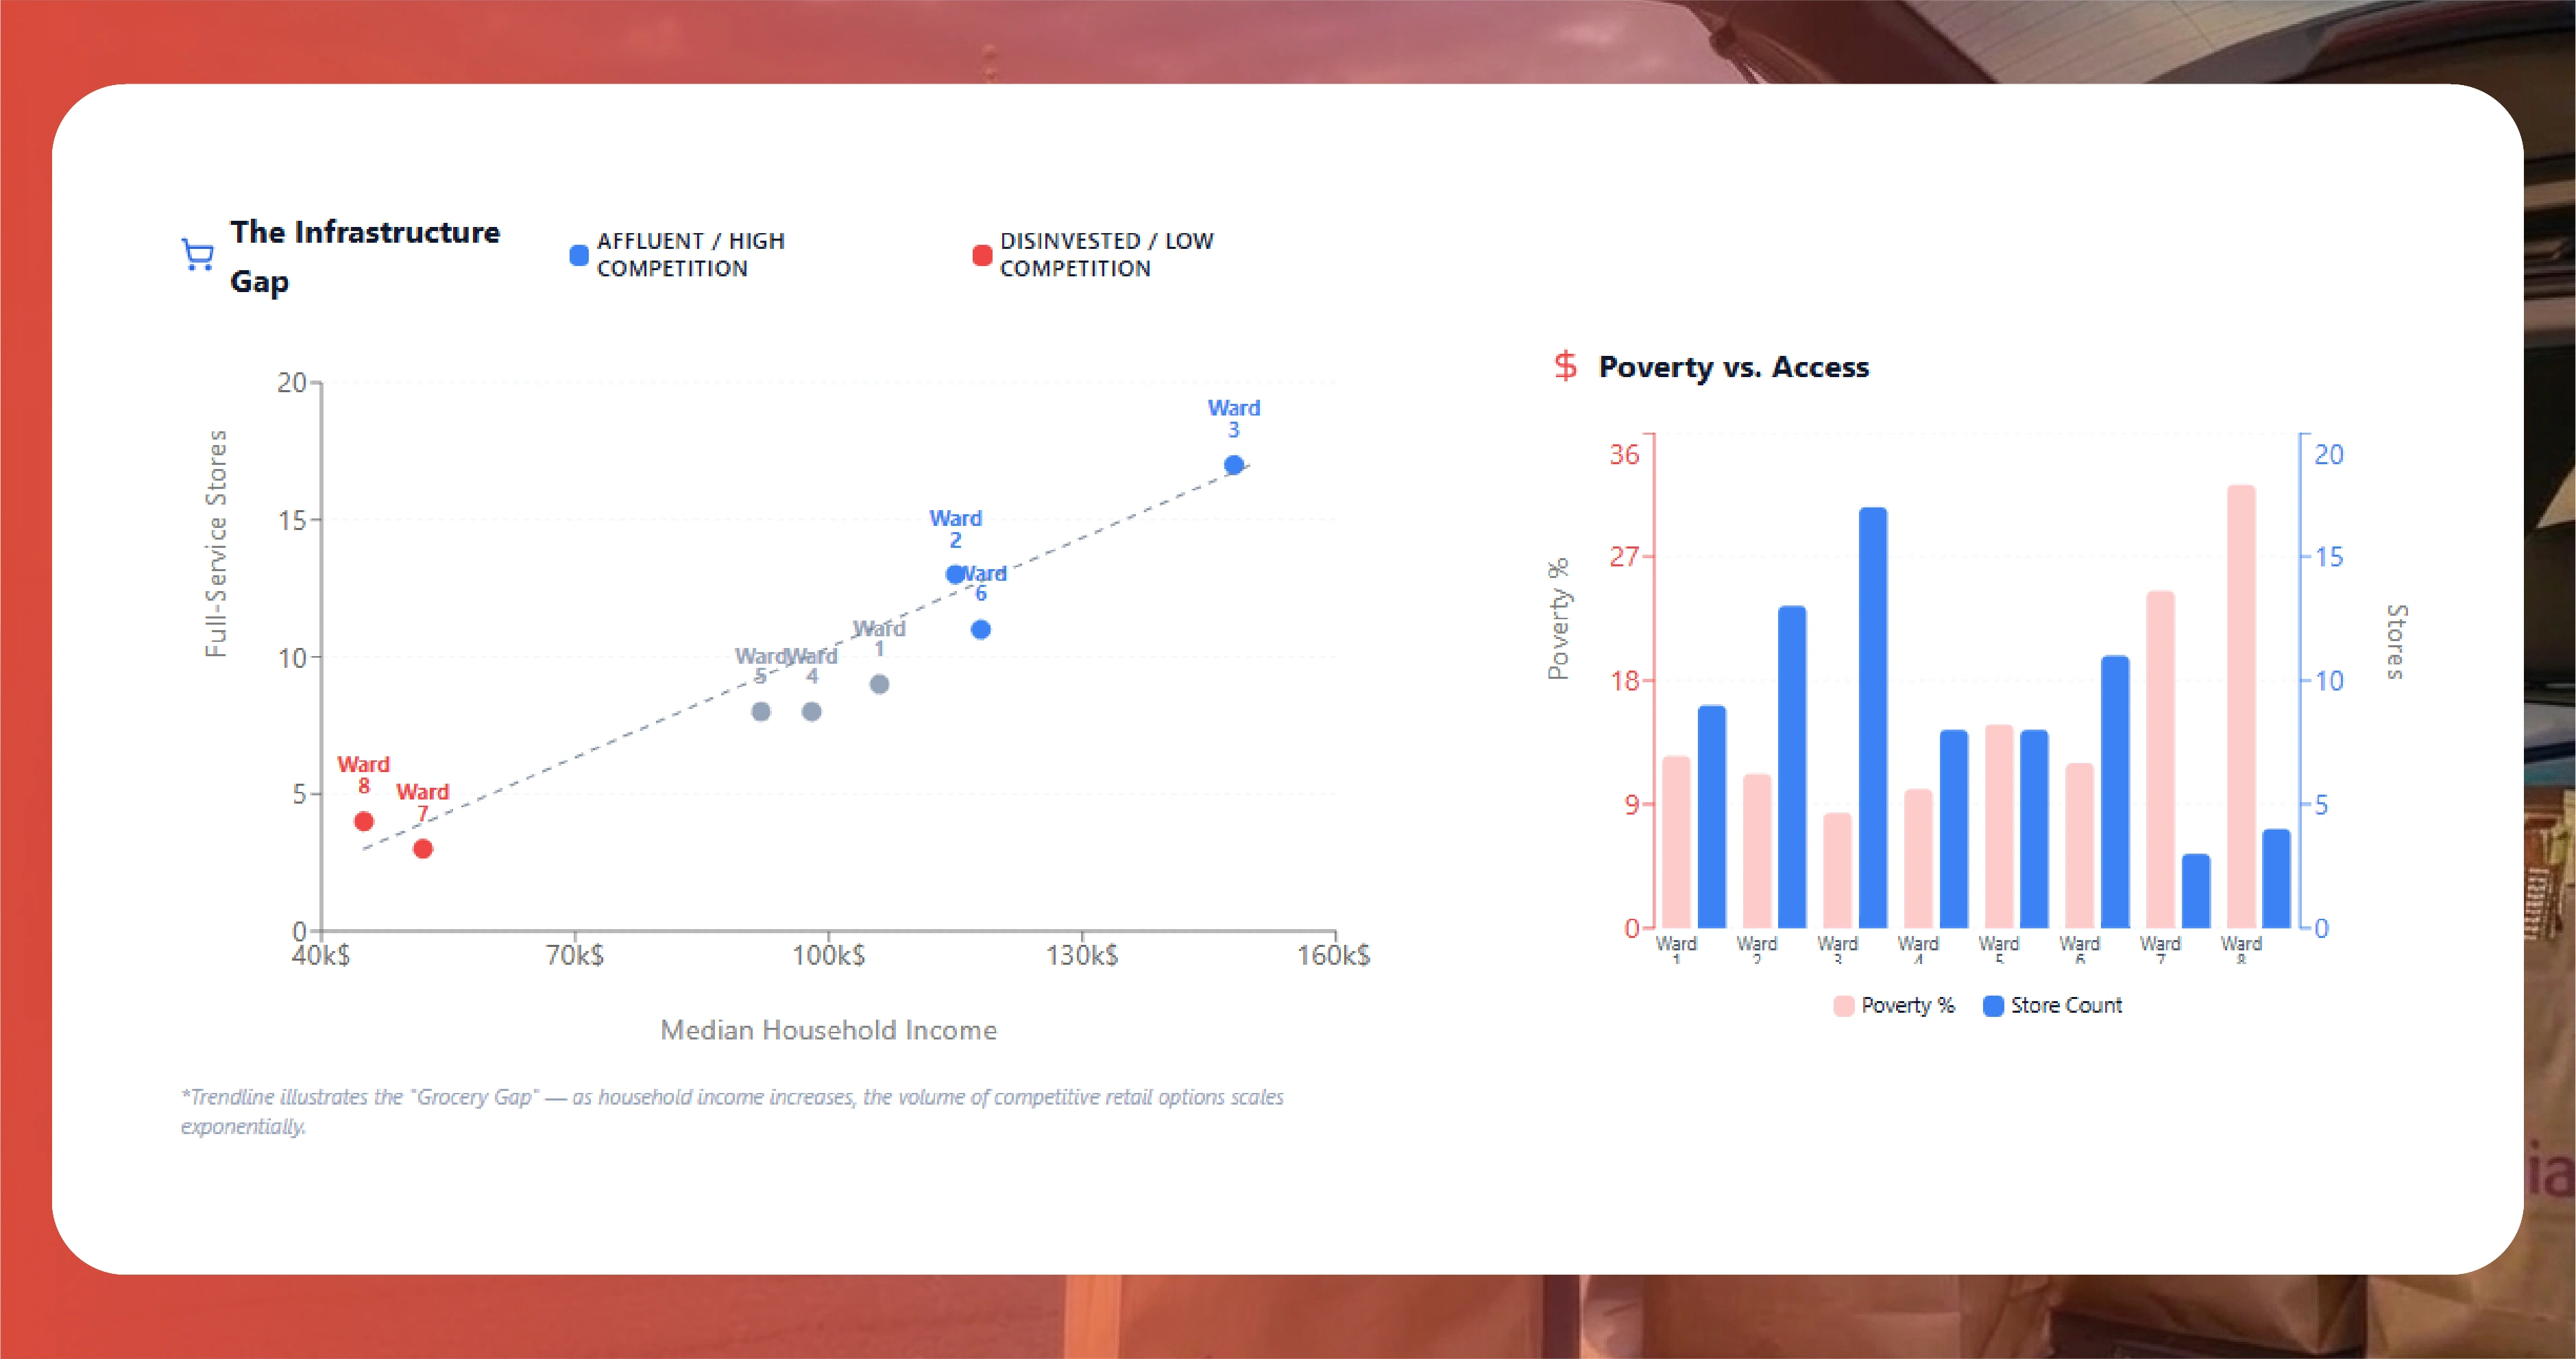
The eight DC wards are not administrative abstractions. They are the physical expression of a city that has remained persistently economically segregated despite decades of federal investment and one of the nations highest municipal per-capita incomes. The Northwest quadrant — Wards 2 and 3 — contains DCs highest-income neighbourhoods: Georgetown, Cleveland Park, American University Park, Chevy Chase DC. The Southeast and East of the Anacostia River quadrant — Wards 7 and 8 — contains DCs highest poverty rates and lowest grocery access scores. Giant Foods store footprint spans both poles, operating full-service supermarkets in Georgetown-adjacent Ward 2 and in the East of Anacostia Ward 8 communities that the Grocery Manufacturers Association has repeatedly cited in food desert research.
The Flexible Rewards deal structure varies by ward in ways that follow competitive pressure rather than income. Ward 2 and Ward 3 Giant Food locations face direct competition from Whole Foods (three DC locations), Trader Joes (two DC locations), and a Safeway that also adjusts its Safeway for U deals in response to Giant Foods Flexible Rewards pricing. The scrape Giant Food prices Washington DC pipeline that captures both Giant Food and Safeway concurrently in the same ward ZIP codes produces the bilateral competitive benchmark that DC CPG brands need — specifically, who runs the deeper loyalty deal first in a given promotional week.
Ward 8s grocery competitive structure is dramatically different. No Whole Foods. No Trader Joes. One Giant Food, one smaller Safeway at Skyland Town Center, and a Lidl that opened in 2024 as the neighbourhoods first hard discounter. The Giant Food DC data scraper 2026 that covers Ward 8 alongside Ward 2 in the same collection captures what competitive-pressure-free grocery pricing looks like in a city where the politically observable disparity between affluent and low-income neighbourhoods has been a matter of legislative record for three DC Council administrations.
Washington DC Ward Coverage — Store Distribution and Food Equity Data Value
| Ward | Key Neighbourhoods | Median HHI | Giant Food Stores | Primary Competitors | Data Intelligence Value |
|---|---|---|---|---|---|
| Ward 1 | Columbia Heights, Mount Pleasant, Adams Morgan | $72K–$88K | 1 (Columbia Heights) | Safeway, Trader Joes 14th St | Urban diverse — gentrifying corridor, Flexible Rewards deal engagement tracking |
| Ward 2 | Georgetown, Dupont, Foggy Bottom | $118K–$145K | 1 (Georgetown) | Whole Foods, Trader Joes, Yes! Organic | Premium northwest — deepest Flexible Rewards deal, Whole Foods bilateral benchmark |
| Ward 3 | Chevy Chase DC, Cleveland Park | $128K–$165K | 2 (Tenleytown + Wisconsin Ave) | Whole Foods Tenley, Trader Joes | Affluent northwest — organic demand high, Giant Food vs Whole Foods price gap data |
| Ward 5 | Brookland, Michigan Park, Brentwood | $62K–$82K | 1 (Rhode Island Ave) | Safeway, Aldi | Northeast corridor — mid-market, Safeway bilateral benchmark, growing Latino market |
| Ward 6 | Capitol Hill, Navy Yard, NoMa | $92K–$115K | 1 (Capitol Hill) | Trader Joes, Whole Foods NoMa | Federal worker corridor — professional shopper, premium basket data |
| Ward 7 | Deanwood, Fort Dupont, Marshall Heights | $44K–$58K | 1 (Benning Rd) | Safeway, Aldi (limited) | East of Anacostia — below-average Flexible Rewards depth, food access research anchor |
| Ward 8 | Congress Heights, Anacostia, Bellevue | $32K–$46K | 1 (Alabama Ave) | Lidl, Safeway Skyland | Lowest-income DC — 28% food insecurity rate, highest policy significance, Lidl reference |
Sample Giant Food Washington DC Ward-Level Data Records — 2026
The records below show the same SKUs priced across four DC wards — shelf price, Flexible Rewards member price, and ward_number. The 15% basket gradient from Ward 2 to Ward 8 is the core dataset value.
| Product | Category | Ward | ZIP | Shelf $ | Flex Rewards $ | Disc % | Food Insecurity % |
|---|---|---|---|---|---|---|---|
| Chicken Breast Boneless 2lb | Meat | Ward 2 | 20037 | $9.29 | $6.49 | 30.1% | 4% |
| Chicken Breast Boneless 2lb | Meat | Ward 6 | 20003 | $9.29 | $6.79 | 26.9% | 8% |
| Chicken Breast Boneless 2lb | Meat | Ward 7 | 20019 | $9.29 | $6.99 | 24.8% | 18% |
| Chicken Breast Boneless 2lb | Meat | Ward 8 | 20032 | $9.29 | $7.29 | 21.5% | 28% |
| Ground Beef 80/20 1lb | Meat | Ward 2 | 20007 | $7.49 | $5.29 | 29.4% | 4% |
| Ground Beef 80/20 1lb | Meat | Ward 8 | 20032 | $7.29 | $5.99 | 17.8% | 28% |
| Whole Milk 1 Gal | Dairy | Ward 3 | 20016 | $4.49 | $3.29 | 26.7% | 3% |
| Whole Milk 1 Gal | Dairy | Ward 7 | 20019 | $4.29 | $3.49 | 18.6% | 18% |
| Org Baby Spinach 5oz | Produce | Ward 2 | 20009 | $3.99 | $2.79 | 30.1% | 4% |
| Large Eggs 12ct | Dairy | Ward 8 | 20032 | $3.99 | $3.19 | 20.1% | 28% |
Sample JSON Record — Giant Food Ward 8 Congress Heights DC
  {
  "product_name": "Chicken Breast Boneless 2lb",
  "banner_type": "Giant Food",
  "store_city": "Washington",
  "store_state": "DC",
  "store_zip": "20032",
  "ward_number": 8,
  "neighbourhood": "Congress Heights",
  "income_zone": "low",
  "category": "Meat & Seafood",
  "shelf_price_usd": 9.29,
  "flexible_rewards_price_usd": 7.29,
  "flexible_rewards_discount_pct": 21.5,
  "ward2_baseline_rewards": 6.49,
  "intra_city_rewards_gap_usd": 0.80,
  "food_insecurity_rate_pct": 28.0,
  "food_desert_flag": true,
  "scraped_at": "2026-03-20T09:30:00Z",
  "pipeline_store_id": "gf-ward8-dc-20032",
  "data_provider": "Food Data Scrape"
}
Giant Food DC Dataset Types — 2026
| Dataset | Format | Refresh | Best For |
|---|---|---|---|
| Giant Food DC Full Ward Catalogue | CSV / JSON | Weekly | All DC stores — ward_number, food_insecurity_rate_pct, intra_city_rewards_gap_usd fields |
| DC Ward Grocery Price Dataset | CSV / Parquet | Weekly | Same-SKU pricing across all 8 DC wards — shelf and Flexible Rewards by ward |
| Giant Food DC Flexible Rewards Dataset | JSON / CSV | Weekly | Flexible Rewards deal depth by ward — Ward 2 premium vs Ward 8 shallow gradient |
| Giant Food Safeway Washington DC Price Comparison | CSV / Parquet | Weekly | Giant Food Flexible Rewards vs Safeway for U — bilateral DC loyalty programme benchmark |
| DC Ward Food Access Price Data 2026 | CSV | Weekly | Food desert adjacent store pricing — Ward 7 and Ward 8 food insecurity zone data |
| Giant Food DC Weekly Circular Dataset | JSON / CSV | Weekly | Wednesday Giant Food + Safeway circular — DC competitive deal response weekly |
| Washington DC Grocery Equity Benchmark Data | CSV / Parquet | Monthly | Ward-level Flexible Rewards depth gradient — 52-week DC grocery equity tracking |
Giant Food Washington DC API Configuration — 2026
Giant Food operates on giantfood.com with Flexible Rewards authentication for member pricing. The Giant Food Washington DC API 2026 requires an authenticated Flexible Rewards account to return deal prices — unauthenticated search returns shelf prices only, missing the loyalty programme data that defines the ward-level discount gradient.
The Giant Food DC store locator API returns all DC and Maryland store IDs — filter to 200xx Washington DC ZIP codes for the intra-city ward comparison. The DC grocery data API configuration should initialise with Ward 2 (20007 Georgetown) and Ward 8 (20032 Congress Heights) as the two poles of the DC price gradient — the intra_city_rewards_gap_usd field calculated from these two store IDs in the same collection run produces the single most policy-relevant grocery pricing metric in Washington DC. The Giant Food Flexible Rewards API DC session expires in 7 days. The Washington DC grocery price feed API 2026 built on Giant Foods DC architecture, enriched with concurrent Safeway collection, delivers the bilateral competitive benchmark. The DC ward grocery competitive API covers Giant Food and Safeway across all DC ward ZIP codes. The Giant Food DC product data API 2026 serves full catalogue data with ward_number and food_insecurity_rate_pct fields applied from the DC Health Department ward data lookup.
| Endpoint | Method | Returns | Auth |
|---|---|---|---|
| Product Search | GET | DC ward store catalogue with shelf and Flexible Rewards prices | Flex Rewards login |
| Weekly Ad Feed | GET | Wednesday circular — DC stores by ward cluster | None |
| Store Locator | GET | All Giant Food DC locations — filter to 200xx DC ZIP codes | None |
| Flexible Rewards Deals | GET | Member price listings — ward-specific deal depth variation | Flex Rewards login |
| Price by Store ID | GET | Shelf and Rewards comparison — Ward 2 vs Ward 8 gradient | None |
| Delivery / Curbside | GET | Slot availability — Ward 2 and Ward 3 stores fill fastest | Session |
Stack and Configuration — Washington DC 2026
Eight Ward Store IDs — Ward-Level Collection Architecture
The ward-level Giant Food DC dataset requires one store ID per occupied ward — Wards 1, 2, 3, 5, 6, 7, and 8 each have at least one Giant Food location. Configure ward-matched DC residential IPs for each store ID: 20009 (Ward 1), 20007 (Ward 2), 20016 (Ward 3), 20010 (Ward 5), 20003 (Ward 6), 20019 (Ward 7), 20032 (Ward 8). Running all seven store IDs produces the full DC ward price gradient from a single Wednesday Airflow run — including the intra_city_rewards_gap_usd between Ward 2s $6.49 and Ward 8s $7.29 on the same chicken breast, the single-number measure of DC grocery pricing inequality.
Apply DC Health Department Food Insecurity Data
The DC ward food access price data 2026 gains policy research value when each record is tagged with food_insecurity_rate_pct from DC Health Department ward-level food security data. Build a ward_lookup table mapping DC ward numbers to their annual food insecurity rates — updated from DCs Vital Signs data publication. Apply food_insecurity_rate_pct and food_desert_flag from the USDA Food Access Research Atlas at collection time. Ward 7 and Ward 8 records with food_desert_flag: true and food_insecurity_rate_pct above 20% constitute the most policy-relevant grocery price records in the dataset.
Safeway Concurrent Collection — DCs Bilateral Benchmark
Run Safeway collection concurrently on the same Wednesday timing — Safeway for U deals release Wednesday alongside Giant Foods Flexible Rewards circular. Use Safeways 200xx DC store IDs matched to the same wards as the Giant Food collection. The Giant Food Safeway Washington DC price comparison built from same-ward concurrent collection produces the bilateral loyalty programme deal comparison that DC CPG brands need — specifically, which chain runs the deeper loyalty deal on each staples category in each DC ward in a given week. Use DC residential IPs matched to each ward for both chain collection runs.
DC Ward Proxy Configuration
Use ward-matched DC residential IPs for the collection nodes. A general Washington DC IP will sometimes return downtown commercial clusters rather than the ward-specific Giant Food stores that define the DC grocery equity gradient.
Who Builds the DC Dataset and Why
DC food policy researchers and federal government food security analysts use the Giant Food Washington DC grocery dataset 2026 as the ward-level grocery price evidence base for Washingtons most persistent policy challenge: the coexistence of Americas highest per-capita municipal income with some of its most severe urban food insecurity in the same city. The intra_city_rewards_gap_usd field — $0.80 difference per chicken breast between Ward 2 and Ward 8 on the same chains loyalty programme — is a single-number measure of grocery pricing inequality that policy research groups have rarely been able to calculate from a clean, consistently collected weekly data series.
CPG brands selling into Giant Food use the DC ward-level data to understand how Flexible Rewards deal performance varies across DCs radically different income geographies. A brand running a Giant Food Flexible Rewards promotion expects to drive trial across the full DC network — but the 8.6-percentage-point Flexible Rewards discount depth gap between Ward 2 and Ward 8 means the effective promotional price varies by $0.40–$0.80 per item depending on which DC ward the shopper lives in. That geographic promotional variability is invisible in aggregate DC Giant Food data and only visible in ward-level collection.
DC Council food equity staff and the DC Department of Health use the Giant Food ward pricing data to track progress (or lack of it) on grocery equity initiatives. DCs Healthy Corners programme, its DC Central Kitchen partnerships, and the Ward 7 and Ward 8 grocery access grants all require evidence-based monitoring of whether grocery pricing in underserved DC wards is improving relative to affluent ward benchmarks. The weekly ward-level Giant Food price series — with food_insecurity_rate_pct and Flexible Rewards gap fields — provides that monitoring infrastructure.
Final Thoughts
Washington DC is the only US city where grocery pricing data is simultaneously a commercial intelligence product and a federal policy argument. Giant Foods ward-level Flexible Rewards gap — 30% discount depth in Ward 2, 21% in Ward 8 — quantifies a grocery pricing inequality that plays out against the backdrop of Congress, the DC Council, and a federal food policy apparatus that is located 3 miles from the Ward 8 Giant Food that produces its most politically significant grocery data point.
Build the pipeline with seven ward-matched DC store IDs, ward_number and food_insecurity_rate_pct fields from the DC Health Department data lookup applied at collection time, Safeway concurrent collection on Wednesday 9:30am EST, intra_city_rewards_gap_usd calculated as Ward 2 baseline minus other ward prices, and ward-matched DC residential IPs. That configuration produces both a commercial grocery intelligence product and a food equity monitoring tool from the same weekly run.
Food Data Scrape delivers the complete Giant Food Washington DC ward price data 2026 infrastructure — DC ward data lookup integration, food insecurity flag application, Flexible Rewards session management, concurrent Safeway collection, Giant Food Washington DC API 2026 configuration, and pre-compiled DC ward grocery price dataset and Washington DC grocery equity benchmark datasets in CSV, JSON, and Parquet.

