The Brief: Global Decisions Need Global Data
The client — a multinational FMCG ingredient supplier with restaurant-channel sales in more than 70 countries — faced a planning problem that single-country data could not solve. Their global sales-team allocation, regional pricing strategy, and category-investment prioritization all depended on a comparable view of restaurant markets across every country they served. They could not afford to invest sales-team capacity in markets where restaurant growth was stagnating, nor could they afford to under-invest where growth was accelerating.
The challenge was harmonization. Restaurant data exists in every country, but rarely in a form that supports cross-country comparison. A French restaurant listed on a French aggregator carries different metadata, in a different language, with different cuisine classifications and pricing structures than a Brazilian restaurant listed on a local platform. Bringing these disparate sources together into a single, comparable dataset is a significant data engineering challenge—one that most internal teams and generalist data providers have not solved at scale.
Standard sources fell short. Single-country research firms offered local depth but lacked global comparability, while international market reports provided country-level aggregates without merchant-level visibility. The client required a multi-country restaurant database that could power both Restaurant Data Intelligence and Food Delivery Intelligence initiatives. This meant creating a unified data layer across every market with standardized cuisine taxonomies, currency normalization, multilingual processing, merchant-level resolution, and a consistent refresh cadence. The result was a globally harmonized restaurant intelligence platform capable of supporting cross-country benchmarking, competitive analysis, market expansion planning, and food delivery ecosystem research.
Methodology: How the Multi-Country Database Was Built

The database rested on a country-by-country aggregation and global-layer harmonization methodology specifically designed for cross-country comparability.
- Country-by-country source aggregation. For each covered country, the most authoritative public restaurant listings, dominant delivery platforms (different per country — Talabat in UAE, DoorDash and Uber Eats in Canada, iFood in Brazil, Glovo across multiple markets, etc.), and mapping service data were combined. Country-specific source mixes were calibrated by local market analysts.
- Language handling. Listings appear in Arabic, English, French, Spanish, Portuguese, Chinese, Japanese, Korean, German, Italian, Turkish, and many other languages depending on country. The parsing layer handled each major language and normalized brand and dish names so the same merchant chain (e.g., a global QSR brand) was recognizable across markets.
- Currency normalization. Records were stored in local currency with a parallel USD equivalent computed at period-average exchange rates. Both currencies are retained for cross-country comparisons.
- Cuisine harmonization. Each country has its own cuisine taxonomy norms. A global harmonization layer mapped country-specific cuisine labels into a single comparable taxonomy covering global, regional, and country-specific cuisine categories. Country-specific cuisines (e.g., Emirati, Quebecois, Levantine) were preserved as sub-categories within the harmonized parent.
- Cross-country chain attribution. Global QSR and casual-dining chains operate in multiple countries. The methodology matched chain locations across countries to a single canonical chain entity, allowing the client to see, for example, McDonald's footprint across all 50-plus covered countries in one view.
- Refresh cadence. Top-velocity merchants and chain locations refreshed weekly; long-tail country-specific merchants refreshed monthly. New launches and closures triggered near-real-time updates where signal strength allowed.
- Quality assurance. Every record passed schema validation, language-aware merchant disambiguation, currency normalization, cuisine harmonization audit, and outlier detection before reaching client systems.
Sample Data: What the Database Captured
The following sample tables illustrate the structure and depth of the Global Restaurant Database.
Sample 1: Restaurant Density by Region
| Region | Countries Covered | Total Outlets | Top Country |
|---|---|---|---|
| North America | Canada + USA + Mexico | 580,000+ | USA |
| Middle East | UAE + KSA + Kuwait + Qatar + Bahrain + Oman | 92,000 | UAE |
| Western Europe | UK, France, Germany, Italy, Spain, NL, Belgium | 460,000 | Italy |
| Southeast Asia | Singapore, Malaysia, Thailand, Indonesia, Vietnam, PH | 380,000 | Indonesia |
| East Asia | Japan, S. Korea, Hong Kong, Taiwan | 290,000 | Japan |
| Latin America | Brazil, Mexico, Argentina, Chile, Colombia | 310,000 | Brazil |
| ANZ | Australia, NZ | 95,000 | Australia |
| South Asia | India, Sri Lanka, Bangladesh | 220,000 | India |
Sample 2: UAE City-Level Density Sample
| Emirate / City | Outlets | Chain Share | Top Cuisine |
|---|---|---|---|
| Dubai | 14,800 | 41% | Levantine / Middle Eastern |
| Abu Dhabi | 5,600 | 39% | Emirati / Middle Eastern |
| Sharjah | 3,200 | 36% | Indian / Pakistani |
| Ajman | 1,400 | 34% | Indian / Levantine |
| Ras Al Khaimah | 980 | 33% | Middle Eastern |
| Fujairah | 620 | 32% | Middle Eastern |
Sample 3: Canada Province-Level Density Sample
| Province | Outlets | Chain Share | Top Non-Local Cuisine |
|---|---|---|---|
| Ontario | 38,400 | 38% | Italian |
| Quebec | 24,800 | 36% | Italian / French |
| British Columbia | 21,200 | 37% | Asian Fusion |
| Alberta | 14,900 | 40% | Italian |
| Manitoba | 4,800 | 41% | Italian |
| Saskatchewan | 3,200 | 42% | Italian |
| Nova Scotia | 3,400 | 38% | Italian |
Sample 4: Cross-Country Pricing — Equivalent Dish (Beef Burger Combo, USD)
| Country | Average Price USD | Region |
|---|---|---|
| Switzerland | $18.40 | W. Europe |
| Norway | $16.80 | N. Europe |
| Canada | $13.20 | N. America |
| UAE | $12.40 | Middle East |
| UK | $11.90 | W. Europe |
| Australia | $11.50 | ANZ |
| Japan | $9.80 | E. Asia |
| Brazil | $7.40 | LATAM |
| Mexico | $6.90 | LATAM |
| Vietnam | $4.85 | SE Asia |
| India | $4.20 | S. Asia |
Sample 5: Global Chain Footprint Sample (Top 5 Chains by Country Count)
| Chain | Countries Present | Total Outlets in Dataset |
|---|---|---|
| McDonald's | 50+ | 38,400 |
| Starbucks | 48 | 28,900 |
| KFC | 46 | 19,800 |
| Subway | 44 | 27,600 |
| Pizza Hut | 42 | 14,200 |
These tables represent a small slice of the full global dataset, which captured outlet, chain attribution, menu, multi-currency pricing, and cuisine detail across more than 50 countries and millions of restaurants.
Key Findings
The database surfaced several findings that directly shaped the client's global sales-priority strategy.
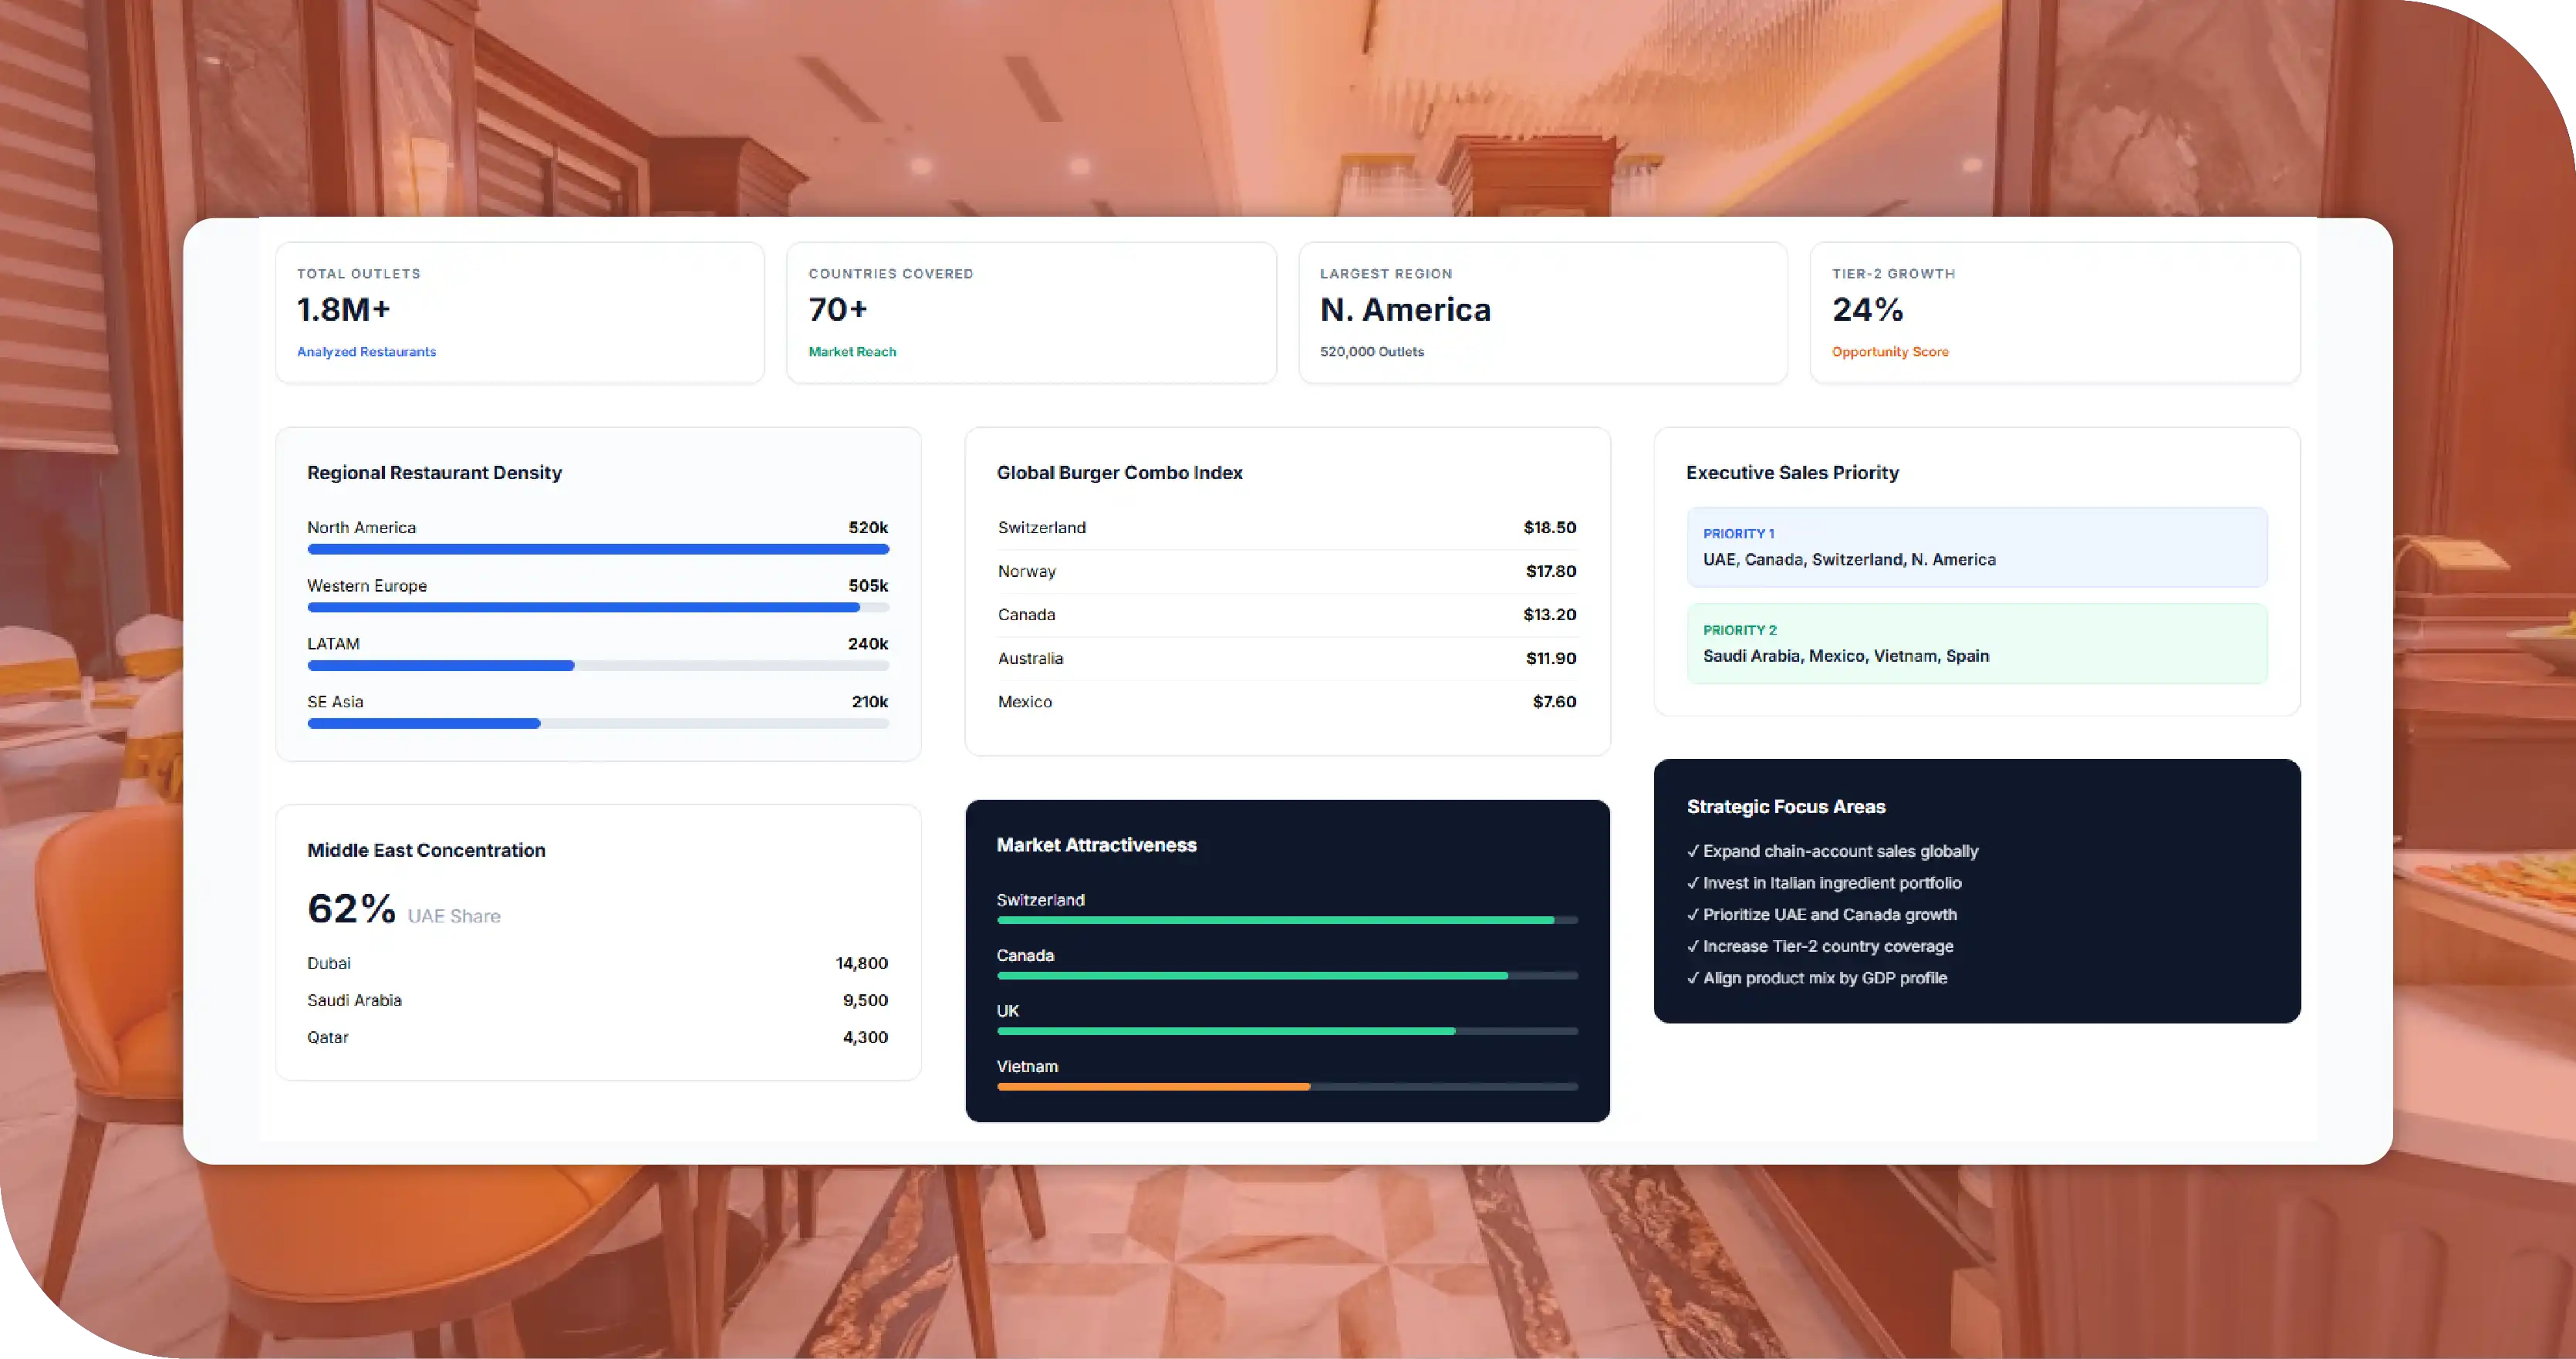
- Restaurant density is highly uneven across regions : North America and Western Europe each carried roughly 500,000-plus outlets, while smaller regions like the Middle East and ANZ carried 90,000 to 95,000. For an FMCG ingredient supplier, density mapped directly to addressable customer count per sales-team representative.
- UAE concentrates more than 60 percent of Middle East outlets : Dubai alone hosted 14,800 outlets — the largest single-city footprint in the Middle East dataset. For a client allocating regional sales resources, UAE-led prioritization was data-driven rather than reputation-driven.
- Canadian restaurant pricing sits in a global mid-tier : At an average $13.20 for a beef burger combo, Canada priced above Australia and the UK but well below Switzerland and Norway. For the client's premium ingredient lines, this positioned Canada as a credible mid-premium market.
- Cross-country pricing follows GDP and cost-of-living patterns predictably : Switzerland, Norway, and Canada anchored the high end; India, Vietnam, and Mexico anchored the low end. The pattern was consistent enough that the client could anticipate where premium ingredient lines would find willing customers versus where value lines would dominate.
- Global QSR chains have remarkably broad country footprints : McDonald's was present in 50-plus of the covered countries, with Subway and Starbucks close behind. For a global ingredient supplier, chain-account selling at this level represented a parallel commercial track to country-by-country independent selling.
- Italian cuisine dominates as the top non-local cuisine in most Western markets : Across Canada, Europe, ANZ, and several Latin American countries, Italian appeared as the top non-local cuisine. The pattern signalled where Italian-ingredient demand would predictably concentrate.
- Tier-2 country opportunity is consistently undervalued : Across regions, the second and third largest countries (Saudi Arabia in the Middle East, Mexico in LATAM, Vietnam in SE Asia, Spain in Europe) showed strong restaurant growth that the client had been under-resourcing relative to their flagship countries.
How the Client Used the Findings
Armed with the Global Restaurant Database, the client made three concrete decisions.
First, they reallocated sales-team capacity. Markets with strong absolute restaurant density and growth — particularly UAE in the Middle East, Mexico in LATAM, and Vietnam in SE Asia — were upweighted in the sales-team allocation model. Mature markets where growth had plateaued saw modest reductions in resource intensity.
Second, they built a global chain-accounts program. Recognizing that 50-plus-country chains like McDonald's, Subway, and Starbucks represented parallel commercial relationships, the client established a dedicated global chain-accounts team rather than relying on country-by-country selling.
Third, they aligned premium and value ingredient lines to country pricing tiers. The cross-country pricing data made clear which countries supported premium-ingredient pricing and which were value-line territories. The product portfolio was sequenced into each country accordingly, replacing a single global-portfolio assumption with country-tier-specific portfolios.
The result was a global sales-allocation program anchored to multi-country restaurant evidence rather than reputation and regional assumption — exactly the outcome the engagement was designed to deliver.
Why the Data Approach Mattered
The alternative to a multi-country database would have been the traditional approach: separate country-by-country reports, never reconciled, plus regional intuition and salesperson anecdote. That approach would have under-invested in genuinely growing markets and over-invested in flagship markets past their growth peak.
The Global Restaurant Database changed the decision entirely. By harmonizing 50-plus countries into one comparable layer, the database enabled the kind of resource-allocation decisions that simply cannot be made from country-by-country fragments. This is the core value of multi-country restaurant data: it makes globally consistent decisions possible.
Lessons for Other Markets
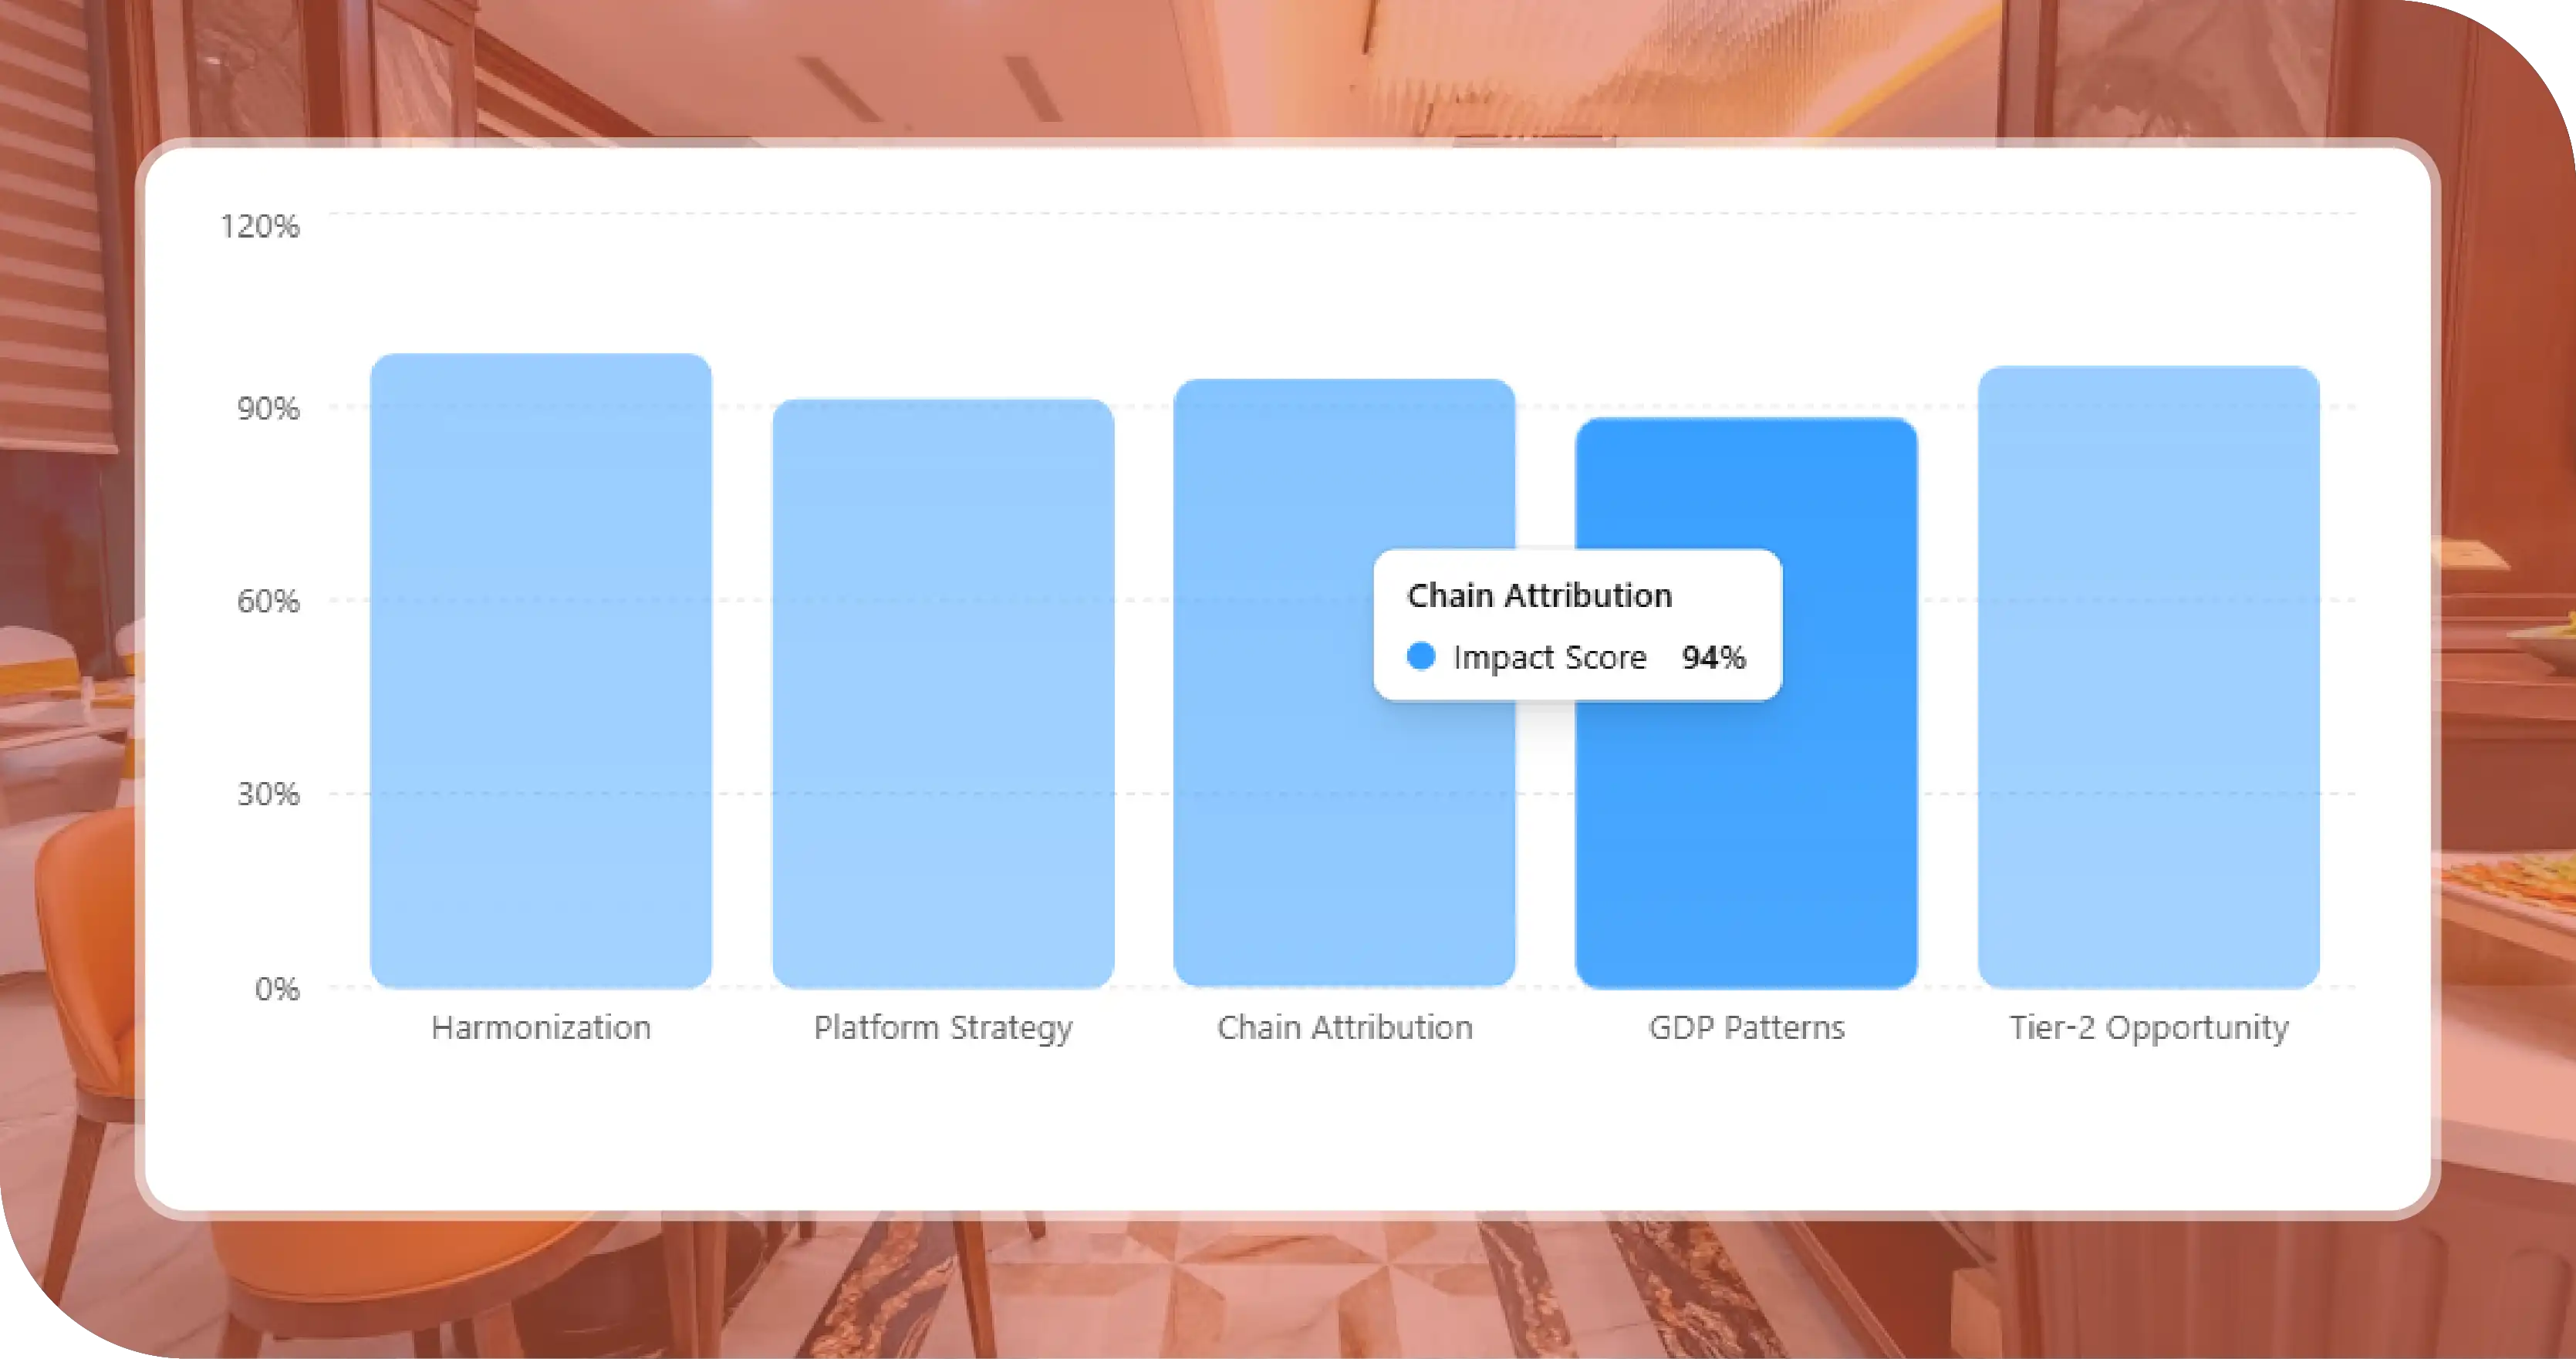
- Harmonization is the core of multi-country value. Without currency normalization, cuisine harmonization, and language-aware merchant identification, multi-country data is not actually comparable. Harmonization is the single highest-value upgrade in any multi-country project.
- Country-specific platforms require country-specific source strategy. The dominant delivery platform varies by country — Talabat in the UAE, iFood in Brazil, Glovo across parts of Europe, DoorDash in North America. A multi-country methodology must adapt its source mix by country, not apply a single template.
- Global chain attribution unlocks chain-accounts strategy. Recognizing that the same chain operates across many countries lets organizations build chain-accounts programs that would be invisible from country-by-country data alone.
- Cross-country pricing follows GDP patterns reliably. Restaurant pricing across countries clusters by GDP and cost-of-living tier. This predictability allows portfolio strategies to be sequenced by tier rather than by individual country.
- Tier-2 country opportunity is consistently under-resourced. In every region, second- and third-largest countries tend to be under-prioritized relative to their growth. Multi-country data routinely flags these opportunities that single-country thinking misses.
These lessons illustrate why harmonized, multi-country, language-aware restaurant data repays its cost many times over.
Engagement Outcomes at a Glance
The table below summarizes the measurable outcomes the client attributed to the database within the first year of its global sales-priority program.
| Outcome Area | Before the Database | After Acting on the Database |
|---|---|---|
| Sales-team allocation | Reputation and salesperson anecdote | Density-and-growth-driven model |
| Chain-accounts approach | Country-by-country | Dedicated global chain-accounts team |
| Portfolio sequencing | Single global portfolio | Country-tier-specific portfolios |
| Tier-2 country investment | Under-resourced | Upweighted (KSA, Mexico, Vietnam, Spain) |
| Cross-country pricing strategy | Disconnected per country | GDP-tiered global framework |
The engagement converted a regionally fragmented, reputation-led global sales strategy into a disciplined, evidence-anchored, multi-country program.
Why Choose Food Data Scrape
Building a multi-country restaurant database covering the UAE, Canada, and 50-plus additional countries is a uniquely demanding undertaking. It requires country-by-country source strategy across many different dominant platforms; multi-language parsing; multi-currency normalization with period-aware exchange rates; cuisine harmonization that respects country-specific traditions while enabling cross-country comparison; cross-country chain attribution; sustained refresh capacity across geographically dispersed sources; and analyst depth in every covered region. Most internal teams and most generalist data providers cannot deliver this scope at the necessary quality and consistency.
We bring managed infrastructure, ethical and compliant data collection practices, and deep domain expertise in restaurant and food-service data across multiple regions. Advantages include compliance-first architecture, scalable extraction across millions of public pages daily in many languages, multi-currency normalization, cuisine harmonization, cross-country chain attribution, fully customizable refresh cadence, dedicated analyst support familiar with regional restaurant market dynamics, and out-of-the-box dashboards highlighting cross-country and within-region patterns. The team has supported global FMCG suppliers, multinational restaurant chains, hospitality investors, franchise groups, real estate developers, and research consultancies—bringing the practical experience of how comprehensive restaurant data drives real commercial outcomes at global scale.
This is powered through Food Delivery Scraping API capabilities and enriched Food Datasets, enabling organizations to build accurate, scalable, and continuously updated restaurant intelligence systems for global decision-making.
Conclusion
The Global Restaurant Database Case Study demonstrates how multi-country, harmonized restaurant data transforms a global sales-priority program. By unifying the UAE, Canada, and 50-plus additional countries into a single comparable layer — with currency normalization, language handling, cuisine harmonization, and cross-country chain attribution — the database revealed where opportunity sat, where flagship markets had peaked, and where tier-2 country investment would produce stronger returns. The client launched its revised global sales program grounded in multi-country evidence, not regional assumption.
For any global FMCG supplier, multinational restaurant chain, international franchise group, or cross-border investor evaluating restaurant markets, the lesson is consistent: structured, harmonized, multi-country restaurant data turns global decision-making from a series of disconnected country-views into a disciplined, comparable, globally-coherent commercial program.
If you are ready to base your next global allocation decision on a true multi-country ground-truth view, get in touch with our team today.

