
Ho Chi Minh City (HCMC) continues to emerge as one of Southeast Asia’s fastest-growing food delivery ecosystems, driven by rapid urbanization, evolving consumer behavior, and increasing digital adoption. The GrabFood HCMC Restaurant Intelligence Report 2026 provides a structured analysis of restaurant density, cuisine distribution, district-level pricing, promotional activity, and cloud kitchen expansion across the city’s most competitive food delivery markets. This report highlights how district-level intelligence is becoming essential for restaurant brands, franchise operators, FMCG suppliers, cloud kitchen platforms, and investors operating in Vietnam’s dynamic food and beverage industry. By integrating real-time GrabFood restaurant datasets, pricing analytics, bilingual menu extraction, and automated market intelligence, businesses can better understand localized consumer demand and competitive positioning across HCMC. The report explores how pricing, cuisine popularity, and promotional strategies differ significantly between key districts such as District 1, Thao Dien, District 7, District 10, Binh Thanh, and Phu Nhuan. It also demonstrates how cloud kitchen growth, expat-driven demand, tourist activity, and regional consumer preferences are reshaping Vietnam’s food delivery landscape.
District-level restaurant intelligence reveals major differences in cuisine concentration, pricing behavior, and promotional activity across HCMC.
District 10 and District 3 dominate traditional Vietnamese cuisine density with strong local demand for pho, com tam, and banh mi concepts.
Real-time GrabFood HCMC scraping and restaurant menu data extraction help businesses benchmark competitors, optimize pricing strategies, and identify emerging cuisine trends.
Food Data Scrape delivers structured GrabFood Vietnam datasets, district-level restaurant intelligence, pricing analytics, and market insights for smarter decision-making across Vietnam’s food delivery ecosystem.
Ho Chi Minh City — formerly Saigon — is the southern engine of Vietnam's economy and the country's most dynamic food and beverage market. With a population of over nine million, a rapidly growing middle class, a substantial expatriate community, and one of the most developed food delivery ecosystems in Southeast Asia, HCMC offers a layered, competitive landscape where district-level intelligence separates winning commercial decisions from costly missteps. The GrabFood HCMC Restaurant Intelligence Report 2026 is a structured study of how the city's restaurant landscape behaves on GrabFood — the leading food delivery platform in Vietnam — across its most important districts.
This report walks through the methodology behind the GrabFood HCMC Restaurant Intelligence Report 2026, district-by-district restaurant density, cuisine concentration, pricing benchmarks, promotional intensity, cloud kitchen footprint, and the commercial implications for restaurant brands, franchise operators, FMCG suppliers, cloud kitchen platforms, and investors operating in Vietnam.
The work is delivered by Food Data Scrape, an infrastructure provider specializing in clean, harmonized food delivery data at regional scale. The Report is refreshed quarterly; the values shown here reflect 2026 Q4 capture across more than 25,000 HCMC merchants.
Aggregate "Vietnam" data, or even aggregate "HCMC" data, obscures the structural differences that drive commercial decisions in this city. HCMC is not a single market — it is a mosaic of districts with sharply distinct economic profiles, consumer demographics, cuisine concentrations, and pricing dynamics. A franchise expansion decision, a pricing benchmark, a competitor footprint analysis, or a cloud kitchen launch all depend on district-level resolution.
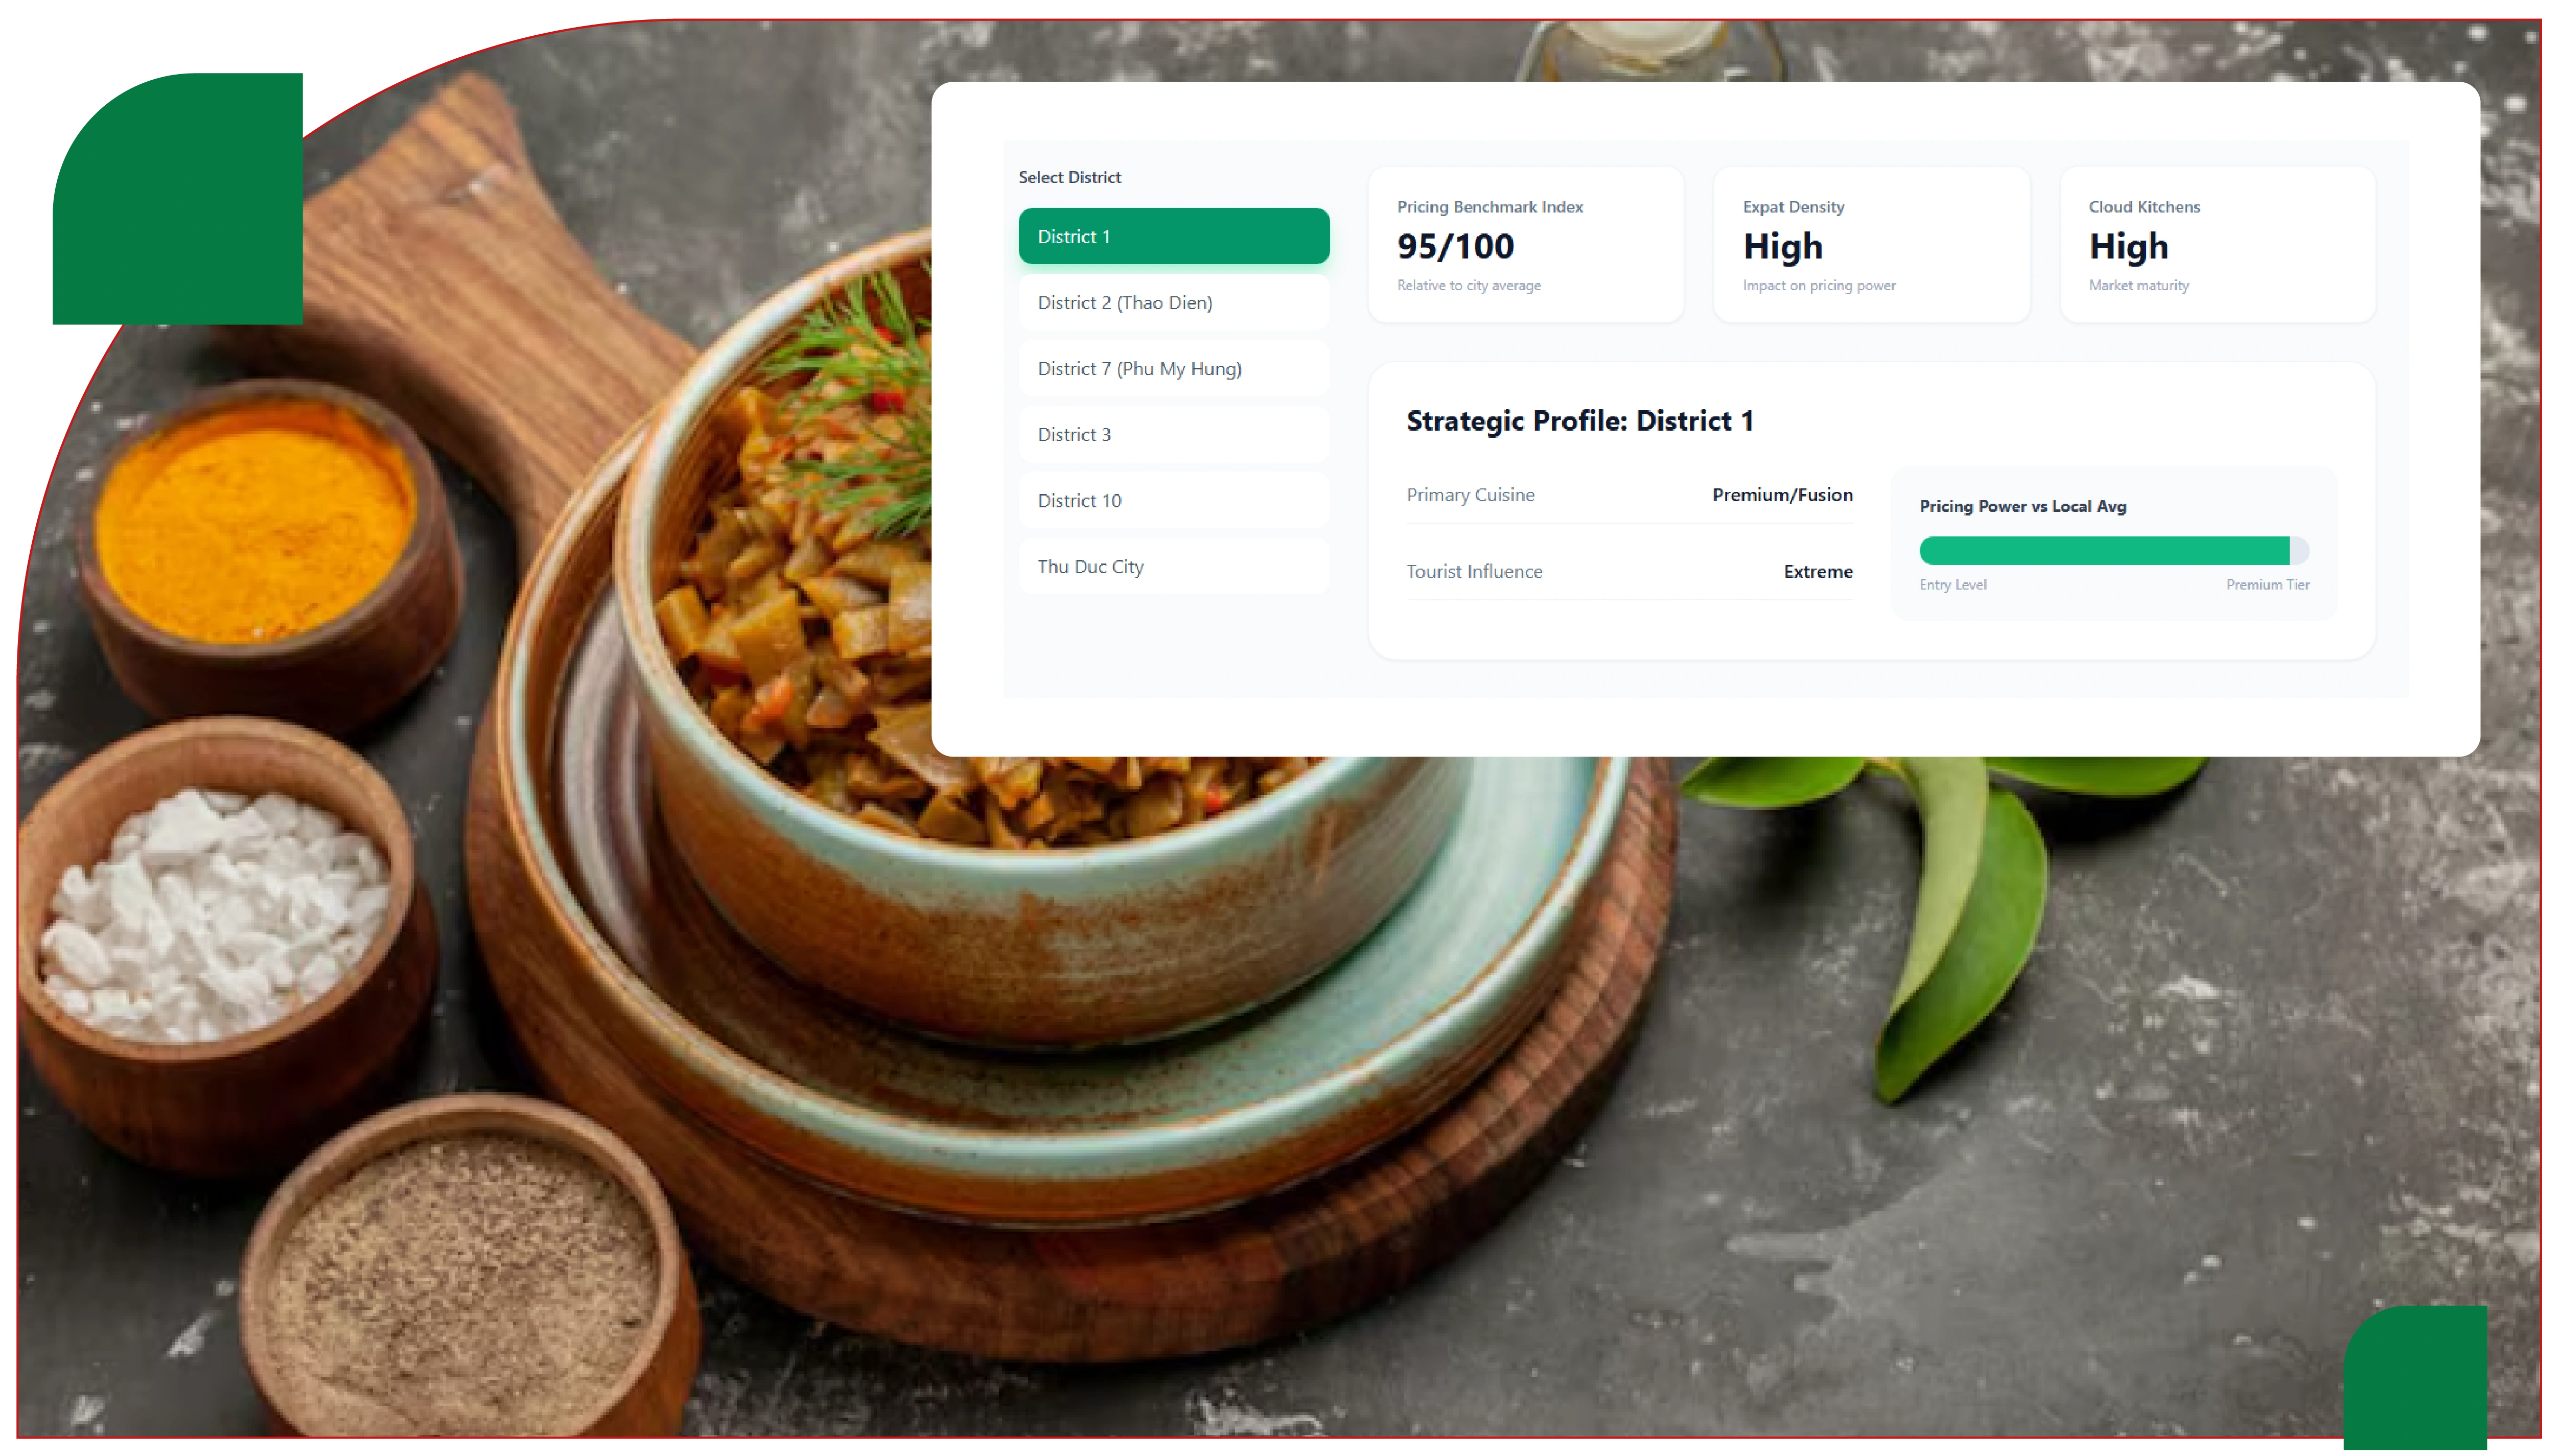
District 1 hosts the city's central business district, premium hotel concentration, and high tourist flow. District 2 (Thao Dien) is the city's most established expat neighborhood and has become a magnet for international cuisines. District 7 (Phu My Hung) is a planned residential and commercial district favored by expatriates and middle-to-upper-income Vietnamese families. District 3 and District 10 anchor dense local-cuisine clusters with deep traditional Vietnamese roots. Districts like Binh Thanh, Tan Binh, Go Vap, and Phu Nhuan combine residential density with growing F&B activity. Outer districts like District 9 (now Thu Duc City) host rapidly urbanizing residential growth.
A robust GrabFood HCMC Restaurant Intelligence Report 2026 unlocks decisions that aggregate data cannot answer.
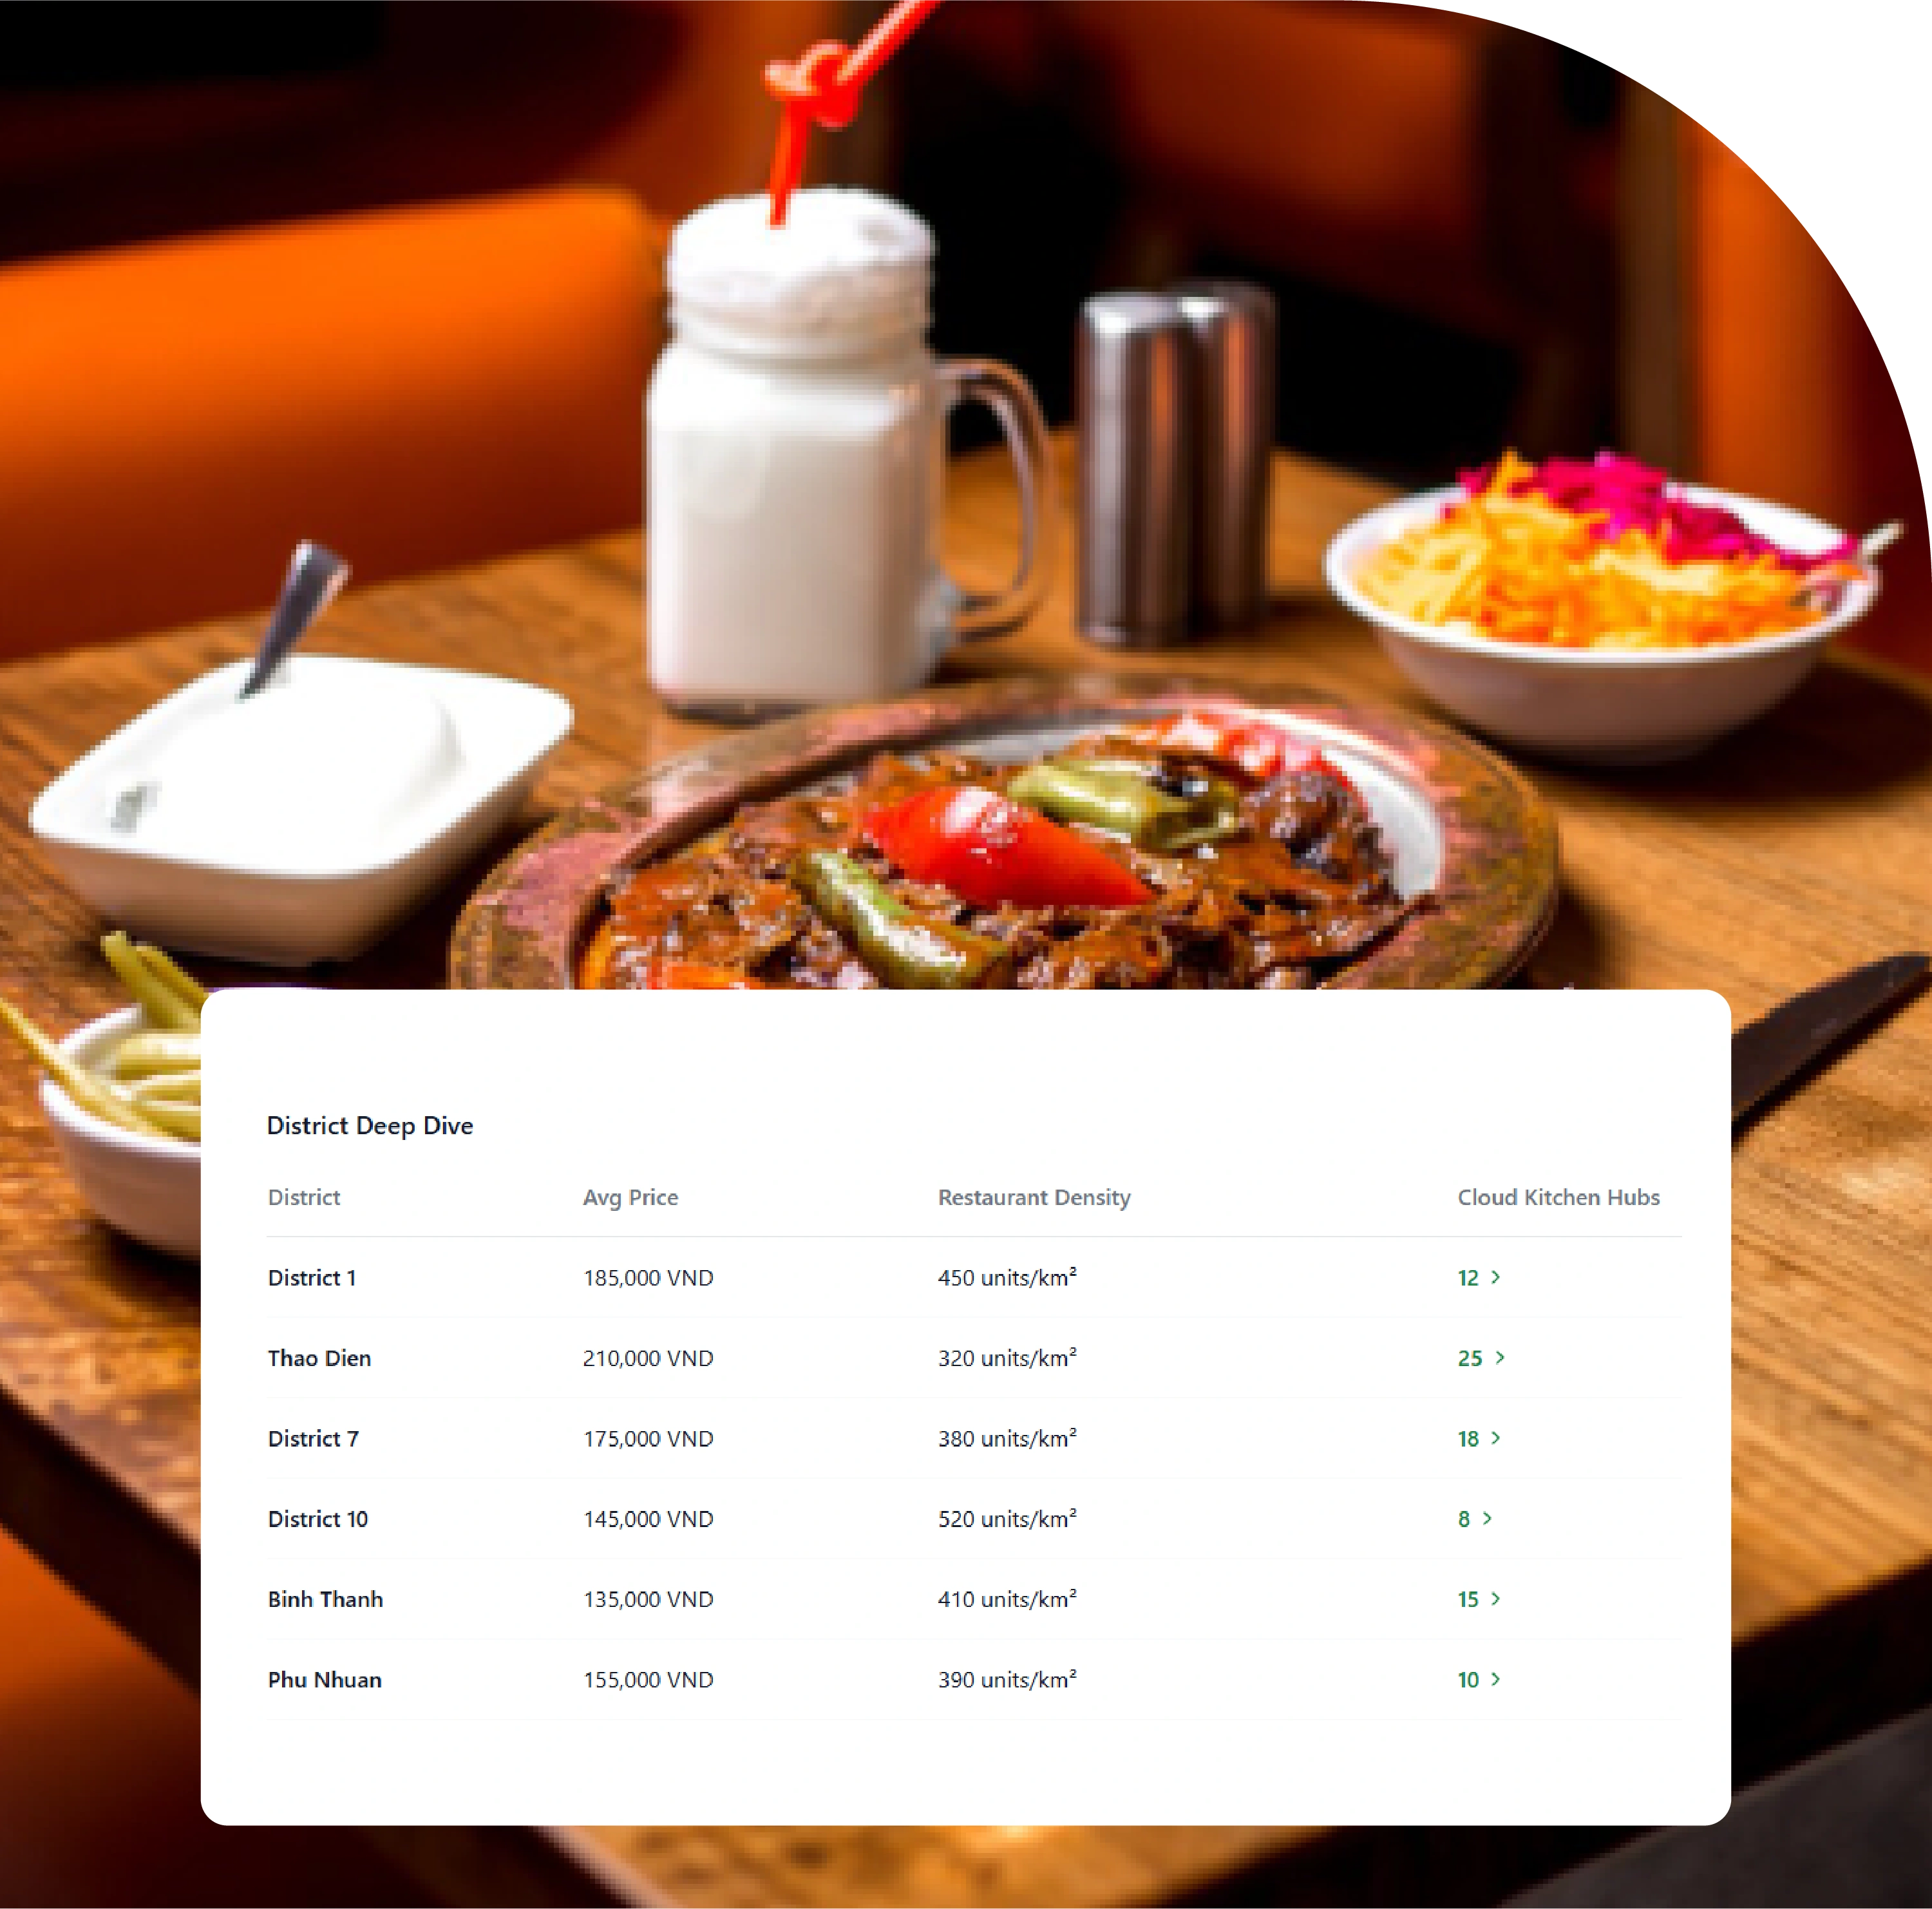
Pricing varies sharply by district: A typical bowl of pho can list at 45,000 VND in District 10 and 90,000 VND in Thao Dien, reflecting target customer, rent, and positioning. District-aware pricing benchmarks are essential for menu engineering.
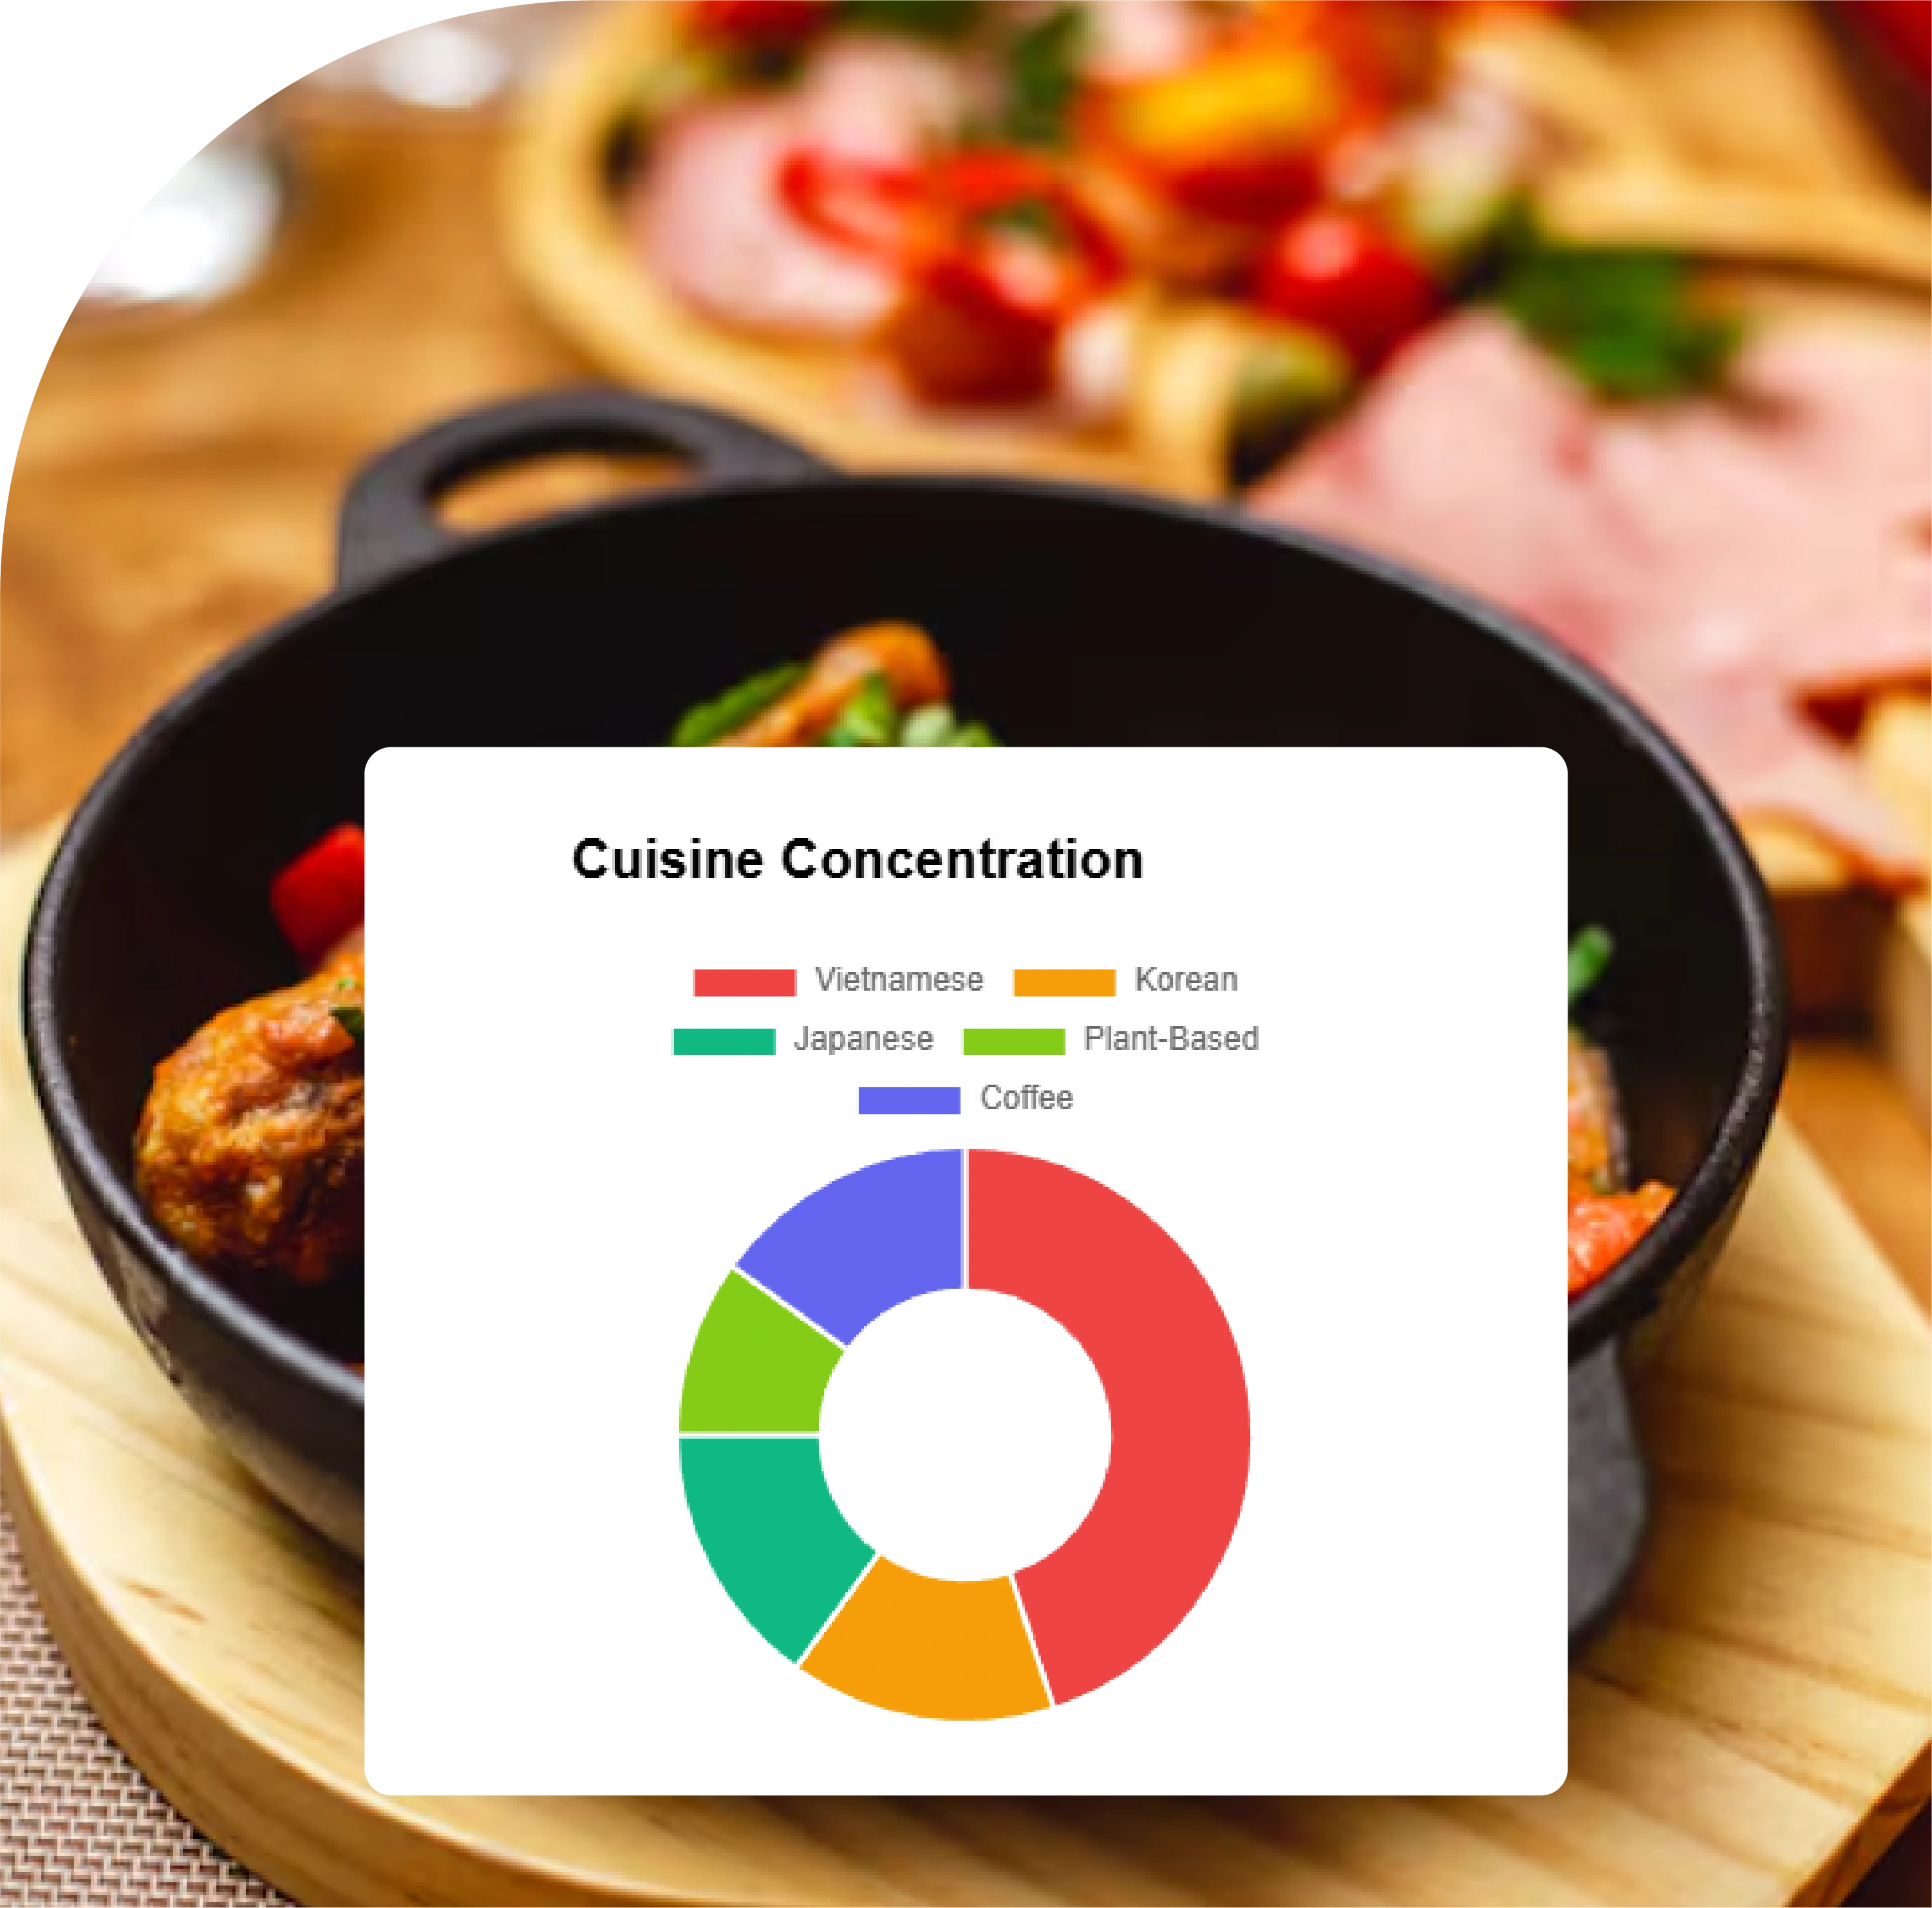
Cuisine concentration is district-specific: Japanese ramen specialists cluster in District 1 and Thao Dien; traditional Vietnamese pho dominates District 3 and District 10; Korean concepts grow fastest in District 7 and Thao Dien. New entrant strategy depends on where each cuisine has headroom.
Expat-driven pricing premiums are quantifiable: Districts with high expat concentration consistently price 40 to 80 percent above equivalent locally-anchored neighborhoods. Brands targeting expat customers should price accordingly; brands targeting local demand should not.
Cloud kitchen footprint by district: HCMC has emerged as one of Southeast Asia's most active cloud kitchen markets. Operator distribution across districts shapes competitive intensity in specific zones.
Tourist-flow effects in central districts: District 1 and parts of District 3 see meaningful tourist-driven demand that affects merchant pricing and assortment in observable ways.
Promotional cycles vary by district economics. Districts serving more price-sensitive demographics see heavier promotional activity than premium districts where positioning preserves brand equity.
The GrabFood HCMC Restaurant Intelligence Report 2026 rests on a structured sampling and harmonization methodology that delivers district-aware, comparable, refreshed intelligence.
District-level anchoring: Delivery anchors span District 1, District 2 (Thao Dien), District 3, District 4, District 5, District 7 (Phu My Hung), District 10, Binh Thanh, Phu Nhuan, Tan Binh, and Go Vap. Each district is anchored across multiple ZIP-equivalent locations to capture neighborhood-level variation.
Cuisine taxonomy: Each merchant and dish is mapped into a harmonized cuisine taxonomy covering Vietnamese (with regional sub-categories — Northern, Central, Southern), Chinese, Japanese, Korean, Thai, Western, Italian, Indian, Middle Eastern, halal-friendly, plant-based, dessert/beverage, and emerging categories.
Currency normalization: Records are stored in VND with explicit tax flags. USD equivalents are computed at period-average exchange rates.
Language handling: Listings appear in Vietnamese and English. Parsing handles both languages and normalizes brand and dish names so the same merchant is recognizable regardless of language presentation.
Cloud kitchen identification: Multiple virtual brands operating from a single physical address are clustered together, exposing cloud kitchen footprint by district.
Refresh cadence: Top-velocity merchants and trending concepts refresh daily; long-tail merchants refresh weekly. Promotional changes and new launches trigger near-real-time recapture.
Quality assurance: Every record passes schema validation, merchant disambiguation, cuisine reclassification, regional Vietnamese sub-classification, and outlier detection before entering the dataset.
The following sample tables represent the core of the 2026 Q4 Report. All prices in VND.
| District | Vietnamese | Japanese | Korean | Western | Cafe / Dessert | Total |
|---|---|---|---|---|---|---|
| District 1 | 1,840 | 290 | 180 | 230 | 380 | 2,920 |
| District 2 (Thao Dien) | 720 | 240 | 160 | 220 | 310 | 1,650 |
| District 3 | 1,620 | 130 | 90 | 110 | 210 | 2,160 |
| District 7 (Phu My Hung) | 980 | 180 | 140 | 190 | 290 | 1,780 |
| District 10 | 1,890 | 110 | 80 | 90 | 180 | 2,350 |
| Binh Thanh | 1,520 | 140 | 110 | 130 | 230 | 2,130 |
| Phu Nhuan | 980 | 95 | 70 | 80 | 160 | 1,385 |
| Dish | District 1 | Thao Dien | District 3 | District 7 | District 10 |
|---|---|---|---|---|---|
| Pho Bo (Beef Pho) | 75,000 | 90,000 | 55,000 | 70,000 | 50,000 |
| Banh Mi Thit | 38,000 | 45,000 | 30,000 | 35,000 | 28,000 |
| Com Tam Suon | 68,000 | 80,000 | 55,000 | 65,000 | 50,000 |
| Bun Cha | 65,000 | 75,000 | 55,000 | 60,000 | 50,000 |
| Goi Cuon (2 pcs) | 45,000 | 55,000 | 35,000 | 42,000 | 32,000 |
| District | Active Promo Share | Avg Discount | Most Common Mechanic |
|---|---|---|---|
| District 1 | 38% | 18% | Set Discount |
| Thao Dien | 32% | 16% | Combo / Bundle |
| District 3 | 41% | 21% | Weekday Special |
| District 7 | 35% | 17% | Family Bundle |
| District 10 | 48% | 22% | Daily Deal |
| Binh Thanh | 45% | 20% | BOGO |
| District | Cloud Kitchen Facilities | Virtual Brands Hosted |
|---|---|---|
| District 1 | 6 | 72 |
| Thao Dien | 4 | 38 |
| District 7 | 9 | 110 |
| District 10 | 5 | 58 |
| Binh Thanh | 8 | 95 |
| Go Vap | 7 | 84 |
| Cuisine | YoY Growth | Most Active District |
|---|---|---|
| Korean | +24% | Thao Dien, District 7 |
| Cafe / Specialty Coffee | +19% | District 1, Thao Dien |
| Plant-Based / Vegan | +31% | Thao Dien, District 7 |
| Japanese Ramen | +18% | District 1 |
| Bubble Tea / Milk Tea | +15% | District 1, District 10 |
| Modern Vietnamese | +12% | District 1, Thao Dien |
These tables represent a small slice of the millions of records captured across HCMC each quarter.
Several consistent patterns emerge from systematic HCMC GrabFood analysis.
Thao Dien anchors the city's pricing premium: Across every Vietnamese dish in the sample, Thao Dien prices 30 to 60 percent above District 10 equivalents, reflecting the district's established expatriate community, premium dining culture, and higher operational costs. Brands serving Thao Dien must price intentionally; those targeting local demand should not import Thao Dien pricing into other districts.
District 10 and District 3 lead Vietnamese traditional density: These two districts together host the largest concentrations of traditional Vietnamese merchants in the city, with strong pho, com tam, and bun representation. For brands building traditional concepts, these districts offer both volume and competitive intensity.
District 1 hosts the most diverse cuisine mix: With 2,920 active merchants spanning Vietnamese traditional, Japanese, Korean, Western, and cafe/dessert categories, District 1 functions as the city's culinary crossroads. International chains and tourist-oriented concepts cluster here.
Cloud kitchen footprint concentrates in District 7, Binh Thanh, and Go Vap: These three districts together host the bulk of HCMC's cloud kitchen facilities, with District 7 leading on virtual brand count thanks to favorable real estate economics and dense residential demand.
Promotional intensity is highest in District 10 and Binh Thanh: These two districts show the largest share of merchants running active promotions, reflecting more price-sensitive consumer demographics and dense competitive sets. Brands operating here should expect to compete heavily on promotion.
Plant-based and Korean are the fastest-growing cuisines: Plant-based merchants grew 31 percent year-on-year and Korean cuisine grew 24 percent — both concentrated in Thao Dien and District 7. These growth signals identify where category innovation is being absorbed fastest.
Tourist-flow effects are visible in District 1 pricing: Within District 1, sub-districts closer to Ben Thanh Market and Nguyen Hue walking street show measurably higher pho and banh mi prices than sub-districts further from tourist zones.
Promotional architecture follows district economics: Premium districts use combo and bundle mechanics that preserve brand equity. Mid-tier and locally-anchored districts use deeper percentage discounts, BOGO, and weekday specials that drive trial.
Several drivers explain the HCMC restaurant intelligence pattern.
District-level real estate economics: Rent in Thao Dien and District 1 prime areas runs several times higher than in District 10 or Phu Nhuan. This cost flows directly into menu pricing and merchant assortment decisions.
Expat and tourist demand layering: Thao Dien's expat community and District 1's tourist flow both tolerate price levels closer to international expectations. This creates a structural pricing premium that other districts cannot easily import without losing local demand.
Cuisine demand-supply balance: Districts with deep Vietnamese-traditional demand (District 3, District 10) sustain high merchant counts at lower price points. Districts with international demand profiles (Thao Dien, District 7) sustain fewer merchants at higher price points across more varied cuisines.
Cloud kitchen real estate logic: Cloud kitchen operators select districts that combine moderate facility costs with dense delivery demand. District 7, Binh Thanh, and Go Vap meet this profile, while District 1 — despite high demand — is too expensive for typical cloud kitchen unit economics.
Promotional ecosystem depth: Vietnam's GrabFood promotional architecture (vouchers, GrabUnlimited, GrabPay rebates) creates layered effective-price dynamics. Merchants in price-sensitive districts often participate in deeper promotions to maintain order velocity, while premium-district merchants protect brand by promoting more conservatively.
Generational and consumer-preference shifts: Younger HCMC consumers, particularly in District 7 and Thao Dien, drive demand for Korean, Japanese, plant-based, and specialty coffee concepts. These cuisines under-index in older, more traditional districts.
Currency stability and pricing inertia: VND has been relatively stable against USD compared with some regional currencies, which has slowed the typical exchange-rate-driven adjustments seen in other markets. Pricing dynamics in HCMC reflect domestic conditions more than currency effects.
The GrabFood HCMC Restaurant Intelligence Report 2026 has direct implications for several commercial functions.
For restaurant brands: Brands operating across multiple HCMC districts should not apply a single pricing schema. Index data provides realistic per-district benchmarks to anchor menu engineering, particularly for brands serving both expat-dense and locally-anchored districts.
For market entrants: A brand considering HCMC entry can use the Report to evaluate which district to launch in first based on cuisine concentration, pricing, and competitive intensity. Thao Dien and District 7 reward premium positioning; District 10 and District 3 reward value and traditional-cuisine credibility.
For franchise operators: Franchise contracts typically include pricing guidelines. The Report provides defensible benchmarks against which franchisee compliance can be measured at district level.
For FMCG and ingredient suppliers: Suppliers can use the Report to understand which districts and which cuisines are growing fastest, informing product portfolio decisions and sales prioritization.
For cloud kitchen platforms: Operators can use district-level virtual brand counts and cuisine gaps to identify launch opportunities for new virtual brands.
For investors and M&A teams: Investors evaluating Vietnamese F&B businesses can validate revenue assumptions against district-level Report data, exposing where a portfolio company's claimed average order value diverges from district benchmarks.
For real estate developers: Mall and commercial-space developers can use the Report to evaluate F&B tenant mix demand by district and inform leasing decisions.
Several trends are likely to shape HCMC's GrabFood landscape in 2027.
Continued Korean and Japanese expansion: With double-digit annual growth, both cuisines are likely to continue spreading from Thao Dien and District 7 into District 1 and Binh Thanh.
Plant-based momentum: Plant-based growth at 31 percent year-on-year is the steepest in the dataset. Expect this category to mature beyond Thao Dien into District 1 and District 7 over the next several quarters.
Cloud kitchen consolidation: Several smaller cloud kitchen operators are likely to consolidate or be acquired by larger regional platforms, concentrating virtual brand portfolios under fewer operators
Thu Duc City emergence: The newly consolidated Thu Duc City (incorporating former District 2, 9, and Thu Duc District) is rapidly urbanizing. Expect Thu Duc City to emerge as a meaningful F&B and cloud kitchen growth area through 2027.
Premiumization in District 7: Phu My Hung continues to attract international chain entrants and premium concepts. Expect pricing in District 7 to converge upward toward Thao Dien levels.
Sustainability premium emergence: Plant-based, sustainable-sourcing, and ethical-supply-chain positioning is starting to command modest price premiums in Thao Dien and District 1. The next Report update will track whether this premium becomes statistically meaningful.
For brands actively choosing where to deploy capital in HCMC, the Report supports several practical district-comparison frameworks.
Thao Dien vs District 7: choosing between two expat-anchored markets. Both districts attract international concepts and tolerate premium pricing, but their consumer profiles differ. Thao Dien skews toward Western European and American expats with strong cafe and casual-dining demand. District 7 attracts Korean, Taiwanese, and Japanese expatriate families plus middle-to-upper-income Vietnamese, making it a stronger market for Korean and Japanese concepts. A brand choosing between the two should match positioning to demographic profile rather than treating them as interchangeable.
District 1 vs District 3: tourist-anchored versus locally-anchored central districts. District 1 prices high and rewards tourist-oriented concepts; District 3 prices moderately and rewards traditional Vietnamese excellence. A traditional pho or banh mi specialist would likely outperform in District 3, while a fusion Vietnamese concept targeting tourists would likely perform better in District 1.
District 10 vs Binh Thanh: dense locally-anchored markets. Both districts offer high merchant counts and competitive intensity at moderate prices. District 10 leans slightly more traditional; Binh Thanh shows faster growth in younger-consumer concepts including bubble tea, fried chicken, and casual Korean. Brands choosing between them should match concept to local-consumer profile.
Go Vap and Phu Nhuan: emerging cloud kitchen markets. Both districts combine moderate residential density with affordable cloud-kitchen-friendly real estate. Operators considering Phase 2 expansion in HCMC often select between these two based on warehouse logistics and labor availability.
These framework comparisons illustrate how the Report's district-level data translates into specific commercial decisions. Brands using the Report move from generic intuitions ("HCMC is competitive") to concrete choices ("Launch this concept in Phu My Hung first, then expand to Thao Dien in quarter three").
Building reliable HCMC GrabFood intelligence at district resolution is harder than it appears. Bilingual listings require careful Vietnamese-English parsing, district-based personalization affects what consumers see, regional cuisine taxonomy (Northern vs Central vs Southern) requires linguistic and culinary context, and pricing shifts frequently during peak meal windows. Most internal teams underestimate the engineering and Vietnamese market context required to deliver trustworthy data.
We bring managed infrastructure, ethical and compliant data collection practices, and deep domain expertise in Vietnamese and Southeast Asian food and beverage. Through GrabFood Vietnam API scraping and HCMC restaurant menu data extraction, our advantages include compliance-first architecture, scalable extraction across millions of public pages daily, Vietnamese-English bilingual parsing, fully customizable harmonized schemas including regional cuisine sub-taxonomies, near-real-time refresh on priority merchants, cloud kitchen identification logic, dedicated analyst support familiar with HCMC dynamics, and out-of-the-box dashboards highlighting district-by-district and cuisine-by-cuisine patterns. The team has supported restaurant chains, cloud kitchen operators, FMCG suppliers, investors, and research consultancies — bringing the practical experience of how scraped data drives commercial outcomes in Vietnam specifically.
HCMC's GrabFood landscape is not one market — it is at least eleven distinct district-level markets, each with its own economic profile, cuisine fingerprint, competitive intensity, and pricing logic. Brands, distributors, suppliers, and investors who recognize this district-level structure and act on it will outperform those who rely on aggregate city-wide data or anecdotal impressions.
The Report will continue to be refreshed quarterly, with future editions adding new districts as Thu Duc City matures, expanding cuisine taxonomy as new concepts emerge, and tracking how the district-level patterns evolve over time. The brands and investors who succeed in HCMC food and beverage in the years ahead will be those who build their strategy on structured, refreshed, district-level data rather than city-level generalizations.
If you are ready to act on real HCMC restaurant intelligence instead of intuition, get in touch with our team today.

