
The Southeast Asian food delivery market has witnessed rapid expansion as consumers increasingly rely on platforms like GrabFood for convenient meal ordering and price comparisons. Identical dishes across countries such as Singapore, Malaysia, Indonesia, Thailand, Vietnam, and the Philippines often display significant pricing differences driven by currency fluctuations, local purchasing power, restaurant operating costs, taxes, delivery charges, and promotional campaigns. As competition intensifies among restaurants and delivery platforms, real-time monitoring of menu pricing, discounts, and delivery economics has become essential for understanding regional market behavior and consumer spending patterns. Businesses leveraging cross-country pricing intelligence can optimize menu strategies, benchmark competitors, and improve regional expansion planning. Analysis of pricing trends reveals that dynamic promotions, platform fees, cuisine demand, and localized competition strongly influence final dish prices across Southeast Asian markets. Additionally, comparative pricing data helps brands identify premium and value-driven markets while enabling more accurate pricing and profitability decisions.
Cross-Country Price Differences: The same dish shows noticeable price variation across six Southeast Asian countries due to local economic conditions, taxes, and restaurant operating costs.
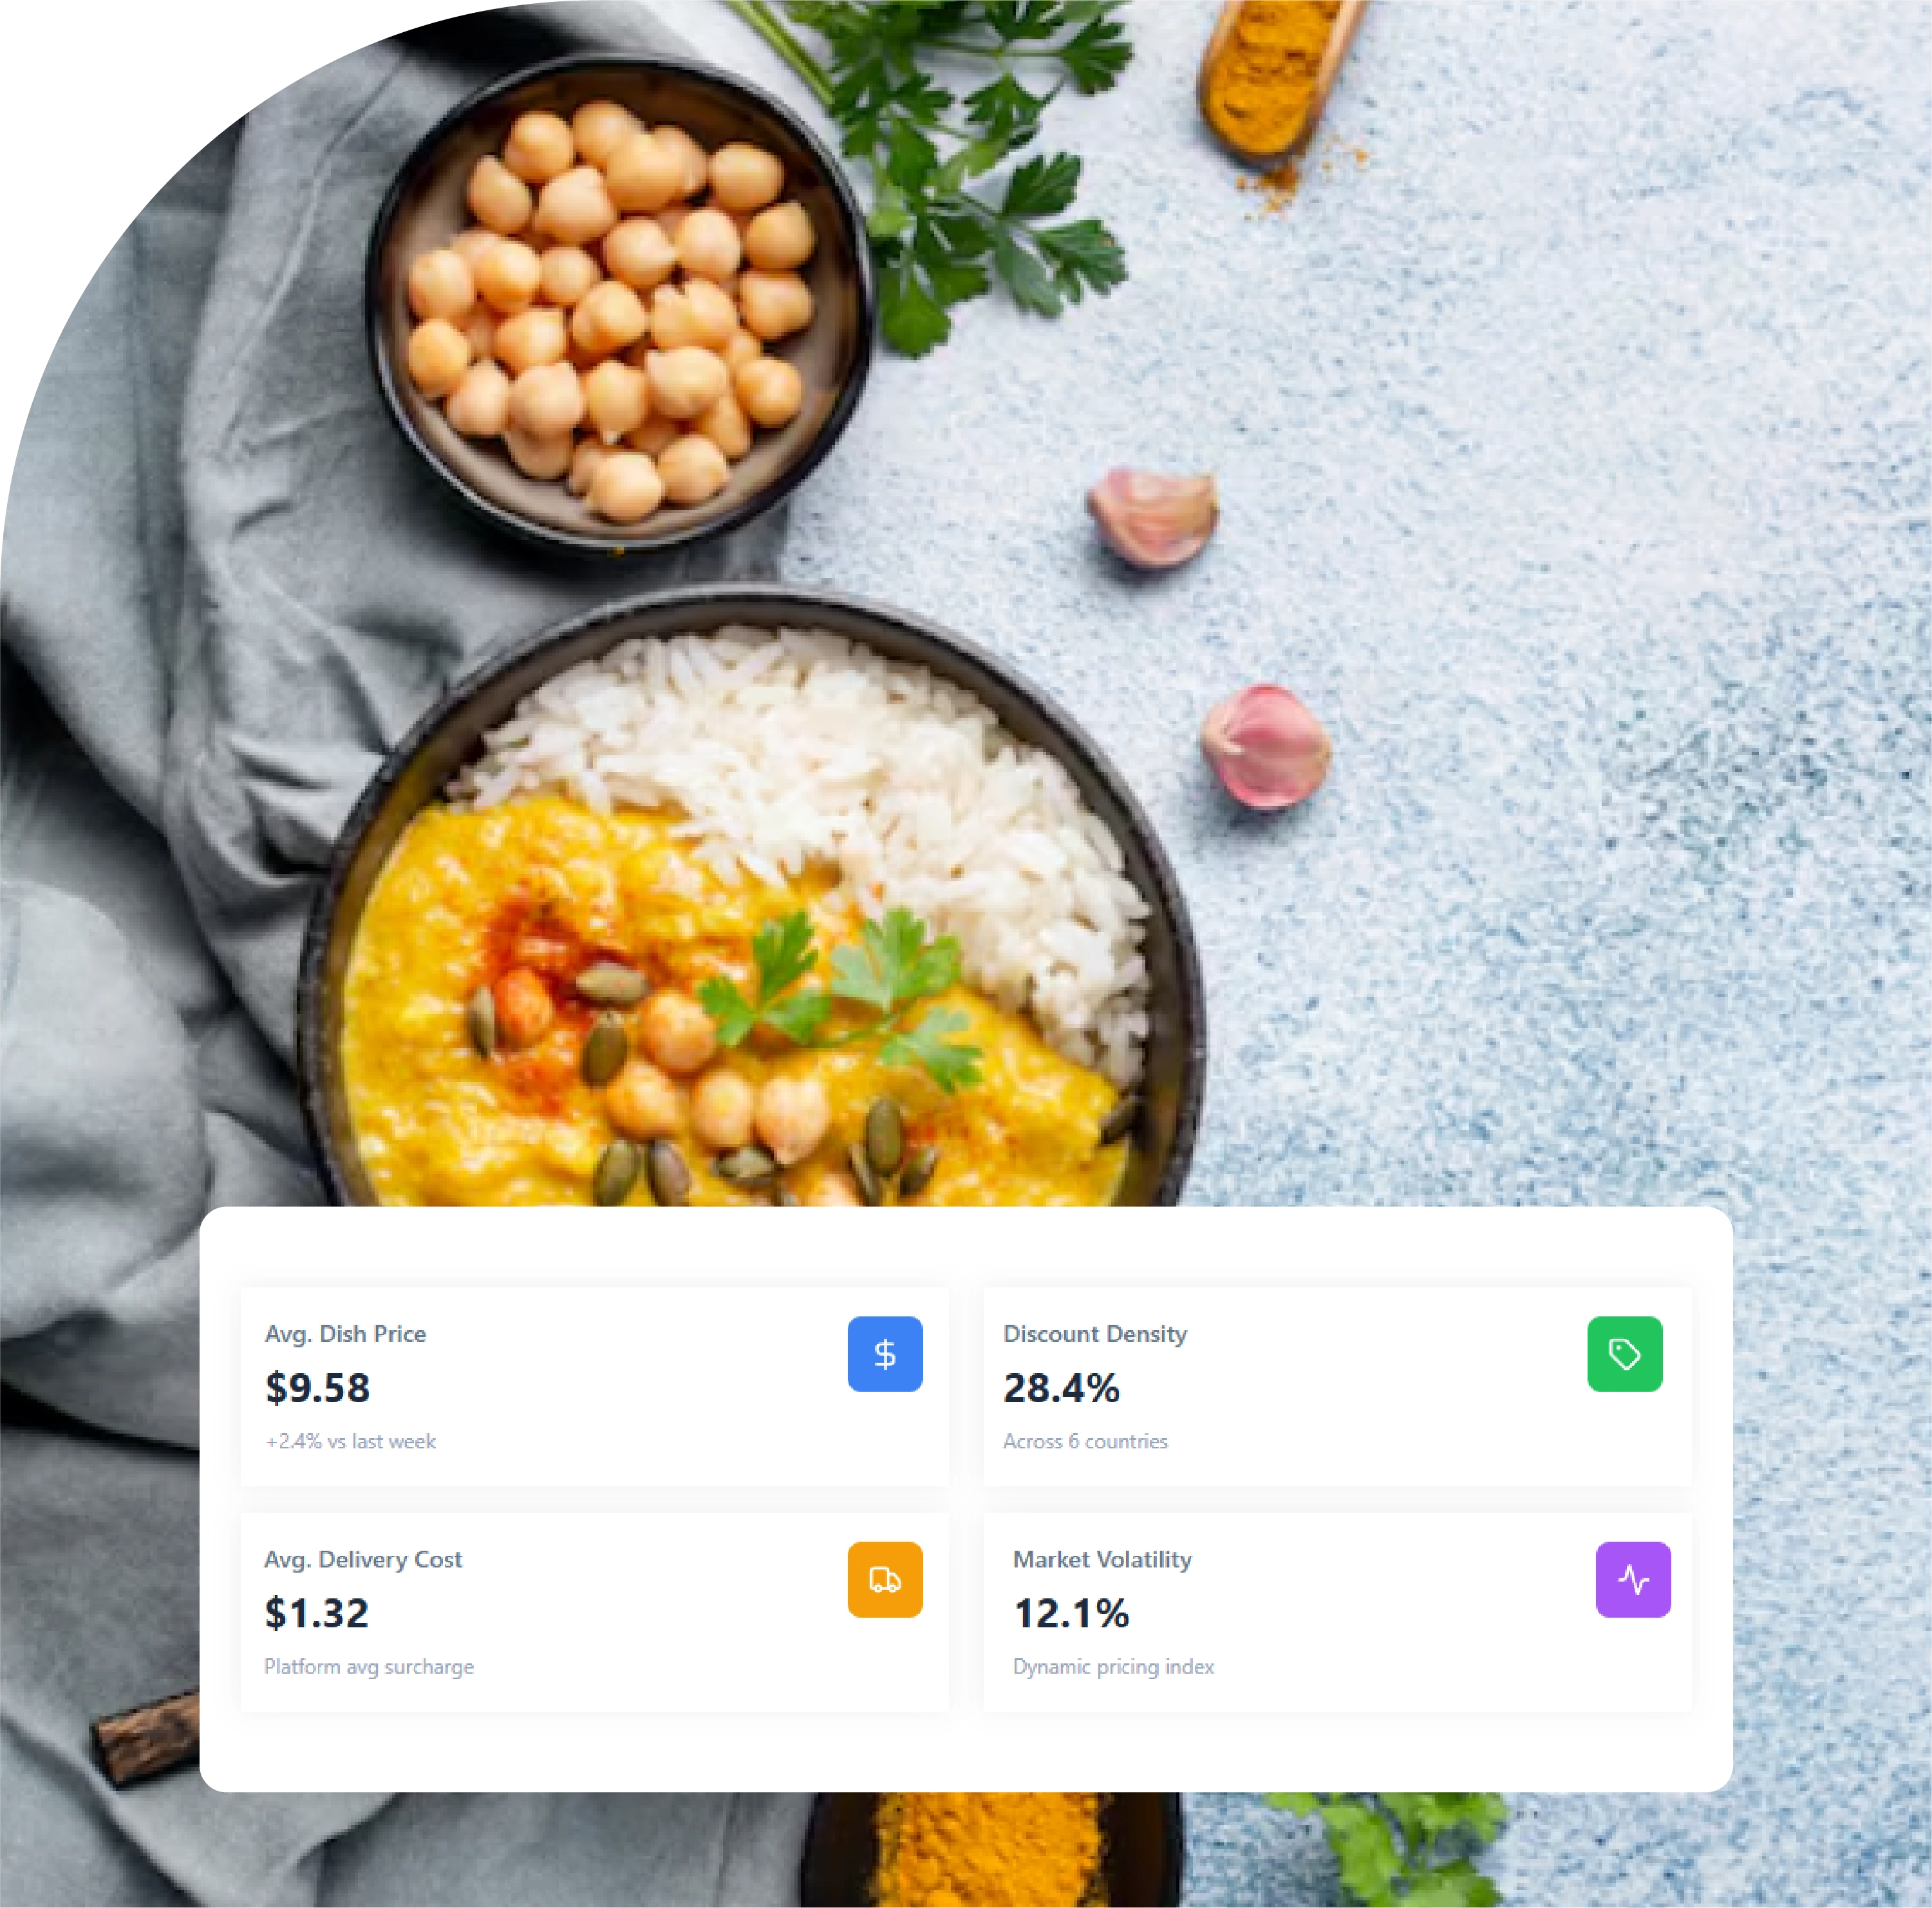
Dynamic Pricing Trends: Restaurants frequently adjust menu prices based on demand fluctuations, meal timings, seasonal campaigns, and competitive market conditions.
Delivery Cost Impact: Delivery fees, packaging charges, and platform commissions contribute heavily to overall order pricing beyond base menu prices.
Promotion & Discount Analysis: – Flash deals, vouchers, combo offers, and delivery subsidies significantly influence final customer spending across regions.
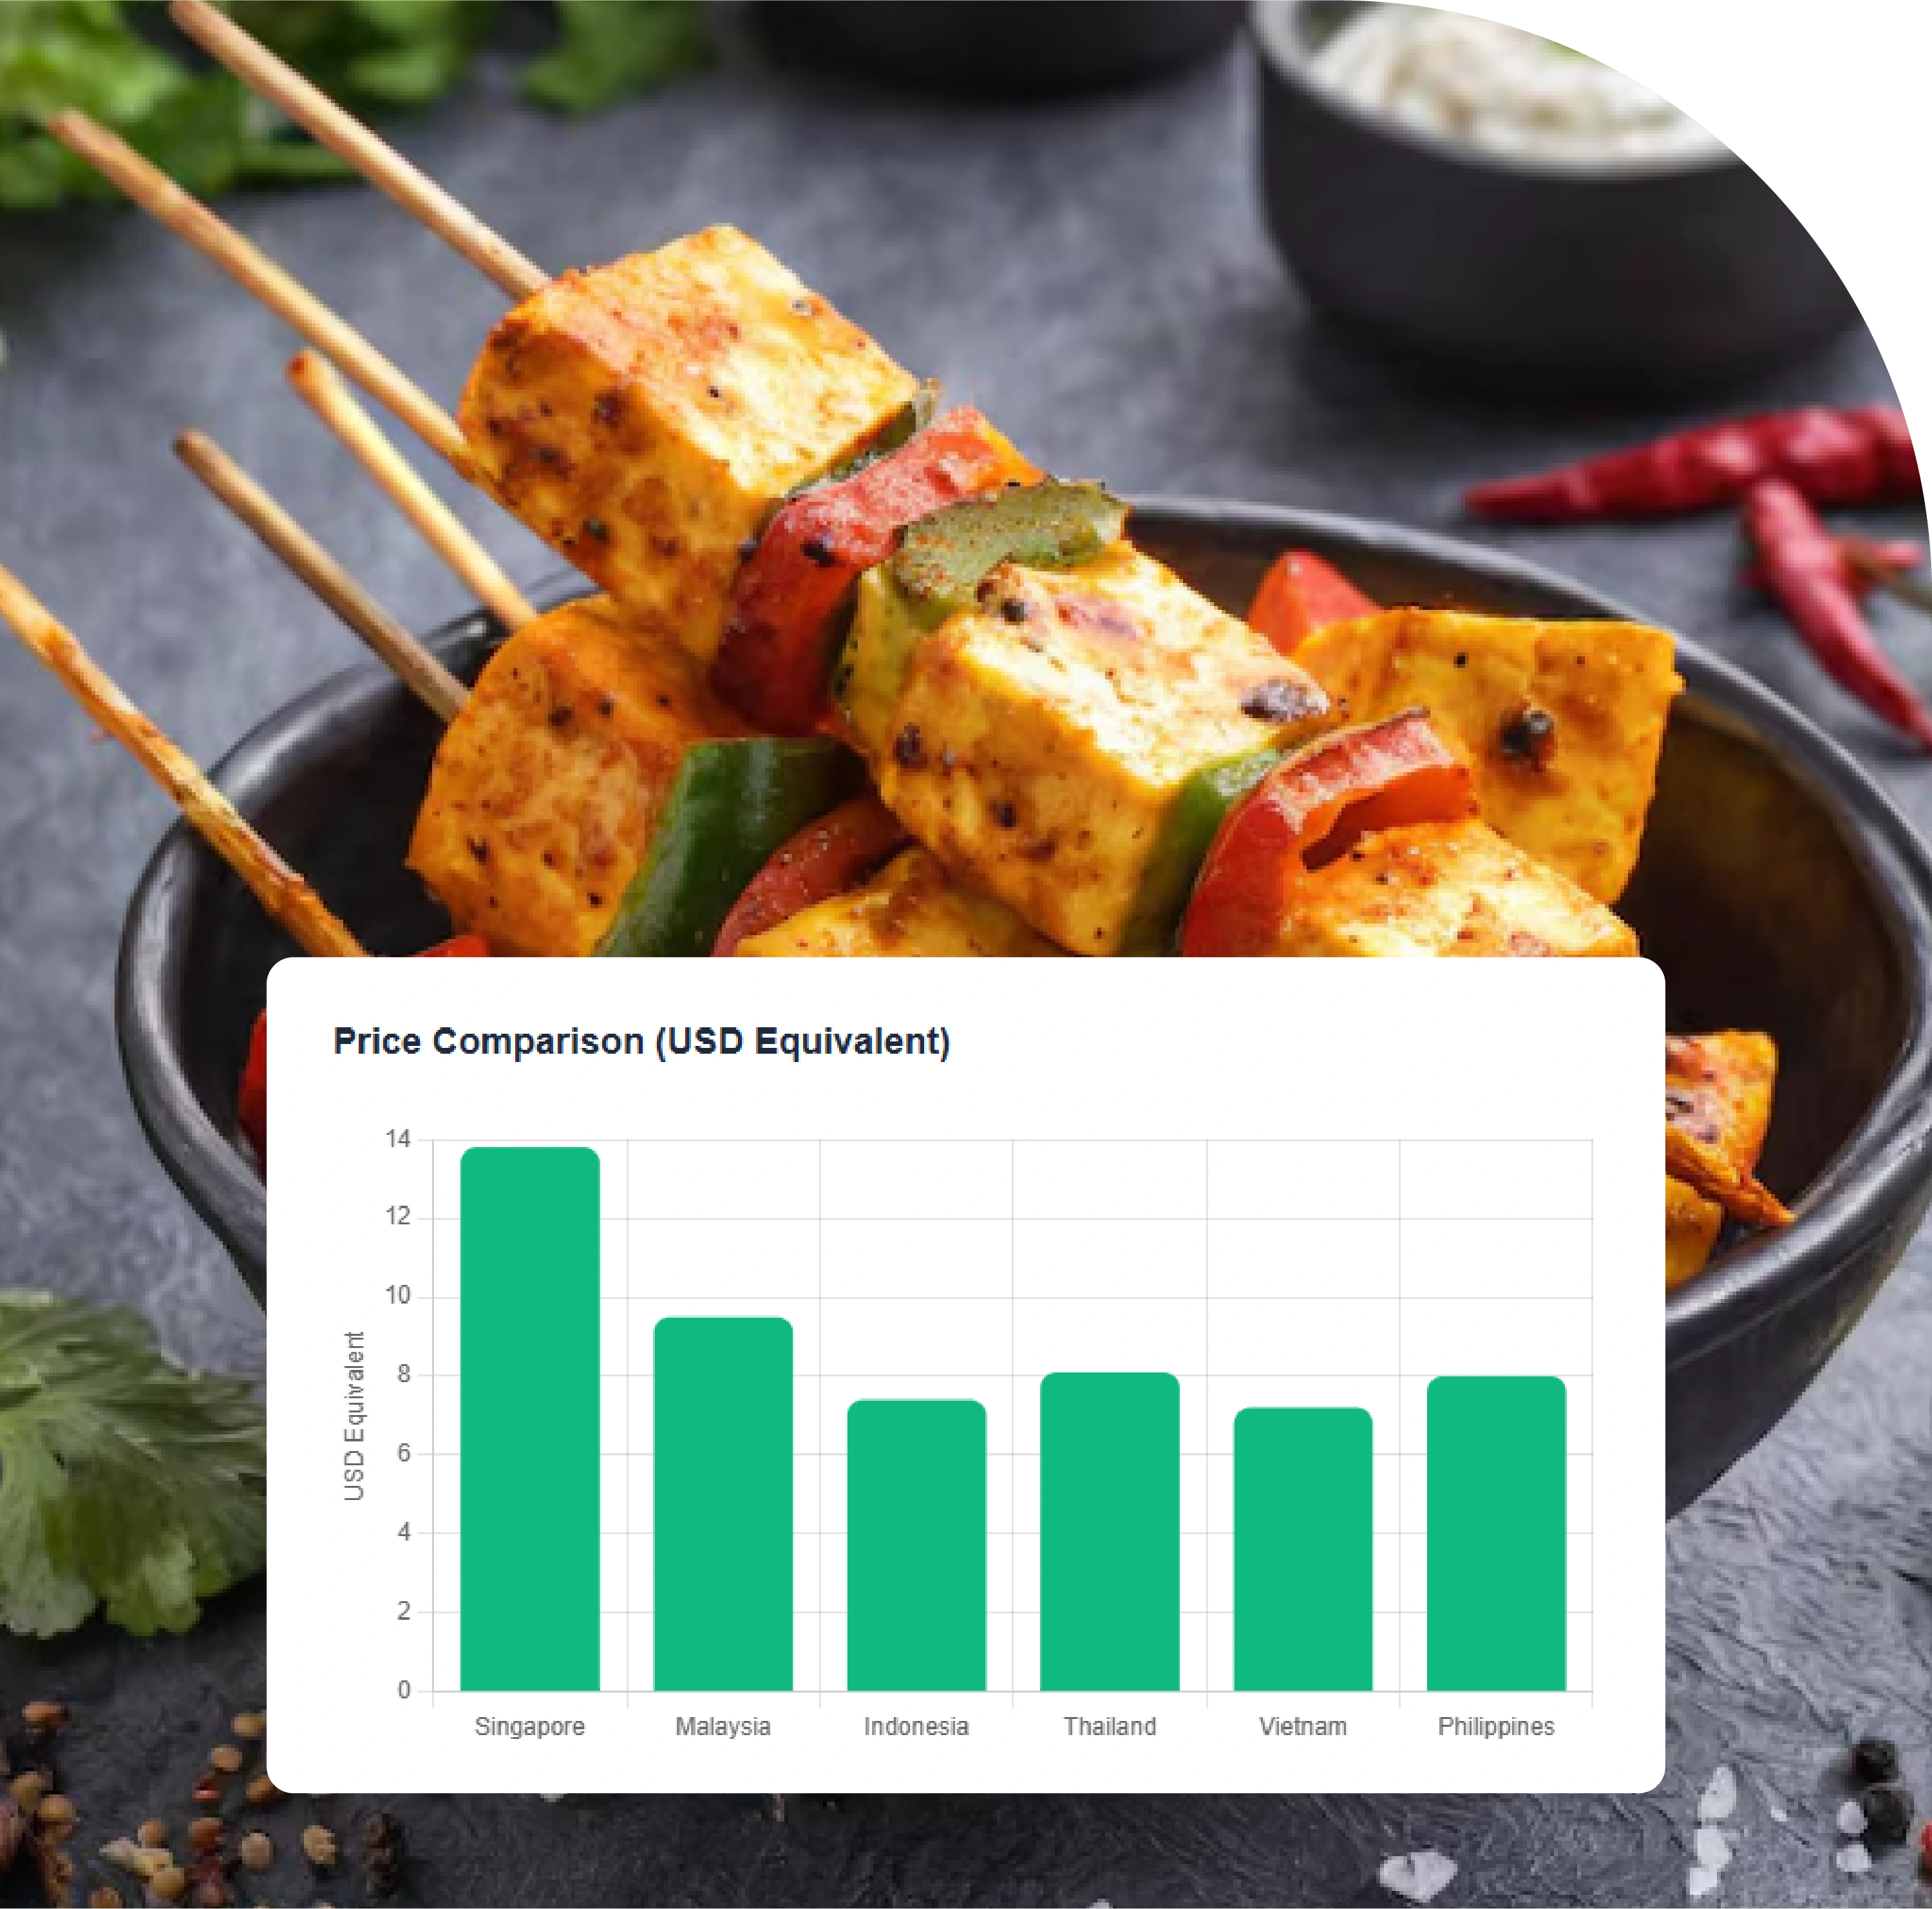
The GrabFood Price Data Extraction 2026 is a cross-country pricing study that tracks how the same dish is priced across six Southeast Asian markets where GrabFood operates: Singapore, Malaysia, Thailand, Indonesia, Vietnam, and the Philippines. By selecting a basket of standardized dishes — ones that appear on GrabFood in every country — and observing their listed prices across thousands of merchants and dozens of city anchors, the study reveals a structural pattern that no aggregated market report can convey: the same dish can cost two-and-a-half times more in one country than in another, and the gap is not random.
This report walks through the methodology behind the GrabFood Price Data Extraction 2026, the six dishes selected for cross-country comparison, observed price ranges in both local currency and USD-equivalent, the structural drivers explaining the gaps, and the commercial implications for restaurant brands, franchise operators, FMCG suppliers, cloud kitchen platforms, and investors operating across Southeast Asia.
The work is delivered by Food Data Scrape, an infrastructure provider specializing in clean, harmonized food delivery data at regional scale. The Index is refreshed quarterly; the values shown here reflect Q2 2026 capture across more than 50,000 merchants region-wide.
For a long time, Southeast Asian food and beverage strategy was discussed as if "Southeast Asia" were a single market. In reality, every country GrabFood operates in is a distinct economy with its own GDP per capita, consumer disposable income, currency dynamics, food culture, delivery ecosystem maturity, and competitive intensity. Brands that price the same SKU identically across the region typically over-charge in some markets and leave money on the table in others — both outcomes hurt margins and consumer perception.
A robust GrabFood Price Data Extraction 2026 unlocks several decisions that aggregated reports cannot answer.
Pricing strategy across markets: When a regional brand prices a signature dish at SGD 8 in Singapore but the equivalent dish in Vietnam lists at the USD equivalent of $2.50, the brand needs to decide whether the gap is intentional positioning or accidental drift. The Index makes the gap visible.
Franchise expansion planning: For brands evaluating new market entry, knowing the price-band for comparable dishes in the target country is foundational. The Index provides realistic pricing benchmarks for menu design before the first store opens.
Margin analysis at country level: With ingredient costs typically denominated in USD or regional commodity prices, country-level pricing data lets analysts model gross margin per dish per country — a critical input for portfolio decisions.
Trend detection: Year-on-year movement in the Index reveals where pricing is inflating fastest, where promotional intensity is compressing realized prices, and where new entrants are reshaping competitive dynamics.
Investor due diligence: Investors evaluating Southeast Asian restaurant groups, cloud kitchen operators, or food delivery platforms benefit from hard cross-country data that validates revenue-per-order assumptions during diligence.
This is exactly the gap that systematic cross-country pricing intelligence fills.
The GrabFood Price Data Extraction 2026 rests on a carefully designed sampling and harmonization methodology that delivers cross-country comparability while respecting each market's culinary identity.
Dish selection: Six dishes were chosen for the Index, each meeting three criteria: meaningful availability on GrabFood across all six countries, recognizable consumer profile, and clear definitional boundaries that survive cross-country translation. The selected dishes are Chicken Rice (single portion), Fried Rice with Chicken (standardized portion), Beef Burger Combo Set (mid-tier chain comparable), Pizza Regular Margherita (12-inch equivalent), Cappuccino (standard cup), and Bubble Milk Tea (large cup).
Merchant sampling: Within each country, dishes were sampled across the highest-velocity 500 merchants per dish per metropolitan area, with city anchors covering Singapore, KL plus Penang plus JB, Bangkok plus Chiang Mai, Jakarta plus Surabaya plus Bandung, HCMC plus Hanoi, and Manila plus Cebu plus Davao.
Currency normalization: Listed prices were captured in local currency and converted to USD using period-average exchange rates. Both currencies are reported in the tables that follow.
Tax handling: Each country has different VAT or GST treatment of displayed prices. The Index reports tax-inclusive consumer-facing prices, matching what shoppers actually see and pay at checkout.
Outlier filtering: The top and bottom 5 percent of listings by price were excluded to remove anomalies such as ultra-premium positioning, promotional misprices, and obvious data errors. The remaining 90 percent forms the comparable base.
Refresh cadence: The Index is refreshed quarterly. Within each quarter, top-velocity merchants are captured daily, while long-tail merchants are captured weekly. Q2 2026 data is presented in this report.
Quality assurance: Every captured record passes schema validation, brand-name disambiguation, dish reclassification, currency normalization, and outlier detection before entering the Index.
The following sample tables represent the core of the Q2 2026 Index. All prices are tax-inclusive, reflecting what consumers pay at checkout.
| Dish | Singapore | Malaysia | Thailand | Indonesia | Vietnam | Philippines |
|---|---|---|---|---|---|---|
| Chicken Rice (single) | $4.85 | $3.10 | $2.75 | $2.30 | $2.55 | $3.15 |
| Fried Rice w/ Chicken | $5.20 | $3.40 | $2.85 | $2.40 | $2.60 | $3.30 |
| Beef Burger Combo | $9.80 | $6.20 | $5.10 | $4.60 | $4.85 | $6.10 |
| Pizza Margherita 12" | $14.50 | $9.20 | $8.10 | $6.80 | $7.20 | $9.40 |
| Cappuccino | $5.10 | $3.20 | $2.85 | $2.30 | $2.40 | $3.10 |
| Bubble Milk Tea (L) | $5.40 | $3.60 | $3.20 | $2.70 | $2.95 | $3.60 |
| Dish | SGD (SG) | MYR (MY) | THB (TH) | IDR (ID) | VND (VN) | PHP (PH) |
|---|---|---|---|---|---|---|
| Chicken Rice (single) | 6.50 | 14.00 | 95.00 | 38,000 | 65,000 | 180.00 |
| Fried Rice w/ Chicken | 7.00 | 15.40 | 98.00 | 39,500 | 66,000 | 188.00 |
| Beef Burger Combo | 13.20 | 28.00 | 175.00 | 75,500 | 124,000 | 348.00 |
| Pizza Margherita 12" | 19.50 | 41.50 | 280.00 | 112,000 | 184,000 | 535.00 |
| Cappuccino | 6.80 | 14.50 | 98.00 | 38,000 | 61,500 | 178.00 |
| Bubble Milk Tea (L) | 7.20 | 16.20 | 110.00 | 44,500 | 75,500 | 205.00 |
| Dish | Highest | Lowest | Ratio (High/Low) |
|---|---|---|---|
| Chicken Rice | Singapore ($4.85) | Indonesia ($2.30) | 2.11x |
| Fried Rice w/ Chicken | Singapore ($5.20) | Indonesia ($2.40) | 2.17x |
| Beef Burger Combo | Singapore ($9.80) | Indonesia ($4.60) | 2.13x |
| Pizza Margherita 12" | Singapore ($14.50) | Indonesia ($6.80) | 2.13x |
| Cappuccino | Singapore ($5.10) | Indonesia ($2.30) | 2.22x |
| Bubble Milk Tea (L) | Singapore ($5.40) | Indonesia ($2.70) | 2.00x |
| Country | Primary City | Secondary City Avg |
|---|---|---|
| Singapore | $4.85 (island-wide) | n/a |
| Malaysia | $3.20 (KL) | $2.95 (Penang/JB avg) |
| Thailand | $2.95 (Bangkok) | $2.55 (Chiang Mai) |
| Indonesia | $2.45 (Jakarta) | $2.10 (Surabaya/Bandung avg) |
| Vietnam | $2.65 (HCMC) | $2.40 (Hanoi) |
| Philippines | $3.30 (Metro Manila) | $2.85 (Cebu/Davao avg) |
| Country | Share with Active Promo | Avg Promo Discount |
|---|---|---|
| Singapore | 24% | 14% |
| Malaysia | 31% | 17% |
| Thailand | 35% | 19% |
| Indonesia | 48% | 22% |
| Vietnam | 41% | 20% |
| Philippines | 38% | 18% |
These samples represent a small slice of the millions of records captured across the six markets each quarter.
The data tells a clear, structural story about Southeast Asian food delivery pricing. Several findings are particularly important for commercial decision-making.
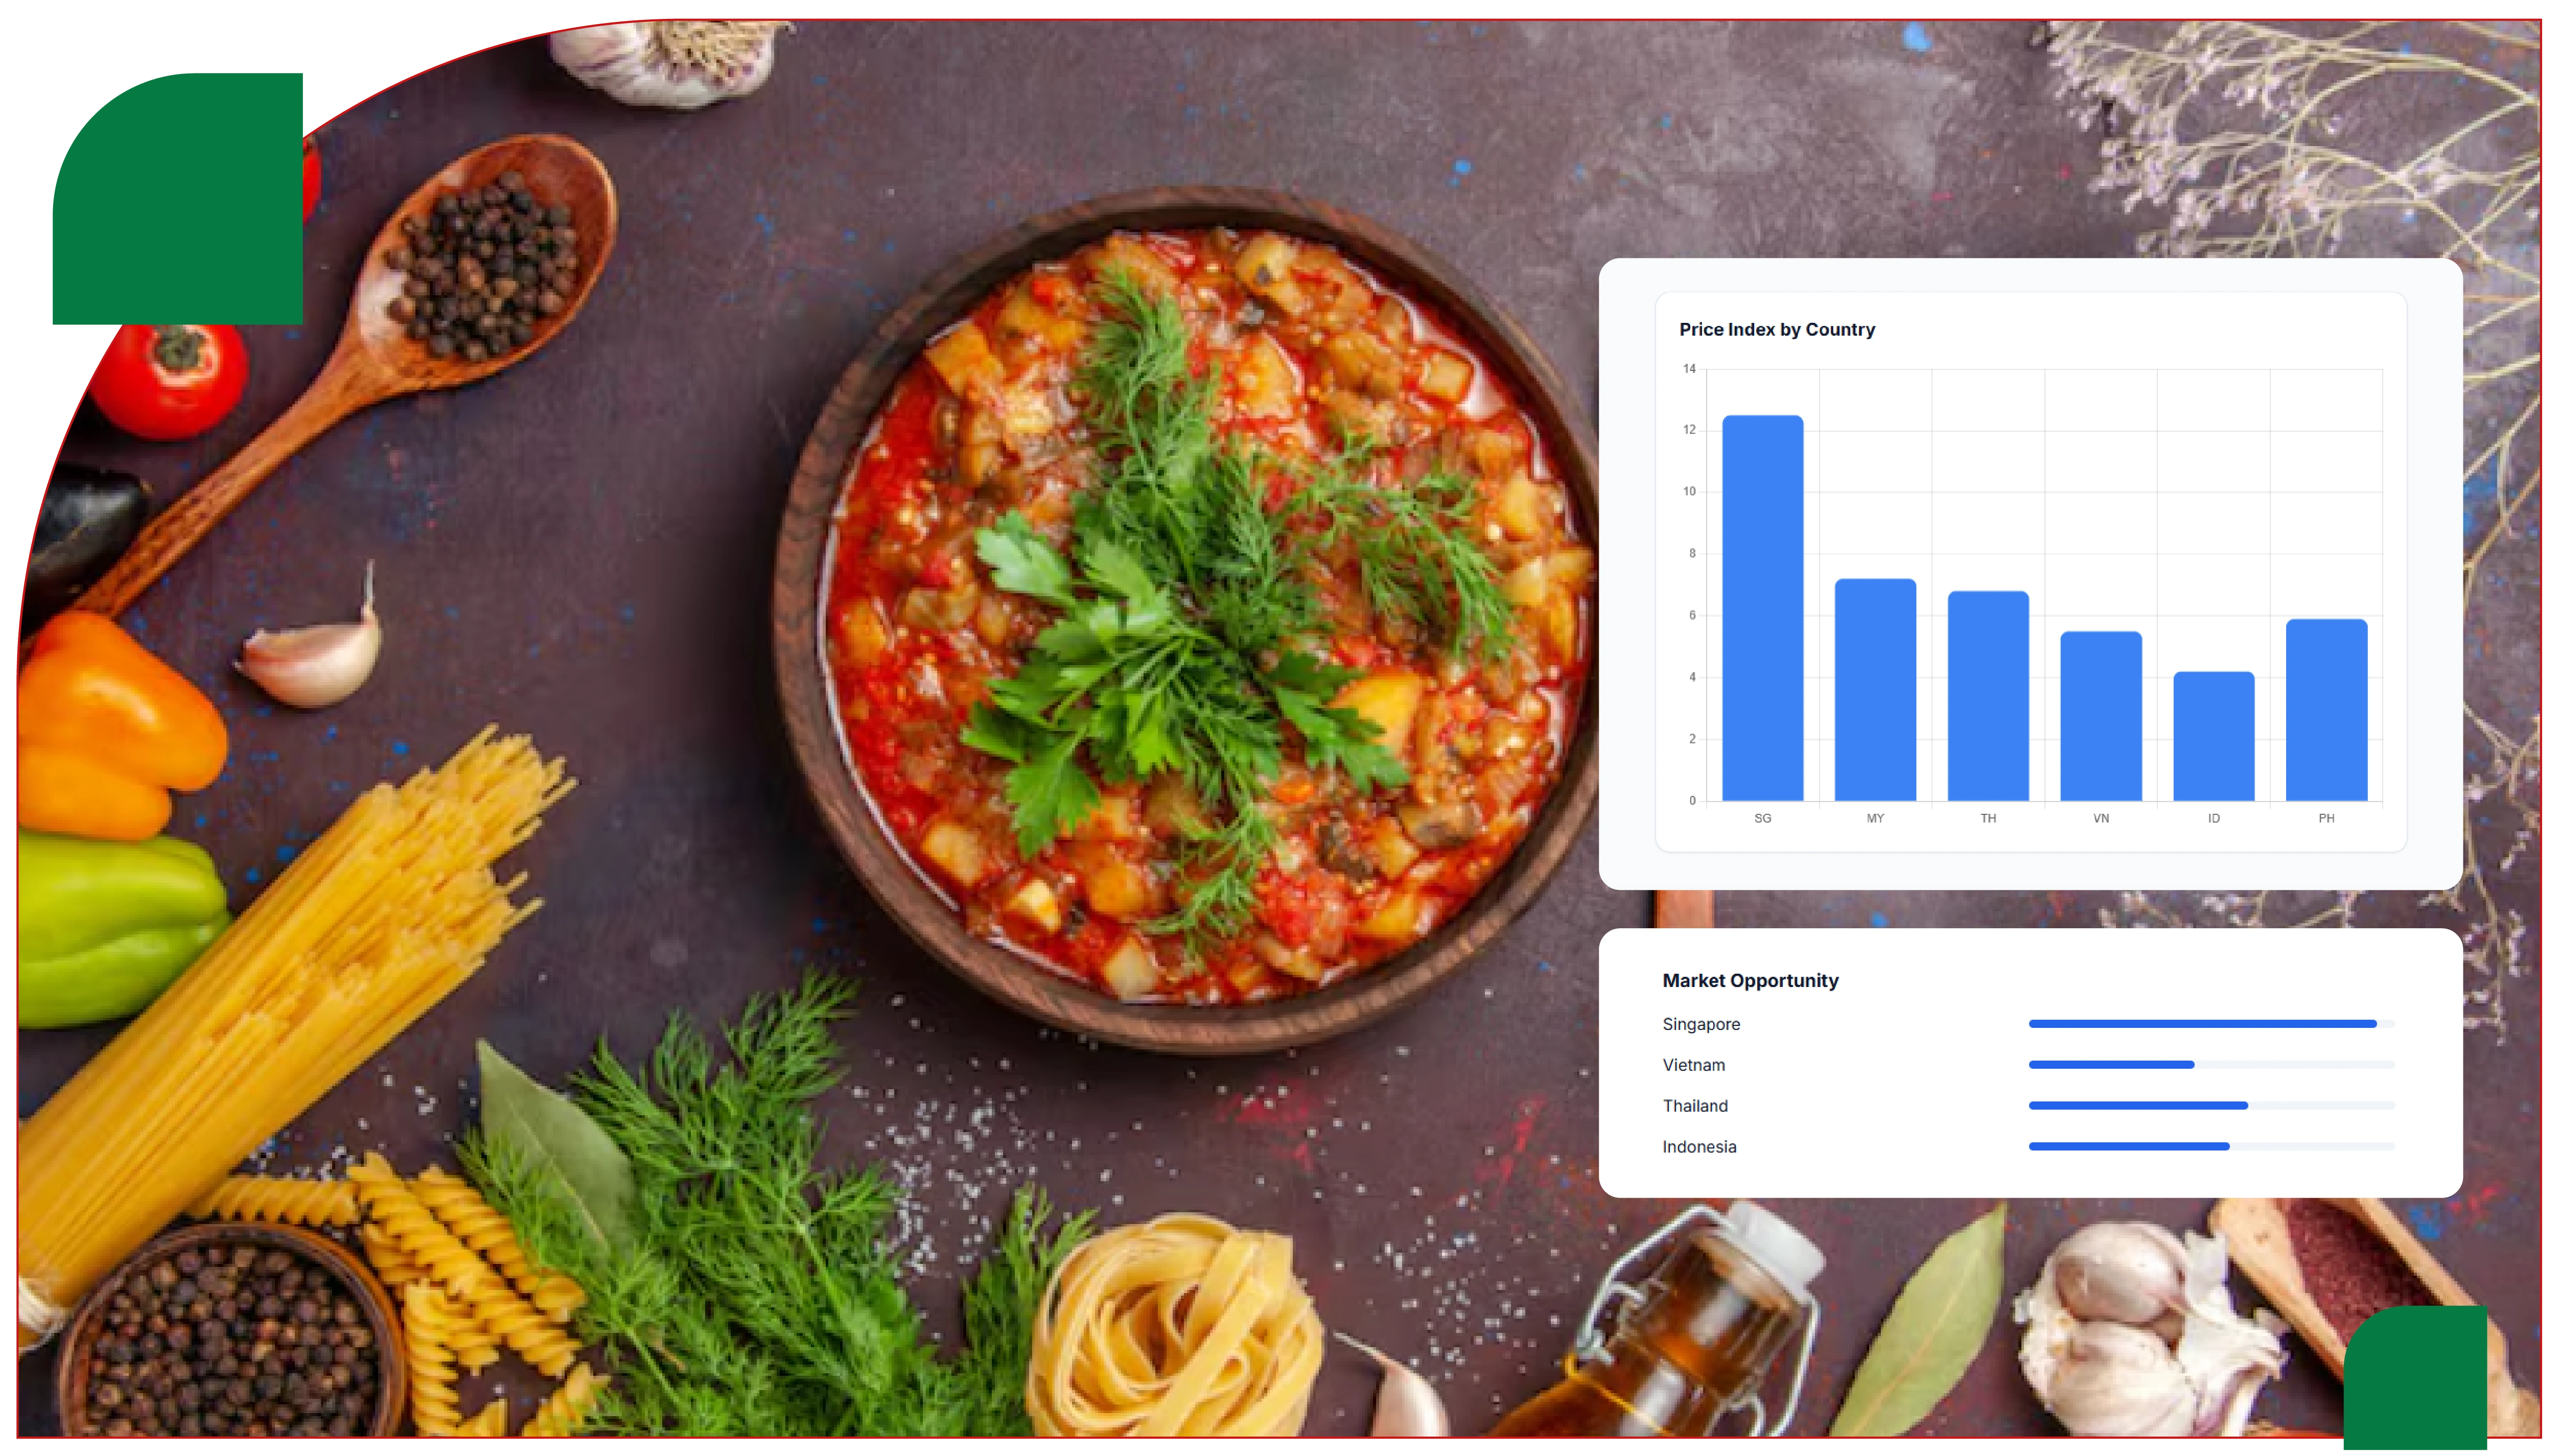
The price gap between top and bottom countries clusters around 2.0x to 2.2x: Across every dish in the Index, Singapore prices land roughly twice the level of Indonesia, the lowest-priced market. This consistency suggests that the gap reflects fundamental economic differences — GDP per capita, currency strength, operating costs, consumer purchasing power — rather than category-specific or dish-specific dynamics.
Singapore consistently anchors the top of the Index: Across all six dishes, Singapore registers the highest listed price. This reflects the city-state's high GDP per capita, expensive real estate driving up restaurant overheads, premium consumer expectations, and a strong currency that translates local prices into elevated USD equivalents.
Indonesia consistently anchors the bottom: ndonesia delivers the lowest USD-equivalent prices across every dish, reflecting the country's much lower GDP per capita, an enormous tail of small warung merchants serving price-sensitive consumers, and a currency that converts to favorable USD values for cross-country buyers but downward pressure on average ticket sizes.
Malaysia and the Philippines occupy a similar middle tier: Despite different geographies and culinary traditions, Malaysia and the Philippines price comparably across all six dishes, suggesting similar economic positioning and middle-income consumer demand patterns.
Thailand and Vietnam cluster around USD 2.50 to 3.20 for staples: The two mainland Southeast Asian markets price closer to each other than to either Singapore or Indonesia, occupying a distinct tier characterized by strong local cuisine cultures and growing-but-not-yet-saturated delivery markets.
Within-country city variation is meaningful but smaller than cross-country variation: Provincial cities consistently price 10 to 25 percent below capital cities, but the within-country gaps never exceed the cross-country gaps. This validates that the GrabFood Price Data Extraction 2026 is measuring true economic differences, not merely metropolitan premium effects.
Promotional intensity rises as price level falls: Indonesia shows the highest share of merchants with active promotions at 48 percent, while Singapore shows the lowest at 24 percent. This pattern indicates that price-sensitive markets compete more heavily on promotion, while higher-income markets compete on quality, brand, and convenience signals.
Pizza shows the widest absolute USD spread: With Singapore listing at $14.50 and Indonesia at $6.80, the pizza category exposes a USD 7.70 absolute gap — the largest in the Index. Categories with imported ingredient dependencies (cheese, flour, tomatoes processed in specific facilities) tend to amplify cross-country gaps because supply-chain costs do not scale down as aggressively as labor costs.
Bubble tea shows the tightest ratio at 2.00x: Despite originating in Taiwan and becoming a regional category, bubble tea has matured into a more standardized format across SEA, with localized ingredient sourcing that compresses the cross-country spread relative to other categories.
Several macro and micro drivers explain the Index pattern.
GDP per capita: Singapore's GDP per capita is approximately 25 to 35 times higher than Indonesia's. While the dish-level price gap is only about 2x, the relationship between income and food spending is non-linear — consumers in lower-income markets allocate a higher share of income to food, partially compensating for the lower absolute prices.
Real estate and operating costs: Restaurant rent in central Singapore can run 5 to 10 times higher per square meter than equivalent commercial space in Jakarta or Manila. Even before considering labor and ingredients, this baseline cost difference flows directly into menu pricing.
Labor economics: Minimum and effective wages differ substantially across the six countries, with Singapore and Malaysia anchoring the higher end and Vietnam, Indonesia, and the Philippines at lower levels. Food preparation is labor-intensive; wage gaps translate directly into pricing gaps.
Ingredient supply chain: Categories that rely on imported ingredients (cheese, processed meats, premium oils, specialty sauces) show wider cross-country gaps than categories built around locally-sourced raw materials. This is why pizza and burgers show wider gaps than chicken rice and fried rice.
Platform commission structures: GrabFood applies different commission structures across countries. While the consumer-facing price reflects all of this, merchants in higher-commission environments may price slightly higher to preserve margin.
Currency volatility: Period-to-period changes in exchange rates produce apparent price movement in USD even when local-currency pricing is stable. The Q2 2026 snapshot reflects exchange rate conditions at the time of capture.
Consumer income elasticity: In lower-income markets, consumers tolerate less price elasticity on food delivery, which constrains how aggressively merchants can price. In higher-income markets, premium positioning is rewarded, allowing wider price differentiation.
Tourism and expat dynamics: Cities with significant expat or tourist flows (Singapore, central Bangkok, parts of HCMC) sustain higher prices because a meaningful share of consumers tolerate price levels closer to their home-country expectations.
The GrabFood Price Data Extraction 2026 has direct implications for several commercial functions.
For regional restaurant brands: A brand operating in all six countries should not price the same dish identically across markets unless it has clear strategic reasons (premium positioning, ingredient consistency, brand discipline). Index data provides realistic pricing benchmarks per country to anchor menu engineering decisions.
For market entrants: A brand considering Southeast Asian expansion can use the Index to size the addressable price band in each target country before signing leases or appointing partners. The Index also informs which markets are easier or harder to enter from a margin perspective.
For franchise operators: Franchise contracts often include pricing guidelines. The Index provides defensible benchmarks against which franchisee compliance can be measured. Where franchisees deviate meaningfully from country medians, the Index flags the variance for further investigation.
For FMCG and ingredient suppliers: Suppliers selling into Southeast Asia can use the Index to understand which categories tolerate higher ingredient costs and which compress margins. This informs both pricing strategy and product portfolio decisions at country level.
For cloud kitchen platforms: Cloud kitchen operators run multiple virtual brands across delivery-native categories. Knowing the realistic price bands per dish per country helps them calibrate their virtual brand portfolios.
For investors and M&A teams: Investors evaluating Southeast Asian F&B businesses can validate revenue-per-order assumptions against Index benchmarks. When a portfolio company claims an average order value that diverges sharply from the country-level Index, the divergence merits investigation.
For consumer-facing comparison apps: Apps building price-comparison or smart recommendation features can use the Index as a reference layer for what consumers should expect to pay in each country.
The Q2 2026 snapshot captures a moment in a constantly evolving market. Several trends are likely to influence the Index in upcoming quarters.
Indonesia's premiumization curve: Indonesia continues to grow its middle-income consumer base. Cloud kitchen operators and international chains are expanding into Jakarta and secondary cities. Over the next several quarters, expect the Indonesia tier to drift upward, narrowing the gap with Vietnam and Thailand.
Singapore's plateau: Singapore prices have grown more slowly than other markets in recent quarters, reflecting both consumer price sensitivity and intense competition among delivery platforms. Expect the Singapore tier to remain elevated but not to accelerate.
Philippines volatility: The Philippines exhibits the highest within-country variation of any market in the Index, reflecting its archipelagic geography and uneven economic development. As Cebu and Davao continue urbanizing, expect Manila-versus-province gaps to compress.
Promotional cycle intensification: Across every market, promotional intensity is rising as platforms compete for share. Expect realized prices (after promotion) to track lower than listed prices, with the gap widening particularly in Indonesia and Vietnam.
Sustainability premium emergence: Plant-based, sustainable-sourcing, and ethical-supply-chain positioning is starting to command modest price premiums in Singapore, Bangkok, and HCMC. The next Index update will track whether this premium becomes statistically meaningful.
Building a regional price index across six Southeast Asian countries is a non-trivial undertaking. It requires sustained engineering investment across multiple languages, careful dish definition and harmonization, currency-period management, ethical and compliant collection at scale, and analyst expertise to translate raw data into commercial insight. Most internal teams lack the resources to do this at the necessary depth and refresh cadence.
We bring managed infrastructure, ethical and compliant data collection practices, and deep domain expertise in Southeast Asian food and beverage. Advantages include compliance-first architecture, scalable extraction across millions of public pages daily, harmonized dish and cuisine taxonomies, near-real-time refresh on priority merchants, currency and tax-normalized output, dedicated analyst support familiar with each country's market dynamics, and out-of-the-box dashboards highlighting cross-country and within-country patterns. The team has supported regional restaurant chains, cloud kitchen operators, FMCG suppliers, investors, and research consultancies — bringing the practical experience of how scraped data drives real commercial outcomes.
The GrabFood Price Data Extraction 2026 confirms what many regional operators have suspected: Southeast Asia is not one market but six, with structural pricing differences of roughly 2x between the highest and lowest countries. These gaps are not random — they reflect economic fundamentals, supply chain realities, and consumer dynamics that persist across categories. Brands, distributors, suppliers, and investors who recognize this structural pattern and price accordingly will outperform those who treat the region as a single market.
The Index will continue to be refreshed quarterly, with future editions adding new dishes, expanding city coverage, and tracking how the cross-country gaps evolve over time. The brands and investors who succeed in Southeast Asian food and beverage in the years ahead will be those who build their strategy on structured, refreshed, cross-country data rather than country-by-country anecdote.
If you are ready to act on real Southeast Asian pricing intelligence instead of generalizations, get in touch with our team today.

