
Grocery prices in 2025 reflected a year of gradual stabilization mixed with category-level volatility. While overall inflation pressures softened, seasonal demand, global commodity movements, and supply-side factors continued to influence pricing across essential and non-essential grocery categories. This Grocery Category-Wise Price Index Report (Jan–Dec 2025) by Food Data Scrape presents a structured, month-by-month analysis of grocery price movements across major categories, powered by Grocery App Data Scraping services that capture real-time pricing trends. Using January as the base index (100), the report tracks how prices evolved throughout the year across leading online platforms through Grocery Delivery Scraping API Services and identifies which categories experienced sustained inflation, seasonal volatility, or relative stability.

Staples and household essentials remained the most price-stable categories
Fruits and vegetables showed the highest volatility due to seasonality and supply disruptions
Dairy and packaged foods experienced gradual, controlled inflation
Edible oil prices stayed sensitive to global commodity trends
Beverages followed clear seasonal pricing cycles
Promotions played a key role in managing consumer price perception
The year 2025 marked a critical transition phase for grocery pricing. While global inflation pressures softened compared to previous years, regional volatility, supply chain recalibration, climate impact on fresh produce, and shifting consumer behavior continued to influence prices across grocery categories.
This Grocery Category-Wise Price Index Report (Jan–Dec 2025) by Food Data Scrape presents a structured, month-by-month analysis of grocery price movements across major categories. Using January as the base index (100), the report tracks how prices evolved throughout the year and identifies which categories experienced sustained inflation, seasonal volatility, or relative stability.
The research is designed for retailers, FMCG brands, procurement teams, analysts, and policymakers who require a clear, data-backed view of grocery pricing trends in 2025, supported by an interactive Grocery Price Tracking Dashboard that enables continuous monitoring, comparison, and informed decision-making.
The primary goals of this report are to:
Food Data Scrape followed a consistent and transparent research framework.
Data Sources
Time Period
Index Construction
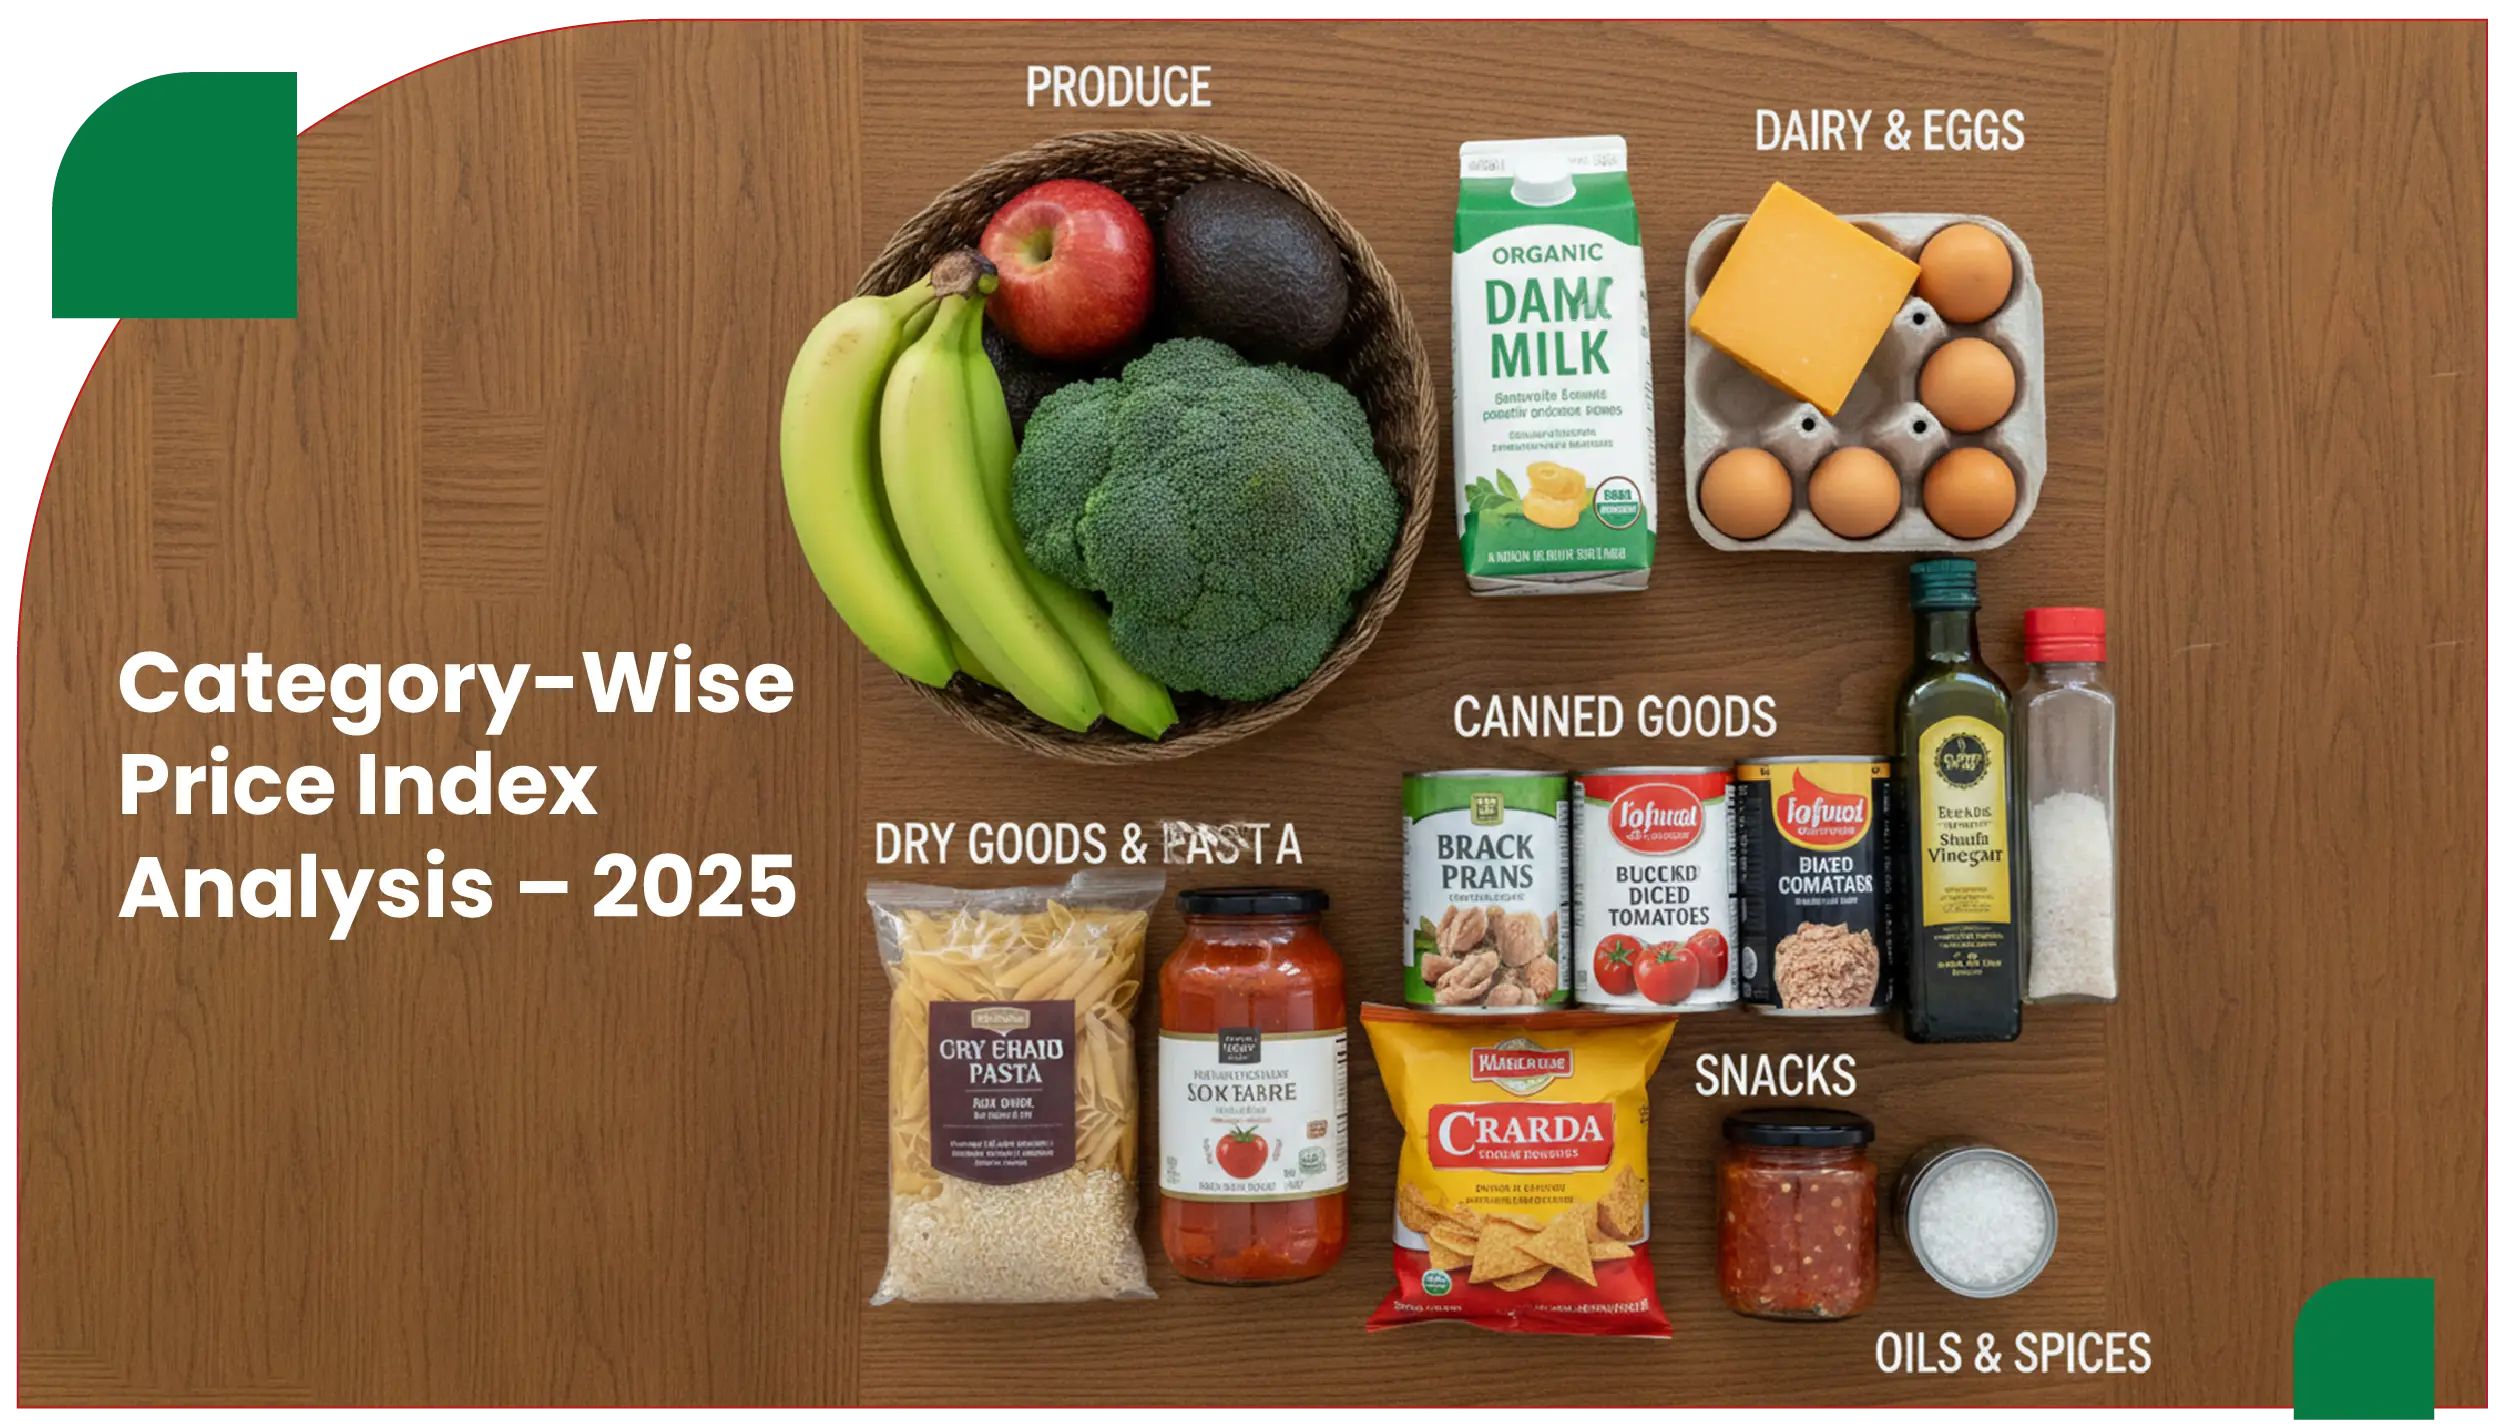
Categories Covered
Staples showed measured and controlled inflation throughout 2025. Government stock management and improved logistics helped limit extreme price movements.
Key Observations
Index Movement
Staples remained one of the most predictable categories in 2025.
Fresh produce remained the most volatile category in the grocery basket.
Key Observations
Index Movement
The wide range highlights the importance of short-term pricing intelligence for this category.
Dairy prices followed a steady upward trajectory in 2025.
Key Observations
Index Movement
Dairy emerged as a slow but consistent inflation contributor.
Edible oils continued to reflect global commodity sensitivity.
Key Observations
Index Movement
Even with stabilization, edible oils remained above their January baseline.
Packaged foods showed strategic pricing behavior by brands.
Key Observations
Index Movement
Brand-led pricing discipline helped control volatility.
Beverages followed a clear seasonal demand curve.
Key Observations
Index Movement
Seasonality remained the dominant pricing driver.
Household essentials were the most stable category in 2025.
Key Observations
Index Movement
This category acted as a pricing anchor for retailers.
| Category | Jan | Mar | Jun | Sep | Dec |
|---|---|---|---|---|---|
| Staples & Grains | 100 | 102 | 105 | 107 | 110 |
| Fruits & Vegetables | 100 | 112 | 120 | 97 | 115 |
| Dairy Products | 100 | 101 | 104 | 106 | 109 |
| Edible Oils | 100 | 110 | 114 | 109 | 112 |
| Packaged Foods | 100 | 101 | 103 | 105 | 107 |
| Beverages | 100 | 108 | 113 | 109 | 103 |
| Household Essentials | 100 | 101 | 102 | 103 | 104 |
Retailers
FMCG Brands
Market Research & Policy
Data & Analytics Teams
Food Data Scrape can deliver:
Custom methodologies and dashboards are available on request.
The Grocery Category-Wise Price Index Report for 2025 shows a market that is stabilizing but far from static. While essentials remained resilient, fresh categories and edible oils continued to inject volatility into household grocery spending. Seasonal demand, global inputs, and promotional strategies shaped how consumers experienced inflation throughout the year.
This research demonstrates how Food Data Scrape converts raw grocery pricing data into structured, decision-ready intelligence that supports smarter retail, FMCG, and policy planning.

