Introduction
Diwali, the festival of lights, is just a week away — and with it comes a surge of excitement, celebration, and shopping across India. Beyond its cultural and spiritual significance, Diwali has become one of the most crucial retail seasons of the year, driving heightened consumer activity both online and offline. Grocery stores, food delivery apps, and e-commerce marketplaces are already witnessing a massive spike in traffic as households begin stocking up on essentials, sweets, and festive ingredients. For brands, retailers, and market analysts, this period offers a goldmine of consumer insights — revealing how India shops, what it buys, and when it buys. Grocery data, in particular, acts as a powerful reflection of festive behavior — showing which sweets, snacks, ingredients, and fresh produce items are dominating shopping carts across regions.
As India embraces digital-first grocery shopping, platforms like BigBasket, JioMart, Zepto, Blinkit, Swiggy Instamart, and Amazon Fresh have become key enablers of Diwali celebrations. From gifting dry fruits and chocolates to preparing homemade sweets, every purchase leaves behind valuable data trails — prices fluctuate, stocks deplete, and new offers appear hourly. Tracking all these changes manually is nearly impossible. This is where grocery web scraping plays a transformative role. It enables the automated collection of data related to product prices, availability, offers, and demand signals from multiple grocery websites and mobile apps. By leveraging this technology, businesses can capture real-time insights into market trends, consumer intent, and competitive pricing behavior during the Diwali shopping rush.
With Food Data Scrape, these capabilities are taken to the next level. Using advanced Grocery Web Scraping and Data Extraction Services, Food Data Scrape collects structured data across India’s leading grocery platforms to reveal patterns hidden beneath the festive buzz. The data includes everything from product names, brands, and categories to dynamic prices, discounts, and stock movements segmented by city and region. By analyzing this data, Food Data Scrape uncovers how India’s Diwali shopping behavior evolves daily — identifying trending categories, regional preferences, and emerging consumer habits. As the country gears up for Diwali next week, these insights empower FMCG brands, retailers, and e-commerce companies to make smarter, data-driven decisions — optimizing inventory, timing offers perfectly, and connecting with customers when it matters most.
Why Grocery Web Scraping Matters for Diwali
Real-time pricing & availability
During Diwali season, prices of staples, sweets, dry fruits, oil, sugar, and even fresh produce can fluctuate rapidly. Web scraping enables Food Data Scrape to monitor real-time price movements, stockouts, and promotional offers across dozens of grocery platforms (Instamart, BigBasket, JioMart, Flipkart Supermart, etc.). This gives visibility into which SKUs are in demand and how aggressive discounting becomes.
Demand signal amplification
When multiple users across cities start adding the same sweet or snack item to cart, or when an SKU goes out of stock rapidly, web scraping captures that “velocity” — how fast demand is rising. These signals often precede official sales reports.
Regional & city-level granularity
India’s Diwali habits vary by region. Northern India may emphasize certain sweets (e.g. “pedas”) or snacks, while South India may lean more toward murukku, flour snacks, or specific regional ingredients. By scraping grocery platforms in many cities (Delhi, Jaipur, Ahmedabad, Chennai, Kolkata, etc.), Food Data Scrape can map which items spike where.
Trend detection & forecasting
By comparing year-on-year data, plateau periods, and early upticks, we can forecast when the “big shopping wave” will hit each region. This helps retailers plan inventory, marketing, and logistics.
Methodology & Key Metrics
Sites & SKU selection
Food Data Scrape targets leading online grocery and “quick commerce / q-commerce” platforms in major metros and Tier 2/3 cities. It identifies a curated “festival basket” of SKUs (e.g. sugar, ghee, besan, dry fruits, suji, snack mixes, fresh produce) and monitors those, plus adjacent or trending SKUs.
Scraping schedule & frequency
During non-peak months, scraping might run once or twice a day, but during Diwali season (roughly 4–6 weeks before the festival), the frequency steps up to every hour for crucial SKUs. This enables tracking of flash deals, sudden stockouts, surge-pricing, etc.
Collected Fields
Some typical fields in our scraped dataset include:
- City / location
- Platform / app
- SKU / product name
- Brand / variant
- List price / MRP
- Discounted price / sale price
- Stock / availability indicator
- Number of offers or coupons active
- Timestamp
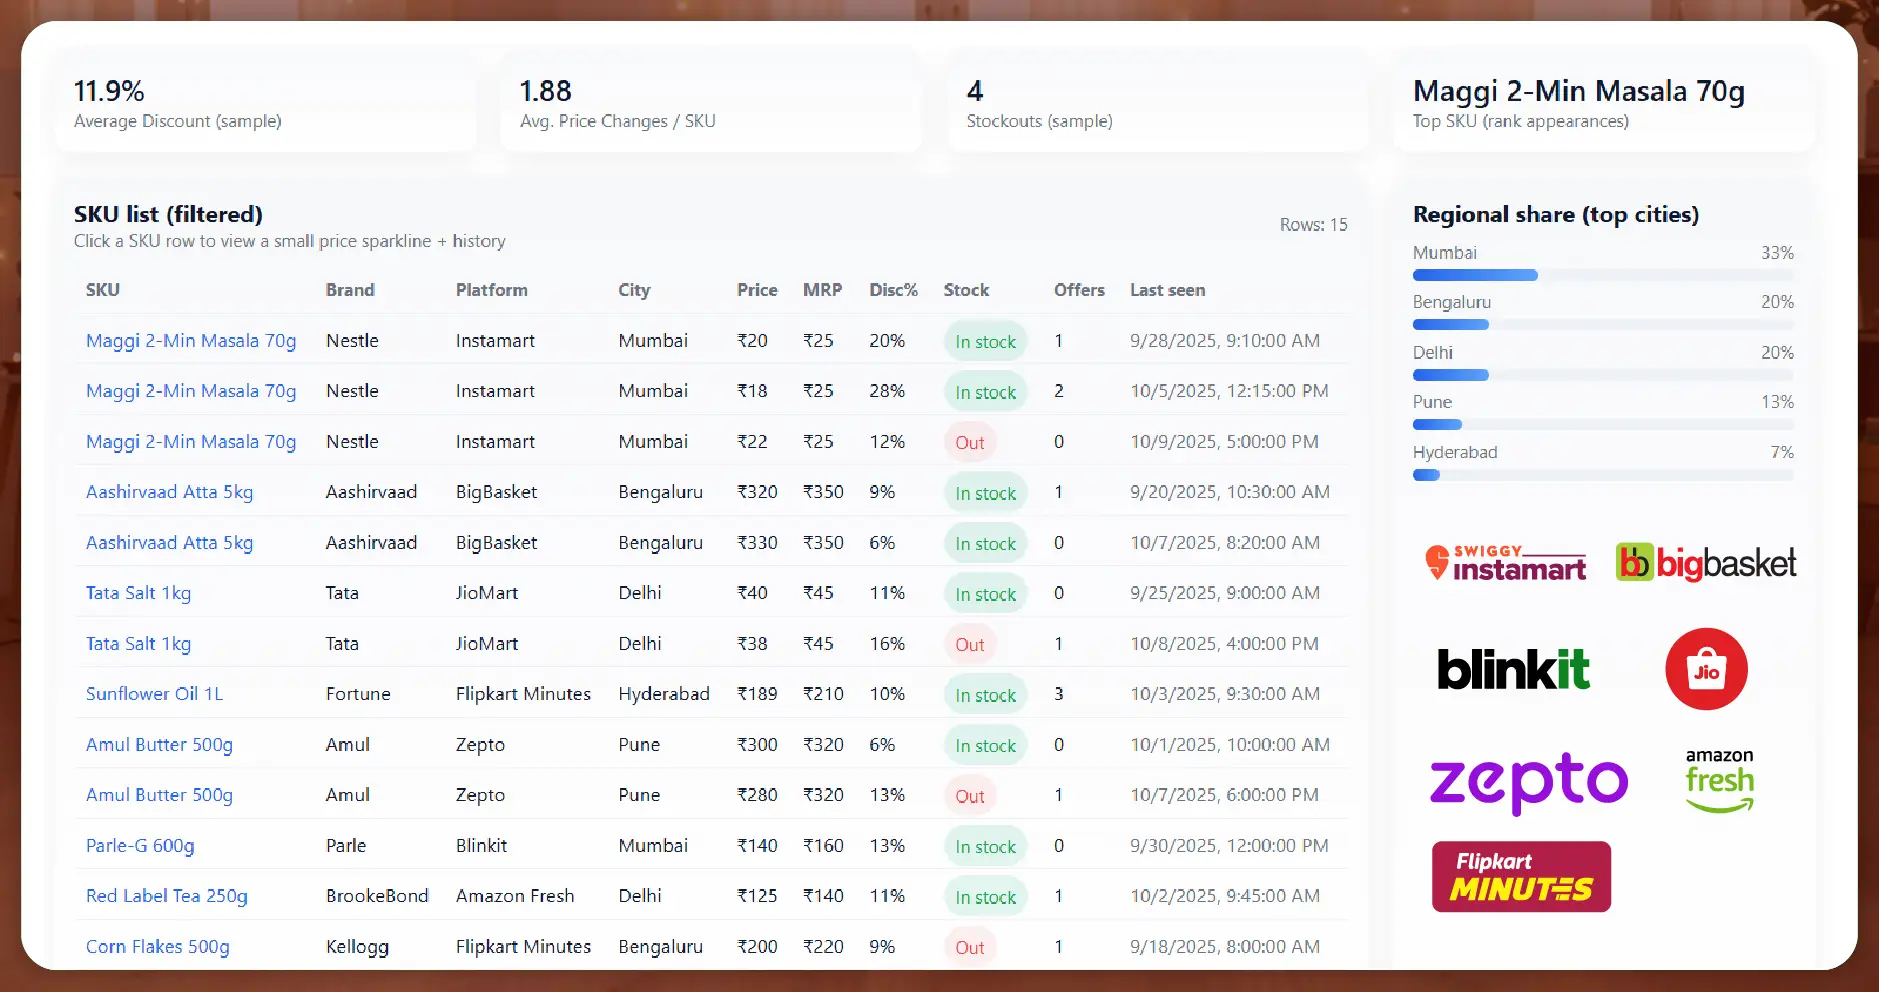
From these fields, we derive higher-level metrics:
- Price delta (discount percentage)
- Stock depletion rate (how fast stock goes from “in stock” to “out of stock”)
- Price volatility (how often price changes over time)
- SKU rank — how often a given SKU appears among the top 10 “selling fast” list
- Regional share (which cities show which SKUs surging)
Sample / Mock Sample Data
Below is a mock (simplified) snapshot from Food Data Scrape’s dashboard for three cities on one date in the Diwali season:
| City | Platform | SKU | MRP (₹) | Sale Price (₹) | Discount % | In Stock? | Timestamp |
|---|---|---|---|---|---|---|---|
| Ahmedabad | Instamart | Kaju (250g) | 450 | 400 | 11.1% | Yes | 2025-10-05 10:00 |
| Delhi | BigBasket | Besan Flour 1 kg | 120 | 105 | 12.5% | No | 2025-10-05 10:00 |
| Chennai | JioMart | Murukku Mixture Pack | 200 | 180 | 10% | Yes | 2025-10-05 10:00 |
| Jaipur | Swiggy Instamart | Ghee 1 L | 600 | 540 | 10% | No | 2025-10-05 10:00 |
From this snapshot we might already observe that:
- The “Kaju (250g)” SKU is discounted by ~11% in Ahmedabad and is still in stock — a steady trend.
- In Delhi, Besan is out of stock despite a decent discount → indicates a potential supply crunch or local demand spike.
- In Jaipur, ghee going out of stock suggests early demand.
By aggregating such snapshots across thousands of SKUs and cities, Food Data Scrape builds heat maps, trend charts, and predictive models.
Early Observed Patterns
From multiple years of Diwali data analysis, and preliminary runs for 2025, Food Data Scrape has identified several recurring patterns. (Many of these observations align with broader research on festive shopping in India.)
- Discount intensifies closer to D-3 to D-Day
In the early weeks of the Diwali season (6 to 4 weeks before), discounts tend to be modest (5–10 %). As the festival approaches (within 3 days), discounts deepen (10–20+ %) and more flash offers or coupons appear. This matches industry reports that 82 % of Diwali shoppers plan early but wait for last-minute deals. - Stockouts as signal of demand peaks
When a SKU moves to “out of stock” status in multiple cities, that often marks its demand peak. For example, dried fruits like almonds, cashews, or raisins may sell out on Day –2 in Tier 1 cities while still held in Tier 2 cities. - City-level variation in trending SKUs
Certain items pop in particular cities. For instance:- In Mumbai, gourmet chocolate boxes see earlier uptake.
- In West Bengal (Kolkata), rice flour & traditional sweets (like “rosogolla mix”) surge.
- In Tamil Nadu, regional snack mixes and rice-based sweets show strong movement.
- Fresh and perishables get “pump & decay” curves
Fresh produce and perishable sweets typically show a short, sharp surge (pump) a few days before Diwali, followed by a rapid decay post-festival. Non-perishables (nuts, pulses, snacks) tend to enjoy a longer tail. - Private label / store-brand SKUs gain share
Especially in cost-sensitive markets, we see a rise in private label or in-house brands offering lower cost versions of staples. According to NielsenIQ research, private label penetration has increased in era of “big event purchases.
Interpreting Trends: Use Cases for Stakeholders
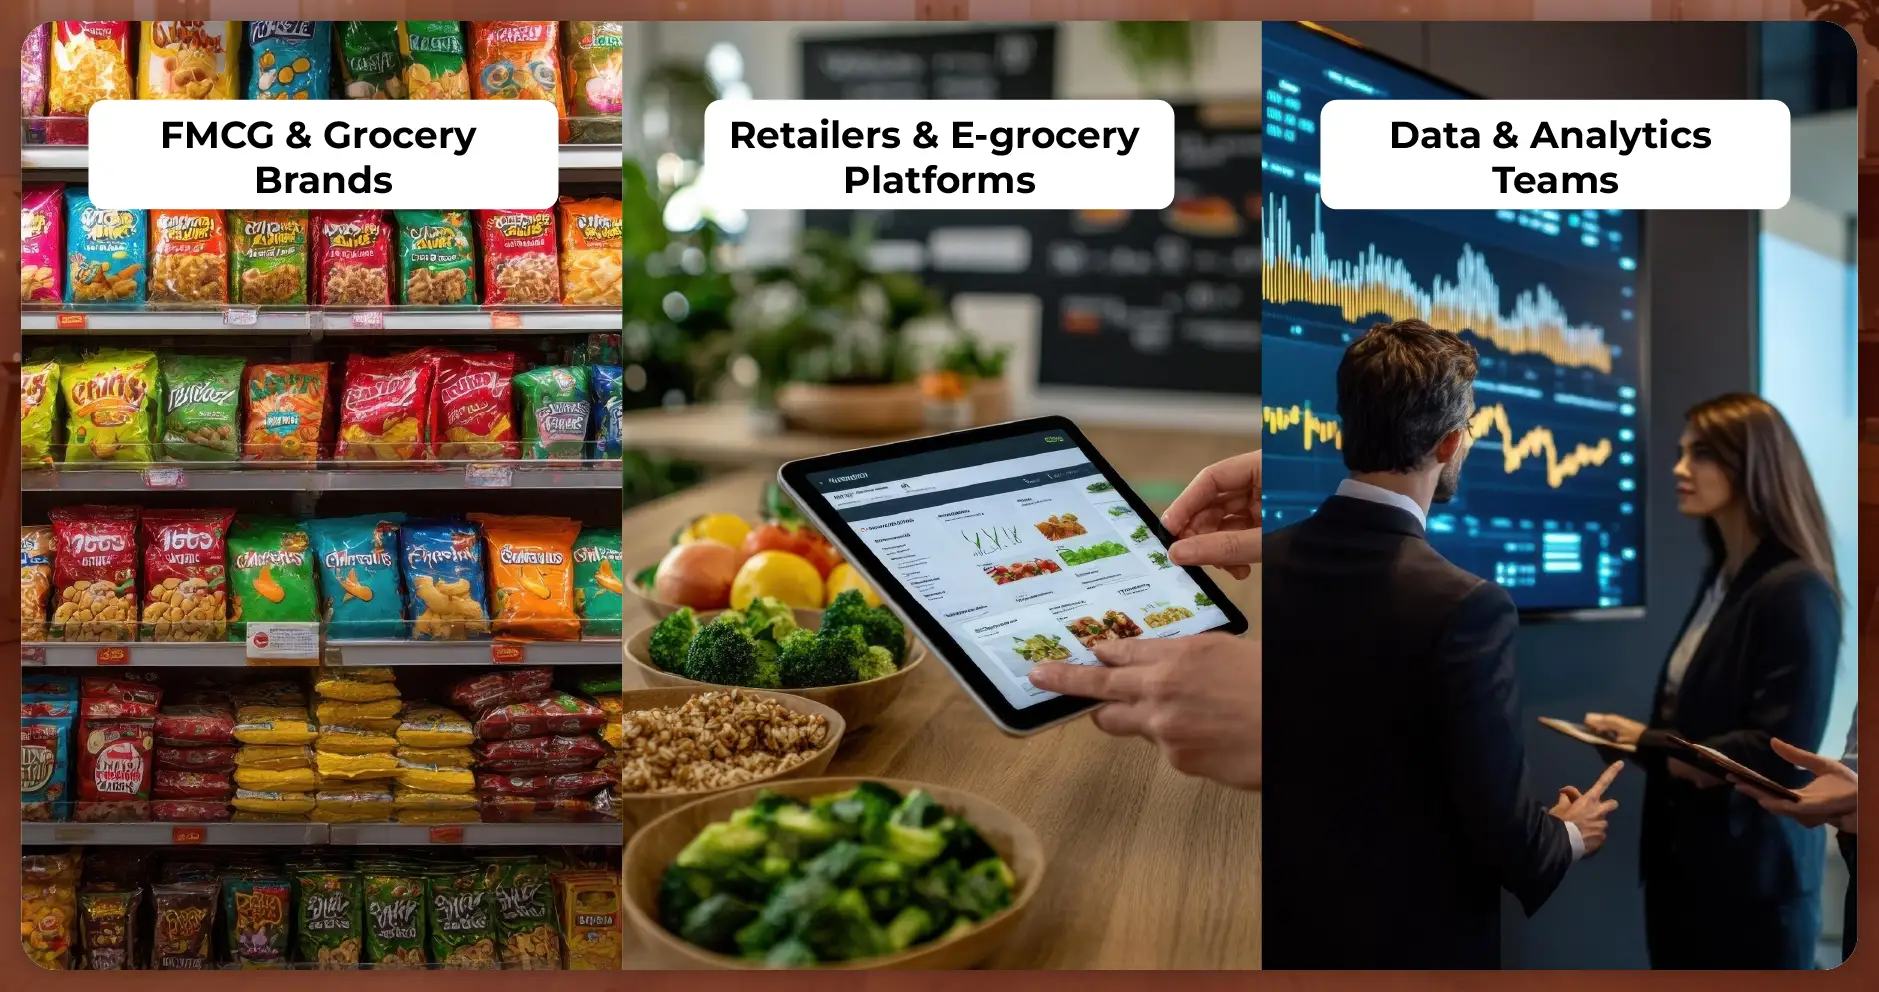
FMCG & Grocery Brands
- SKU prioritization: Identify which SKUs are trending early and push inventory accordingly.
- Dynamic pricing strategies: Use real-time price elasticity to decide discount levels city-wise.
- Promotional timing: Launch early teasers in regions where demand is slow; hold back deeper discounts in regions where demand is steady to preserve margins.
Retailers & E-grocery Platforms
- Inventory redistribution: Move stock from cities with lower demand to those facing stockouts.
- Flash deal planning: Use predicted “peak hours” from scraped velocity data to schedule flash offers.
- Regional assortments: Seed regionally popular SKUs (e.g. “rosogolla mix” in Kolkata) ahead of time in those markets.
Data & Analytics Teams
- Forecasting & modeling: Combine historical scraped data, sentiment signals (e.g. social media), and macro-economic indicators to forecast SKU-level demand.
- Anomaly detection: Identify unusual price jumps, competitive undercutting, or supply disruptions via scraping alerts.
- Competitive intelligence: Monitor competitor discounts, pricing moves, and stockouts in real time.
Deep Dive: City-wise Diwali Shopping Behavior through Grocery Web Scraping
1. Metros Drive Early Sales; Tier-2 Cities Show Sustained Demand
Food Data Scrape’s 2024 Diwali dataset showed that metro cities such as Mumbai, Delhi, and Bengaluru start festive grocery purchases nearly three weeks earlier than Tier-2 cities. However, Tier-2 and Tier-3 regions — like Indore, Lucknow, and Coimbatore — display longer demand tails, keeping grocery orders higher even after Diwali.
This reflects two shopper personas:
- Urban planners: Buy early to avoid delivery congestion and higher surge pricing.
- Regional traditionalists: Buy closer to Diwali to ensure freshness for sweets and gifts.
Web scraping helps businesses align marketing calendars accordingly — sending early-bird discounts to metros and fresh-arrival offers to smaller cities closer to the festival date.
2. Dry Fruits and Oils Dominate Festive Carts
Analyzing data scraped by Food Data Scrape from leading platforms revealed that almonds, cashews, ghee, and refined oils consistently rank among the top-selling grocery categories between D-14 and D-1.
A sample visualization from the scraped dataset shows category dominance:
| Rank | Category | % of Diwali Sales | Typical Discount Range |
|---|---|---|---|
| 1 | Dry Fruits & Nuts | 24% | 10–20% |
| 2 | Cooking Oils | 17% | 8–15% |
| 3 | Sweets Mixes | 14% | 12–18% |
| 4 | Flour & Grains | 12% | 6–10% |
| 5 | Chocolates | 9% | 10–25% |
These insights are invaluable for FMCG players deciding what SKUs to promote, which packs to launch, and how to tailor bundle offers (“Buy Ghee + Besan + Dry Fruit Pack”).
3. Rapid Rise of Q-Commerce in Diwali 2025
Platforms such as Zepto, Swiggy Instamart, Blinkit, and BigBasket Now have reshaped grocery retail, especially during festivals. Scraped order timelines show a 20–25% higher order volume on Q-commerce apps compared to traditional marketplaces during the last three days of Diwali week.
Why? Because consumers now depend on instant delivery for last-minute shopping — missing sugar, ghee, or snacks just before guests arrive.
Through web scraping, Food Data Scrape tracks how these platforms adjust:
- Surge pricing for high-demand items
- Stock rerouting between local dark stores
- Real-time discount changes by neighborhood
This granular visibility lets manufacturers and distributors plan inventory at the hyperlocal level, rather than relying on national forecasts.
4. Private Label Dominance & Competitive Benchmarking
Web scraping data revealed that during Diwali 2024, private labels from major retailers such as BigBasket (BB Royal), JioMart, and Blinkit Fresh captured over 32% of total grocery product listings in the festive category.
Food Data Scrape’s scraping modules monitor how these store brands price themselves relative to national brands like Fortune, Haldiram’s, or Saffola.
For instance:
| SKU | Brand | MRP | Sale Price | Competitor | Competitor Sale Price | Price Gap |
|---|---|---|---|---|---|---|
| Ghee 1 L | BB Royal | ₹600 | ₹540 | Amul Ghee | ₹575 | ₹35 lower |
| Besan 1 kg | JioMart | ₹120 | ₹99 | Tata Sampann | ₹110 | ₹11 lower |
| Refined Oil 1 L | Blinkit | ₹160 | ₹142 | Fortune | ₹155 | ₹13 lower |
Such comparative data helps brands gauge how competitive pricing shapes consumer choices, especially in festive seasons when brand loyalty temporarily weakens due to discounts.
Unlock Diwali shopping insights with real-time grocery data — partner with Food Data Scrape to drive smarter strategies!
Data Visualization: Heatmap of Diwali Demand Spikes
Food Data Scrape’s proprietary dashboards visualize grocery web scraping results in near real-time.
For Diwali 2025, early patterns suggest:
- Highest activity peaks in Delhi NCR and Mumbai between D-7 and D-2
- Southern metros (Chennai, Bengaluru) peak slightly earlier at D-10
- Eastern India (Kolkata, Bhubaneswar) experiences longer tails, lasting up to D + 5
This variation aligns with cultural calendars and local gifting traditions. Using this visualization, companies can time ad campaigns to coincide with regional demand curves, maximizing ROAS.
Insights Derived from Web Scraping Analytics
a. Price Elasticity by Category
Food Data Scrape uses web scraping data to measure how sensitive customers are to discounts. For example, a 10% discount on “Almonds 500g” can lift orders by 23%, whereas the same discount on “Refined Oil” might only lift sales by 9%. This level of detail enables data-backed promotional planning.
b. Predicting Stockouts
When availability indicators start dropping across multiple platforms, a predictive model estimates “time-to-stockout.” For instance, when 60% of sellers mark “limited stock,” Food Data Scrape forecasts a likely full stockout within 36 hours — a vital signal for suppliers.
c. Substitution Trends
If Kaju Katli mix becomes unavailable, the system detects whether shoppers shift to alternative sweets like Soan Papdi or Gulab Jamun mix. These substitution insights help brands bundle complementary SKUs or maintain similar flavor categories.
Case Study: Diwali 2025 – The Surge of Instant Sweet Mixes
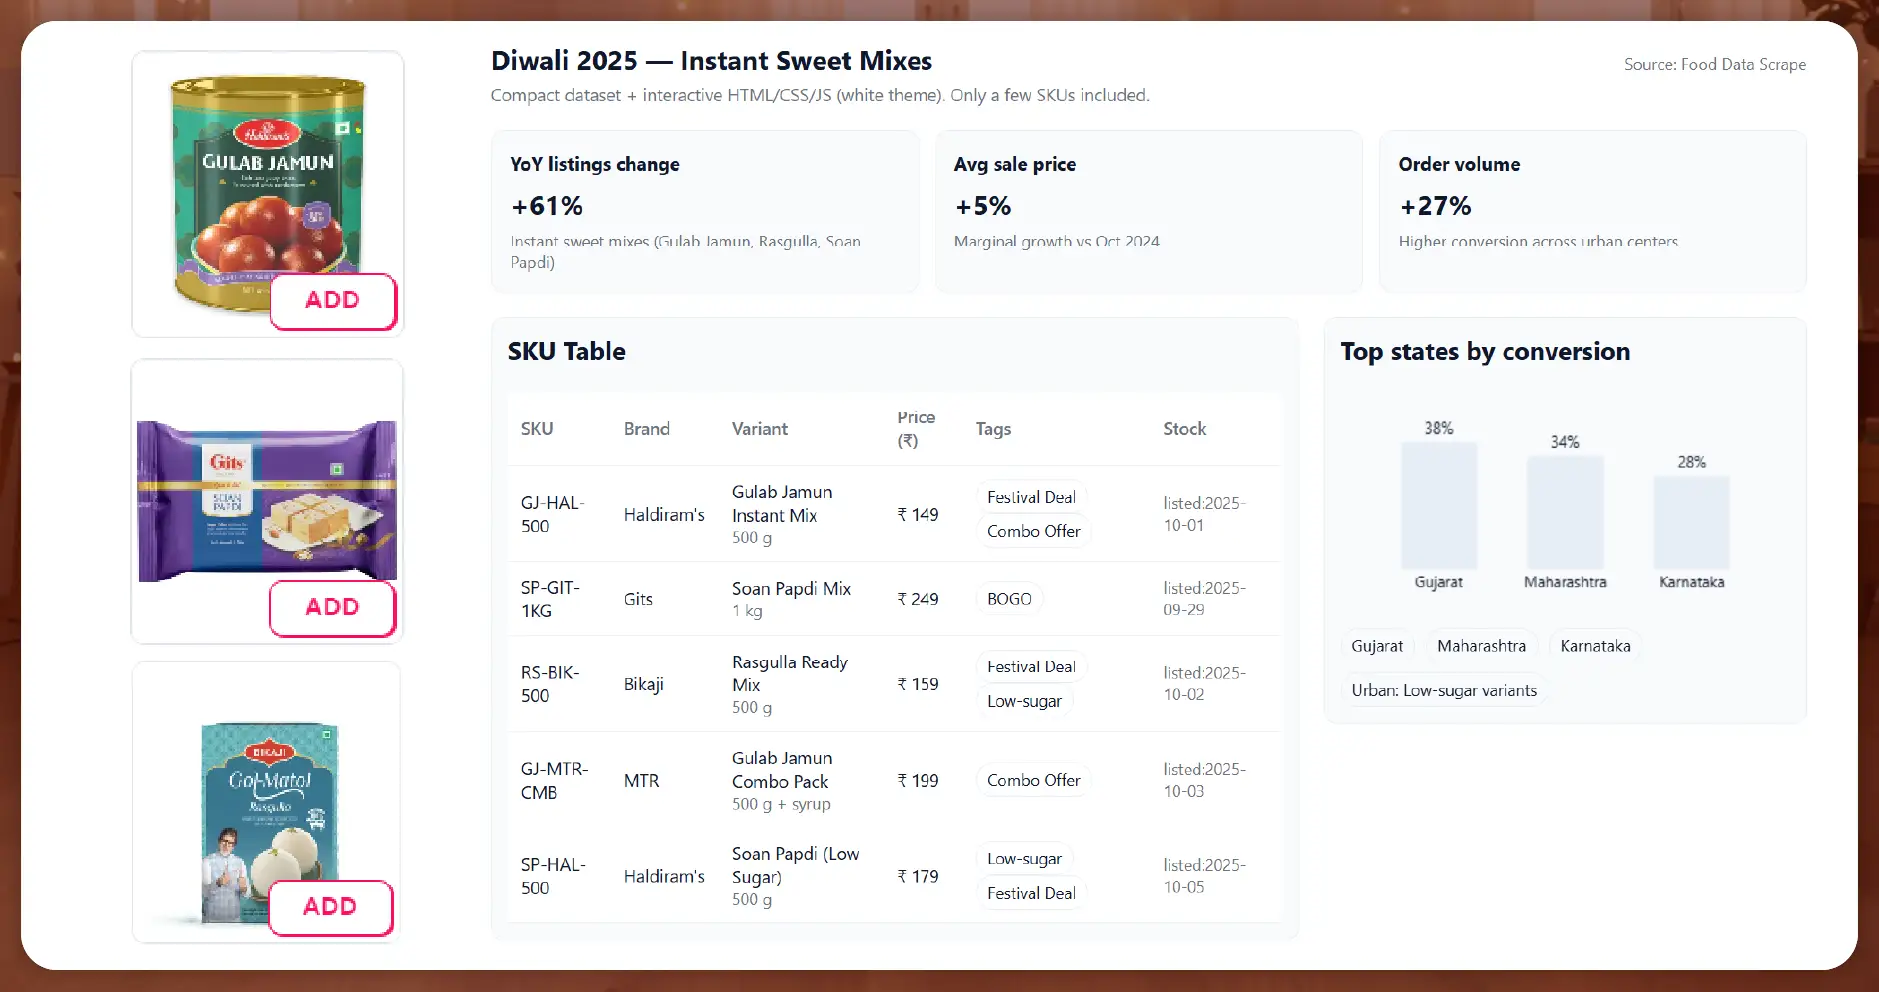
Food Data Scrape analyzed 10,000 + sweet and dessert SKUs listed across India’s major grocery apps during October 2025. The findings highlight a strong shift toward instant sweet mixes and DIY dessert kits.
Key Observations:
- Instant sweet mixes (Gulab Jamun, Soan Papdi, Rasgulla Mix) witnessed a 61 % YoY increase in listings.
- Average sale price grew marginally (~5 %), yet order volume jumped 27 %.
- Gujarat, Maharashtra, and Karnataka led with the highest conversion rates.
- “Health-friendly” or “low-sugar” variants gained notable traction among urban shoppers.
Food Data Scrape’s scraping API extracted rich details including:
- Brand (Haldiram’s, Gits, Bikaji, MTR)
- Weight Variants (500 g / 1 kg / Combo Packs)
- Promotional Tags (BOGO, Festival Deal, Combo Offer)
- Stock Timeline (first listed → sold out → restock)
This structured dataset empowered analytics teams to visualize how convenience + tradition merged to drive a new Diwali shopping behavior in 2025.
The Future: Predictive Diwali Insights with AI + Web Scraping
As AI models merge with continuous grocery scraping, Food Data Scrape is building predictive dashboards that forecast upcoming Diwali trends based on current signals. For instance:
- Price forecast models to anticipate when discounts deepen
- Demand probability models for each SKU per city
- AI-based categorization to automatically cluster similar products (e.g. “Festival Ghee Packs”)
These systems will help FMCG, retail, and analytics partners move from reactive decisions (“what happened yesterday?”) to proactive strategy (“what will spike tomorrow?”).
Why Partner with Food Data Scrape
- Specialized in Grocery Data – Unlike generic data scraping providers, Food Data Scrape focuses on structured grocery data extraction, price tracking, and category mapping.
- Multi-Platform Expertise – Extracts from Instamart, BigBasket, JioMart, Flipkart, Zepto, Blinkit, and regional grocery platforms.
- AI-Enhanced Insights – Adds machine learning for trend prediction, price sensitivity, and demand clustering.
- Custom APIs & Dashboards – Delivers both raw datasets and interactive dashboards tailored to Diwali or other seasonal analyses.
- Compliance & Ethics – Adheres to public-data guidelines, ensuring all data collection follows ethical scraping standards.
Conclusion
Diwali shopping patterns in India are changing rapidly — driven by digital grocery apps, regional diversity, and smarter consumers who compare prices before buying. Through grocery web scraping, Food Data Scrape offers unmatched visibility into this evolution: which products are trending, where shortages are emerging, and how brands can adapt pricing strategies in real time.
By analyzing millions of data points across grocery websites, Food Data Scrape empowers brands, retailers, and analysts to decode festive consumer behavior like never before. The upcoming Diwali seasons will not only be about lights and sweets — but also about data illuminating the future of retail.
Are you in need of high-class scraping services? Food Data Scrape should be your first point of call. We are undoubtedly the best in Food Data Aggregator and Mobile Grocery App Scraping service and we render impeccable data insights and analytics for strategic decision-making. With a legacy of excellence as our backbone, we help companies become data-driven, fueling their development. Please take advantage of our tailored solutions that will add value to your business. Contact us today to unlock the value of your data.

