


The Client
The client was a global beverage analytics firm partnering with alcohol distributors, retail chains, and marketing agencies. Ahead of Halloween 2025, they aimed to build a multi-country alcohol trend dataset that could guide pricing and marketing decisions for future festive campaigns. Their key goals were to: Identify top-performing alcohol categories across five regions, analyze real-time discount and price movement during Halloween week, map festive keywords, packaging, and availability trends, and create a consolidated benchmark for regional performance and consumer interest.
Key Challenges
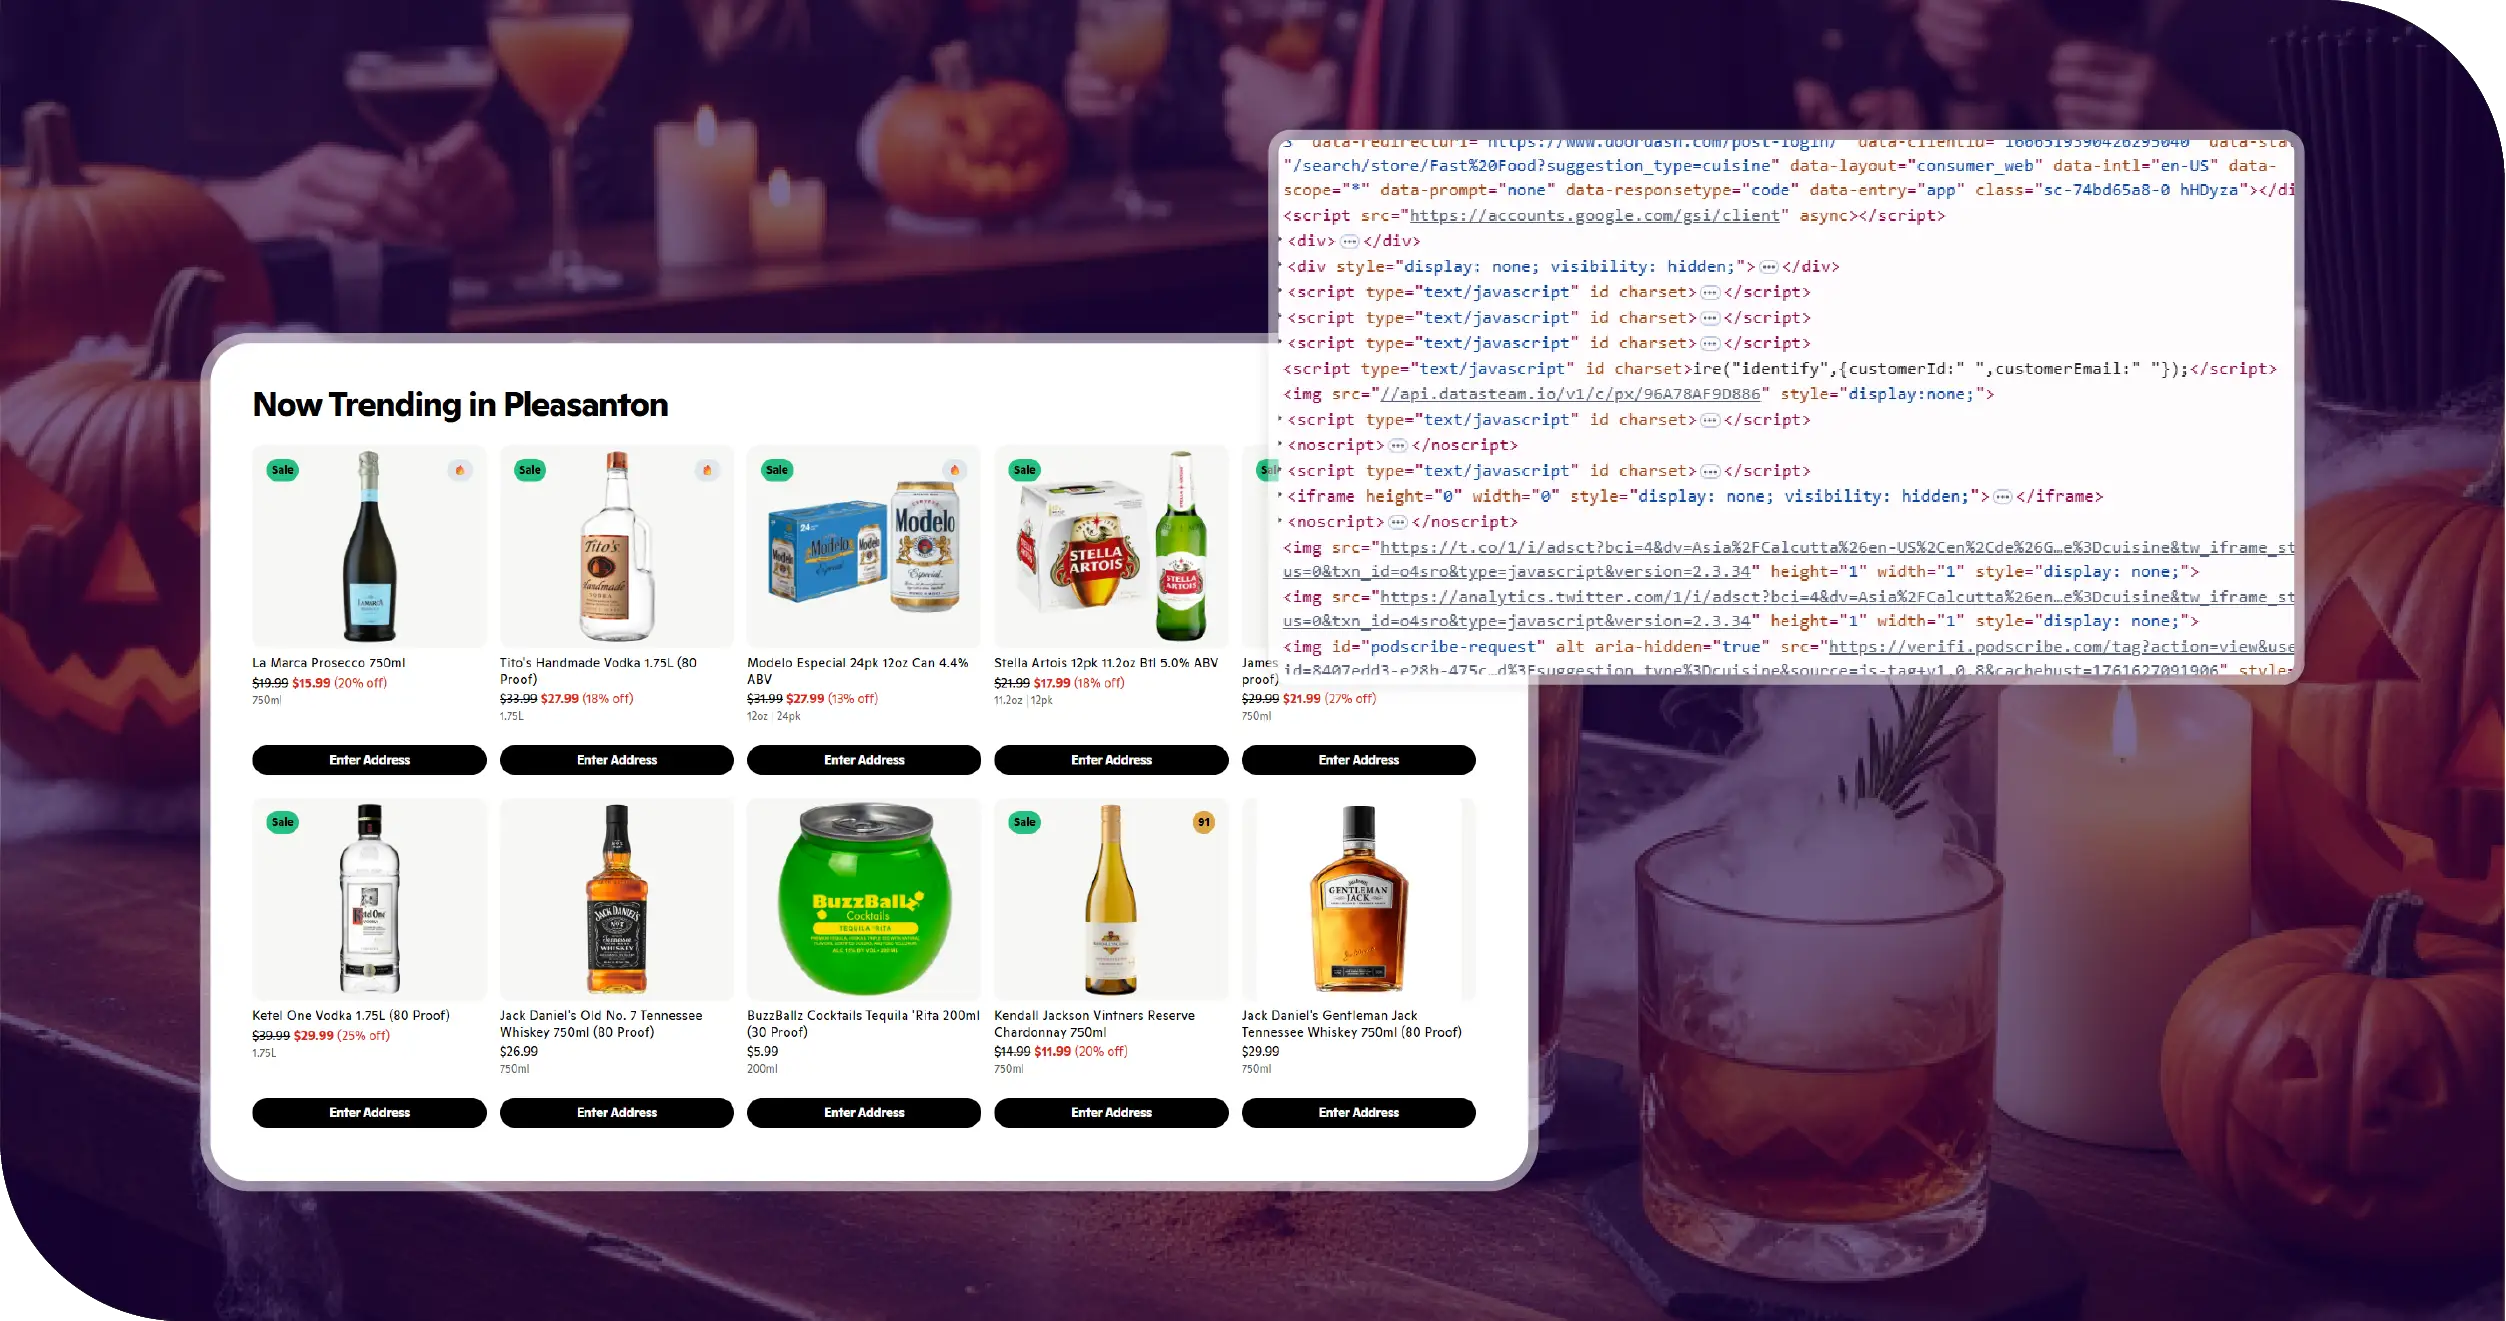
- Fragmented Online Data Sources: Alcohol data was dispersed across dozens of regional retail sites, each using different formats. Manual data aggregation wasn’t feasible.
- Dynamic Discounts and Flash Deals: Halloween offers changed hourly — requiring real-time scraping to capture accurate price movement and promotion timing.
- Regional Regulations: Alcohol listings varied due to country-specific compliance and tax structures, demanding region-aware scraping logic for each market.
- Unstructured Festive Data: Descriptions like “Halloween Edition,” “Pumpkin Brew,” or “Spooky Spirits” lacked consistency. These required semantic tagging to detect Halloween-themed SKUs.
- Currency and Tax Normalization: Comparing discounts across USD, GBP, EUR, CAD, and AUD needed automatic conversion and standardized data cleaning for fair analysis.
Key Solutions
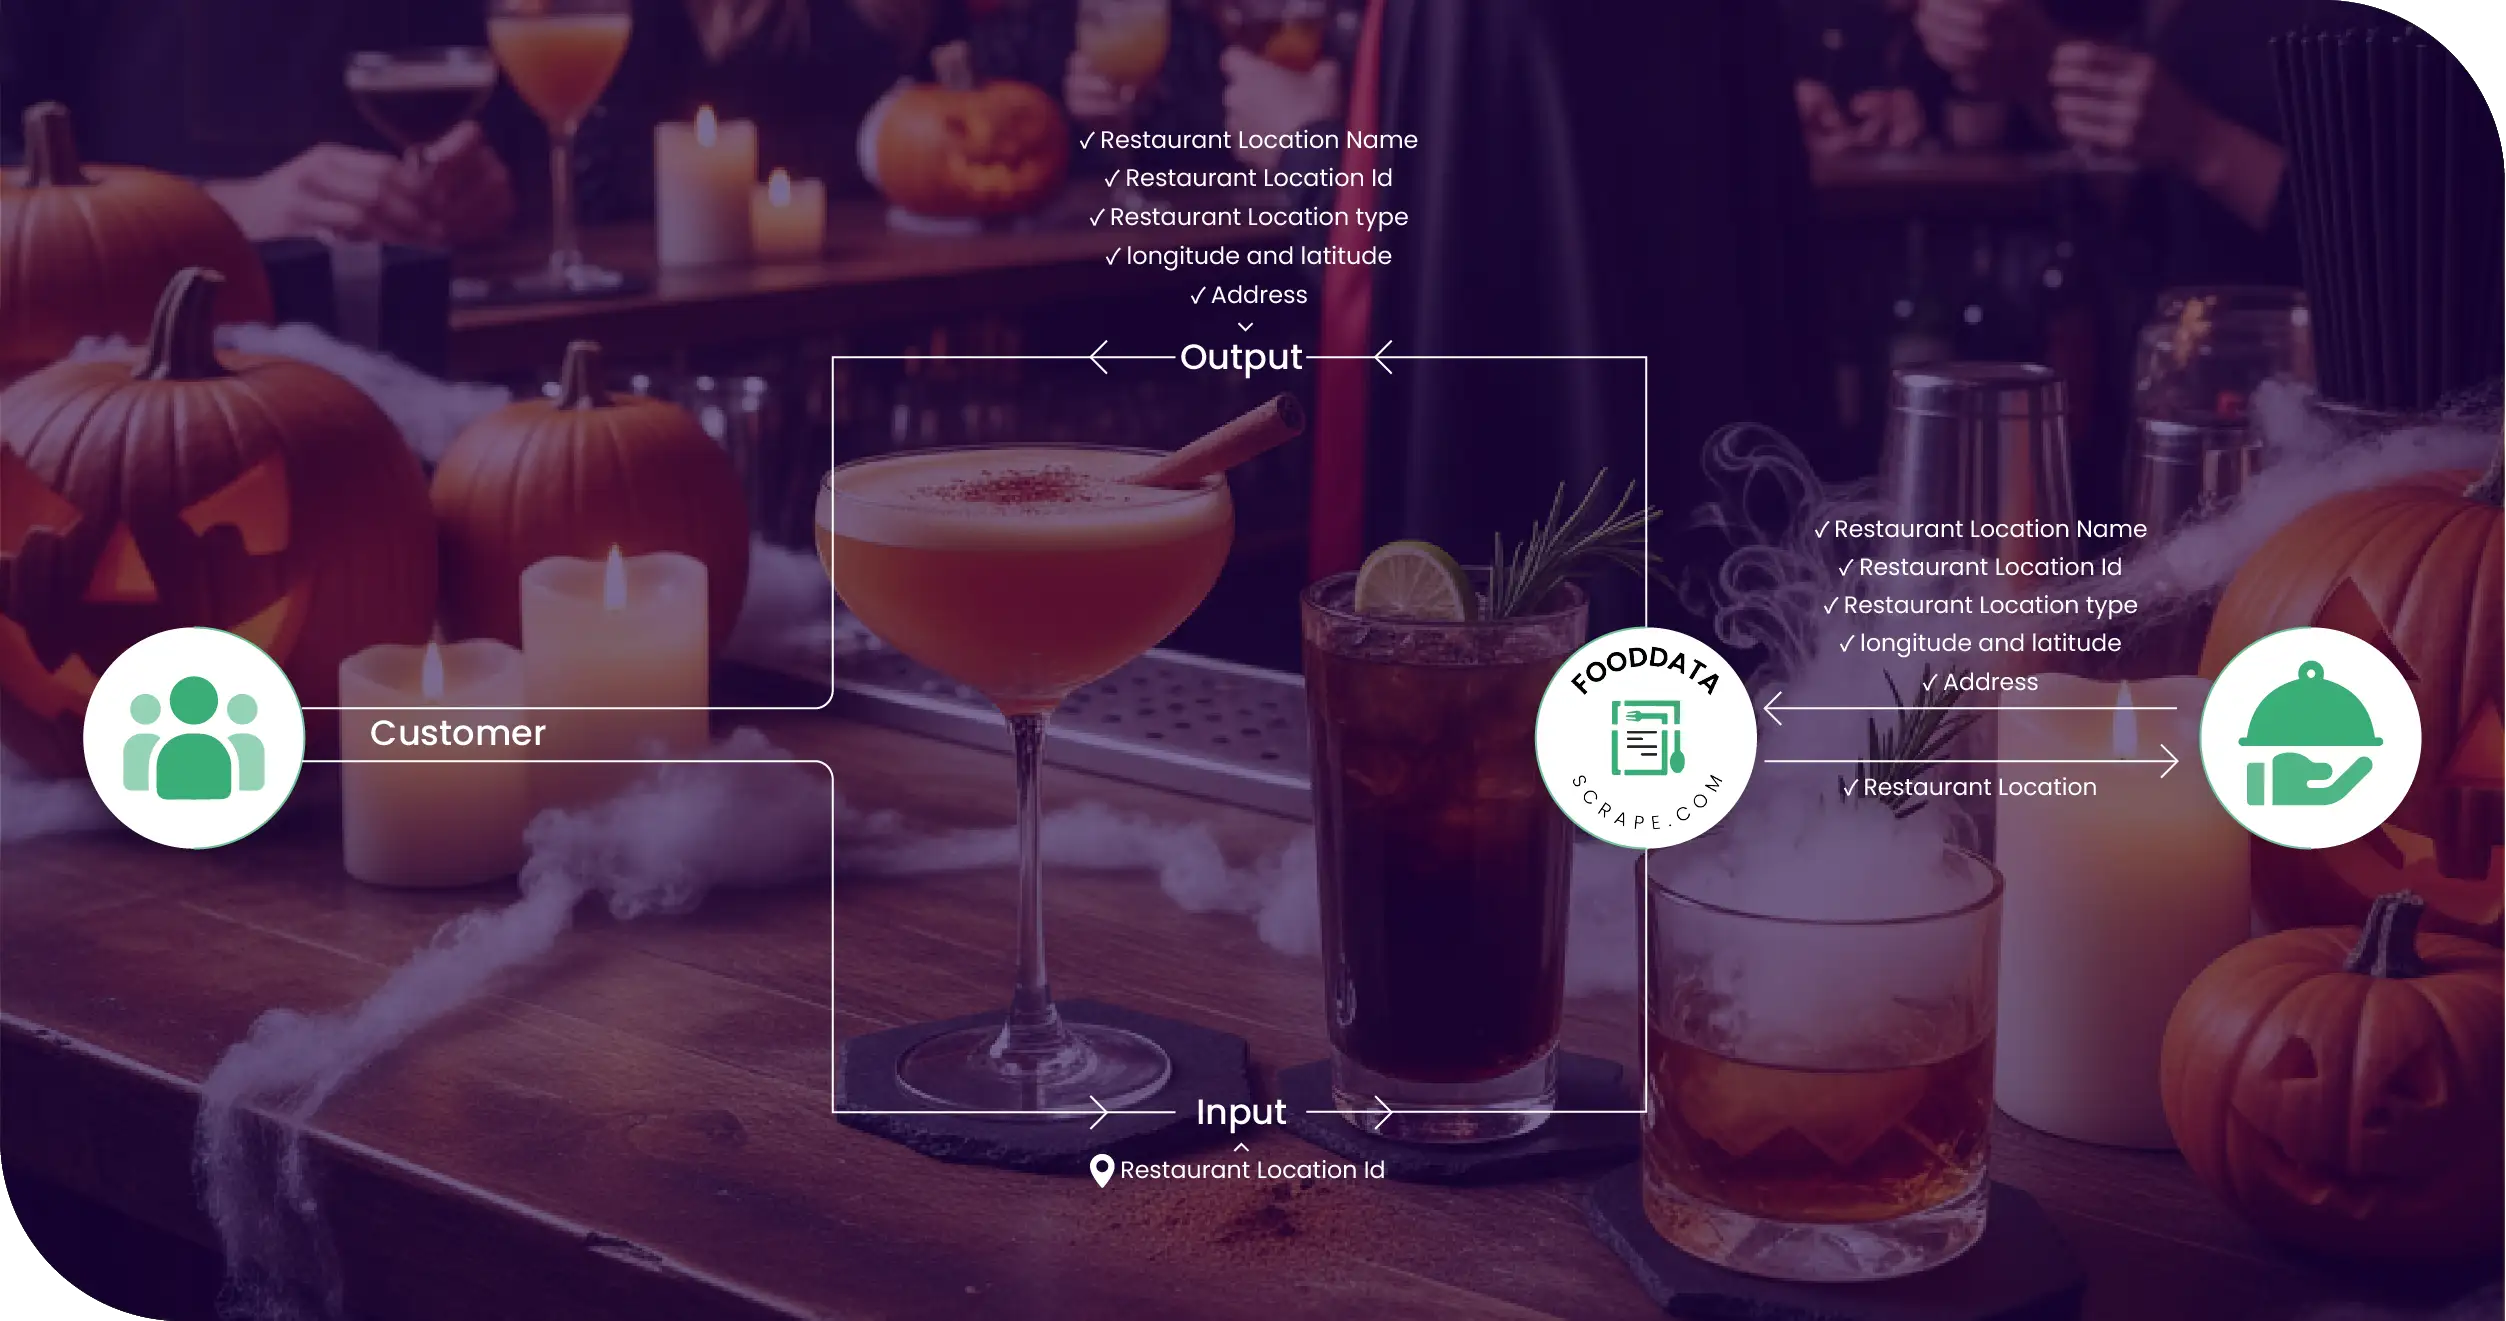
- Multi-Region Alcohol Data Scraping: Collected structured records — product title, alcohol type, ABV, volume, price, discount %, stock status, and ratings — across verified beverage, retail, and supermarket platforms in each region.
- Festive Keyword & Label Detection: Implemented keyword-based scraping filters for “Halloween,” “Limited Edition,” “Pumpkin,” “Spooky,” and “Autumn Blend.” This separated regular items from seasonal listings with high accuracy.
- Real-Time Price and Stock Monitoring: Automated crawlers ran every six hours to track changing prices, flash sales, and “Low Stock” alerts, ensuring precise, time-stamped market visibility.
- Normalized Global Dataset: All prices were converted to USD and adjusted for regional taxes, allowing like-for-like comparison across the USA, UK, Canada, Australia, and EU markets.
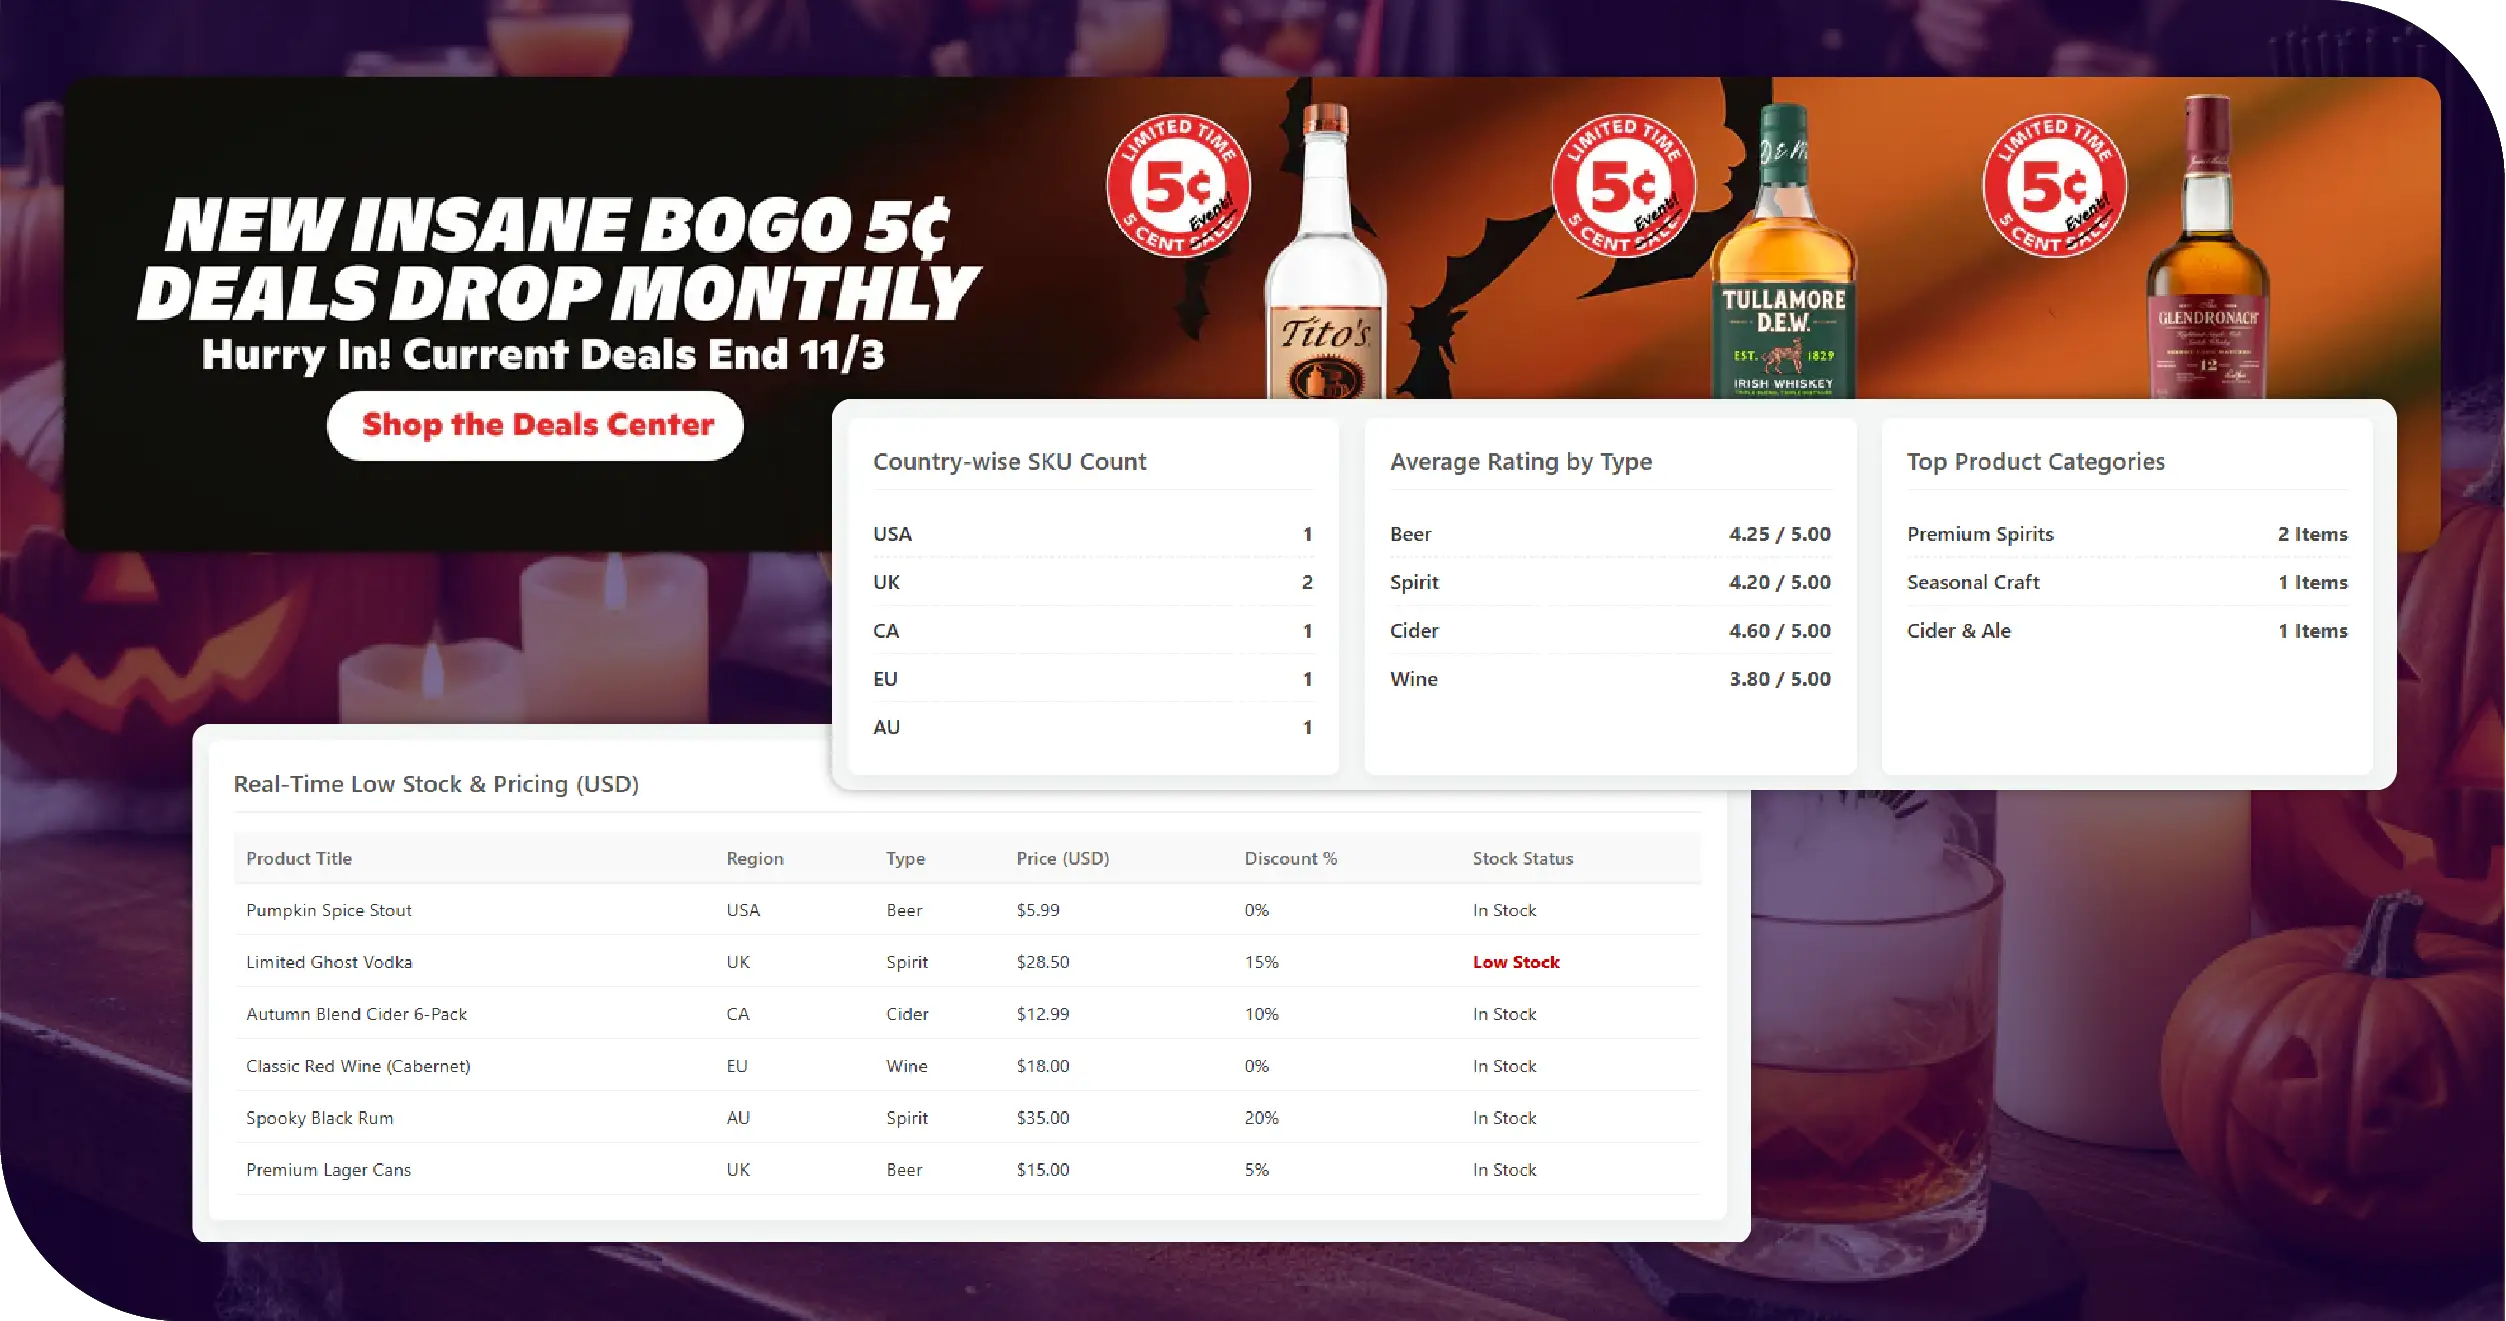
- Dashboard and Analytics Delivery: The final dataset was visualized through a dynamic analytics dashboard that highlighted essential insights across multiple dimensions. It showcased the country-wise SKU count and discount depth, identified the top-selling product categories, and analyzed the average rating by alcohol type. Additionally, it revealed detailed insights into offer duration and volatility patterns, providing a comprehensive view of Halloween season alcohol trends.
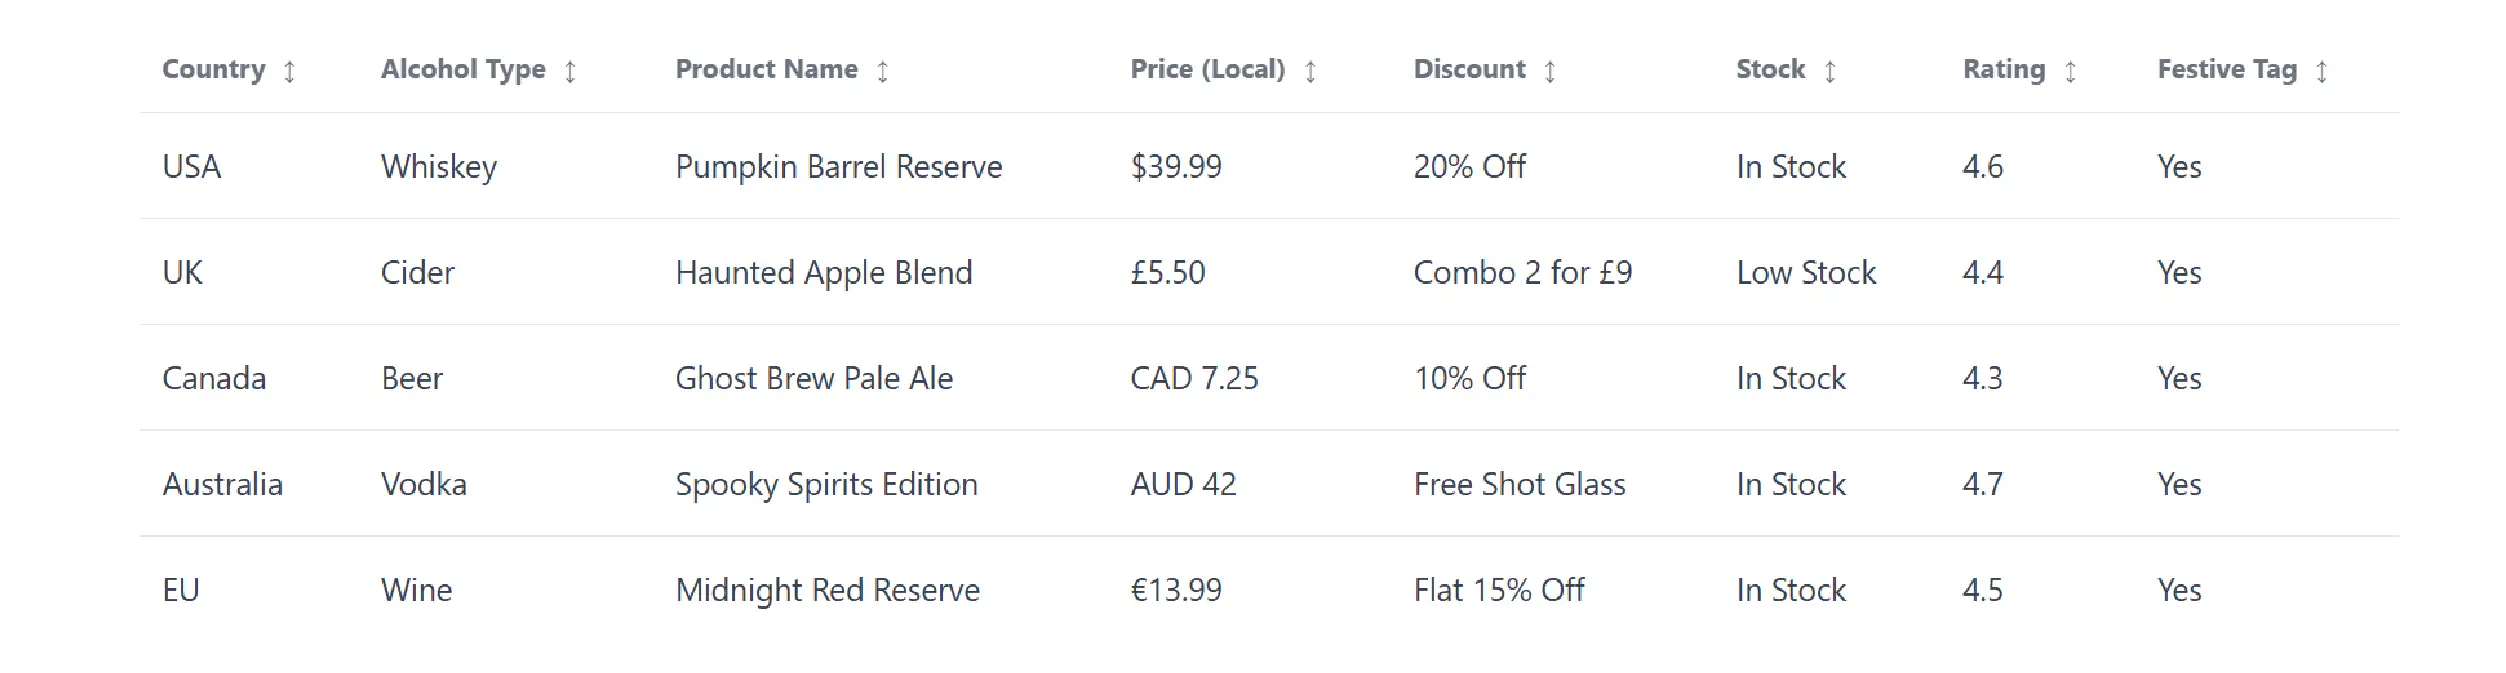
Sample Data Snapshot
Methodologies Used
- Structured Web Scraping Framework: The scraping engine gathered and refreshed data continuously during October, ensuring complete coverage of Halloween campaigns across five regions.
- Data Cleaning and Validation: Duplicate entries and expired listings were removed. Pricing anomalies were corrected using automated checks. Resulting accuracy: 98.7% verified data integrity.
- Sentiment and Keyword Analysis: Scraped review data was analyzed with NLP techniques to capture buyer intent. Terms like “party,” “Halloween drink,” “spooky bottle” correlated with positive sentiment and higher engagement.
- Comparative Regional Analysis: The study tracked the distribution of discounts, product availability, and stock-outs across various alcohol categories in different regions. In the USA and Canada, there was a high demand for craft beers and pumpkin-flavored whiskey, reflecting the seasonal preference for unique, festive flavors. The UK and EU markets showed strong performance in the cider and mulled wine segments, aligning with traditional autumn drinking trends. Meanwhile, Australia witnessed a rising popularity of vodka-based ready-to-drink mixes, indicating a growing consumer shift toward convenient and refreshing beverage options during the Halloween season.
- Time-Phased Data Segmentation: The insights were divided into three distinct stages to capture the complete sales cycle. During the Pre-Halloween phase (Oct 1–20), brands focused on early launch promotions and teaser discounts to build anticipation and drive initial engagement. The Peak Week (Oct 21–31) marked the maximum sales surge, fueled by limited-time offers and themed campaigns that encouraged impulse buying. Finally, the Post-Halloween period (Nov 1–5) centered around clearance and remainder discounts, helping retailers liquidate excess inventory while sustaining short-term customer interest.
Advantages of Using Food Data Scrape
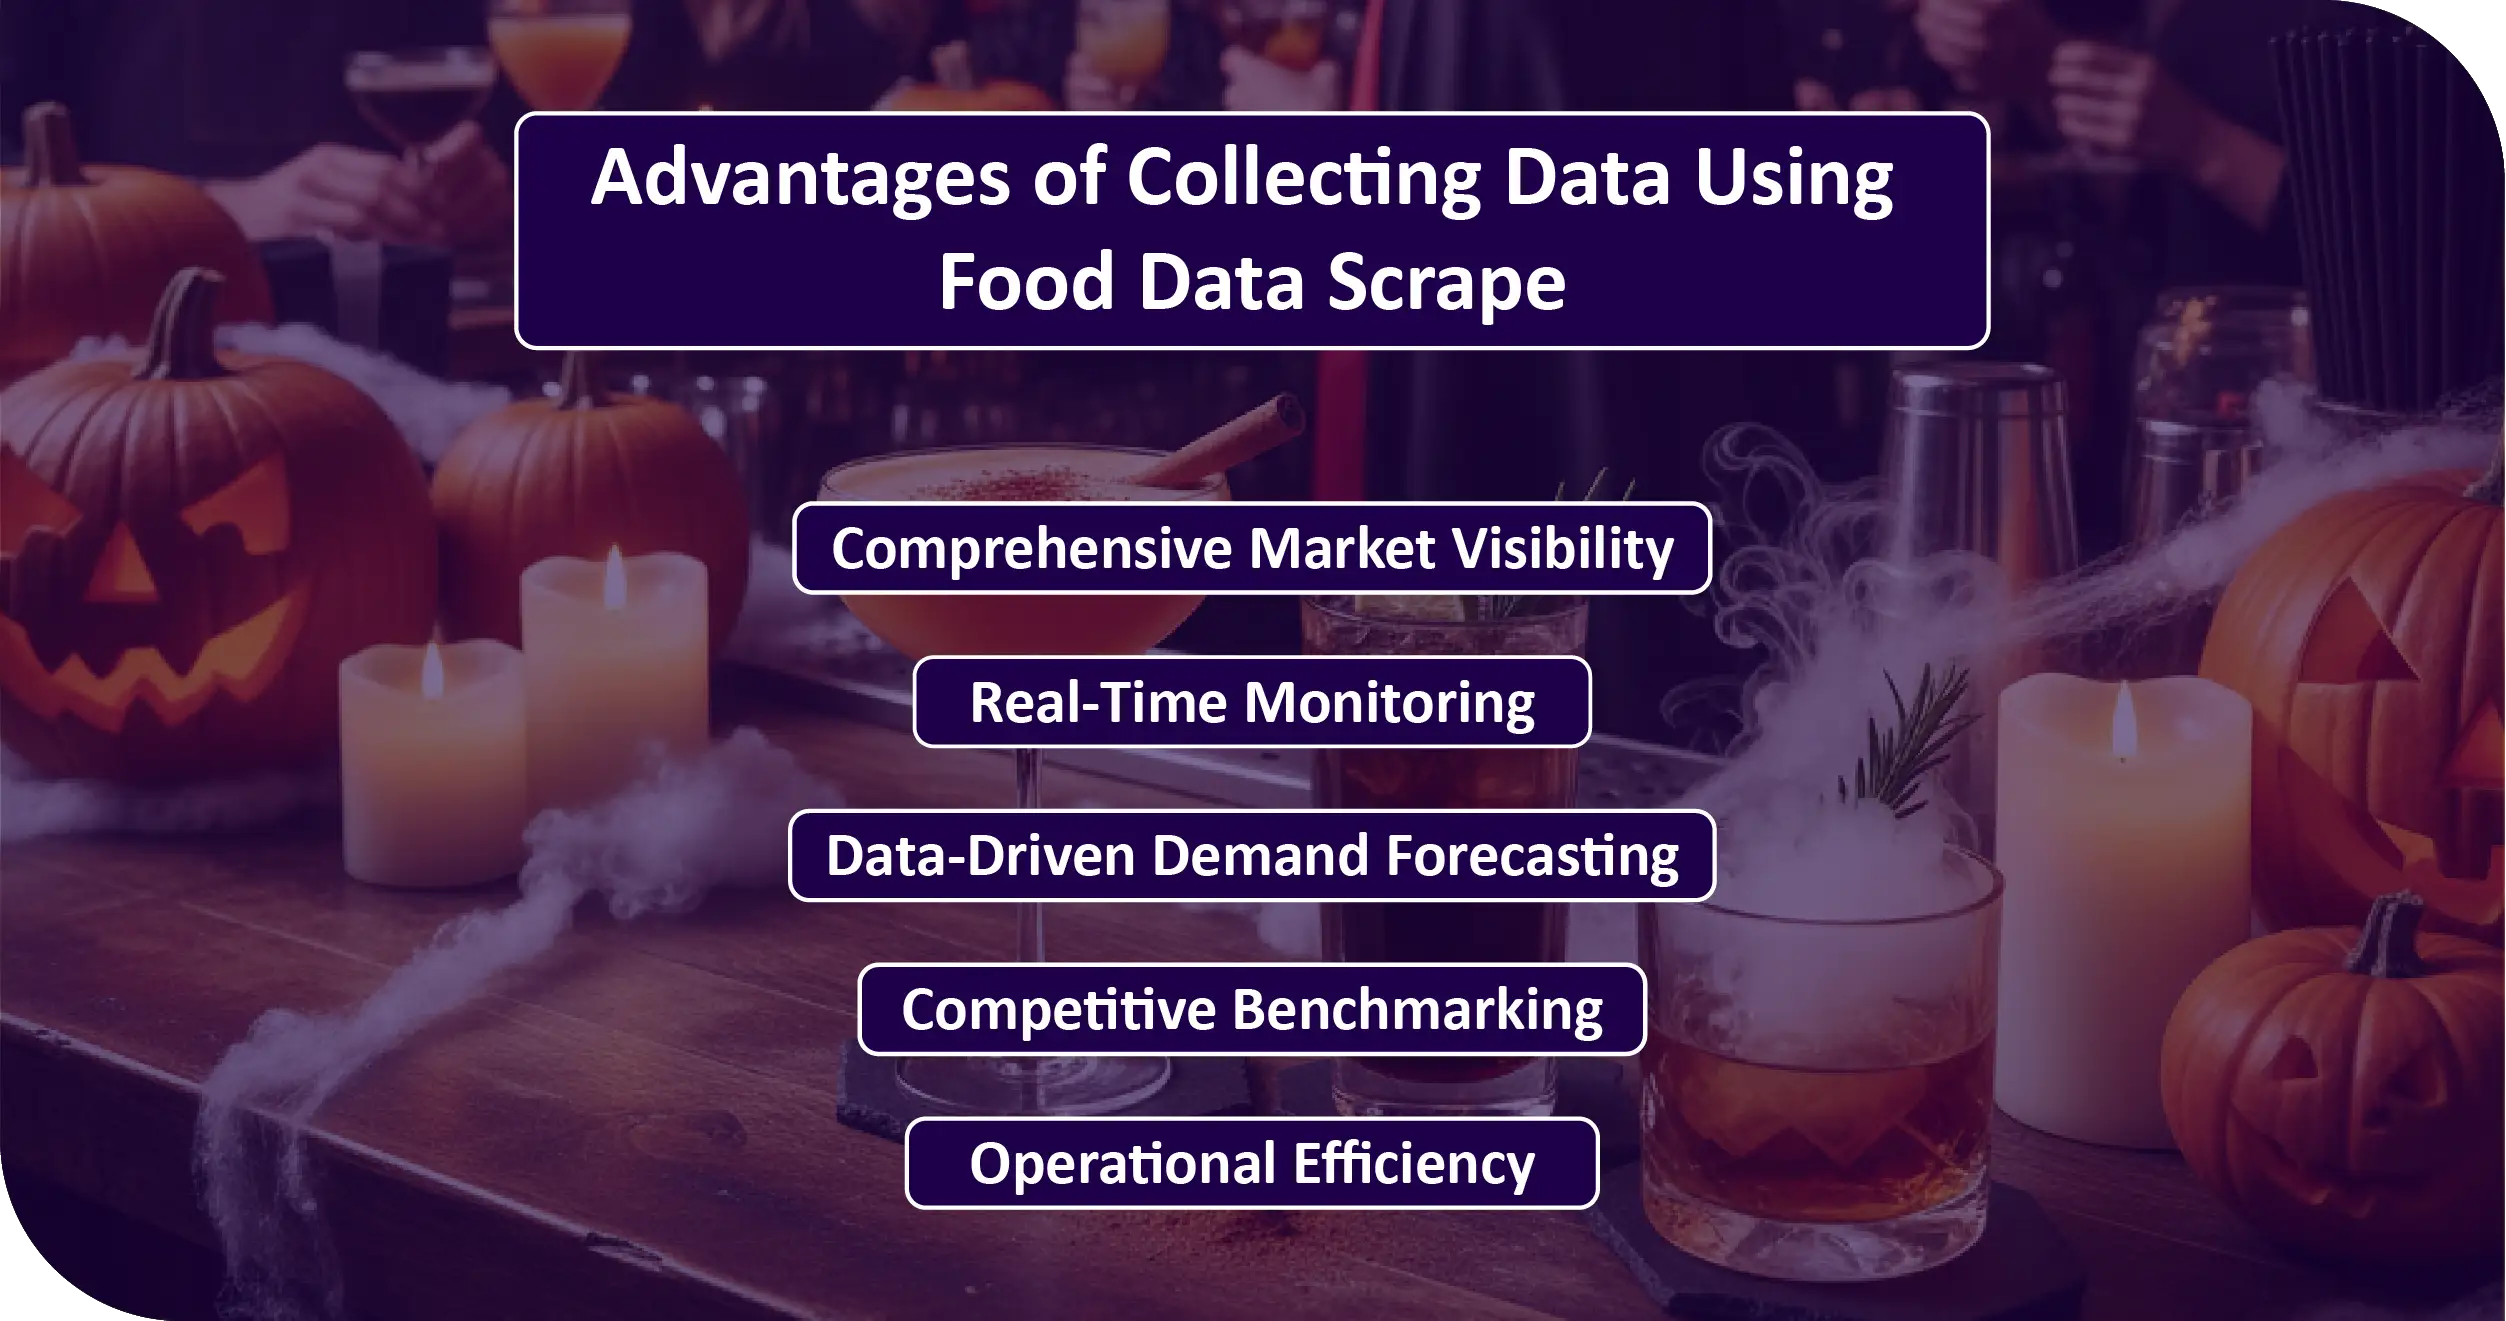
- Comprehensive Market Visibility: Cross-country scraping delivered a unified view of global alcohol trends, replacing fragmented manual research.
- Real-Time Monitoring: Dynamic scraping captured every flash offer and stock update, ensuring no missed opportunities.
- Data-Driven Demand Forecasting: Insights from Halloween 2025 serve as baselines for predictive modeling of festive sales patterns.
- Competitive Benchmarking: Retailers gained transparent insights into how other regions structure pricing and promotions during holiday seasons.
- Operational Efficiency: Automated scraping reduced human workload, improved data reliability, and provided analytics within hours instead of weeks.
Client’s Testimonial
“Food Data Scrape provided a powerful, multi-region dataset that turned scattered Halloween listings into usable market intelligence. It gave our team clarity on where seasonal alcohol trends were strongest and how to plan next year’s campaigns.”
Head of Market Intelligence, Global Beverage Analytics Firm
Final Outcome
The Halloween Season Alcohol Trend Dataset 2025 empowered the client to move from reactive market observation to proactive strategy building. With over 180,000 product records analyzed, the dataset offered unmatched visibility into: Real-time alcohol pricing and promotions, regional preference patterns, offer duration and stock dynamics, and consumer sentiment indicators. The insights informed marketing budgets, guided supply chain allocations, and shaped next-season product development strategies. Ultimately, Food Data Scrape proved that in the alcohol and beverage industry, data scraping is the key to competitive advantage — delivering faster insights, higher accuracy, and measurable ROI. Seasonal data intelligence is now central to decision-making in the global beverage market. Web scraping for alcohol data lets brands react instantly to market shifts, design region-specific promotions, and stay ahead of consumer demand. By combining automation, accuracy, and analytics, Food Data Scrape continues to redefine how the world’s leading food and beverage brands capture festive insights and transform them into growth strategies. The 2025 Halloween project reinforced one clear truth — scrape smarter, sell faster.

