Introduction
Walk into any American liquor store, supermarket, or convenience aisle in 2026 and you will be greeted by walls of brightly colored slim cans. What began less than a decade ago as a niche category dominated by a single brand has matured into a fiercely competitive multi-billion-dollar segment that now sits alongside beer, wine, and spirits as a permanent fixture of US drinking culture. Hard seltzers, ready-to-drink (RTD) cocktails, canned wines, and craft canned cocktails have collectively redefined the alcoholic beverage landscape.
For the brands fighting for shelf space, the retailers managing increasingly complex SKU mixes, and the investors betting on the next breakout label, one thing is non-negotiable: comprehensive, real-time market data. That is exactly where delivers. Our platform tracks the entire canned beverage ecosystem across more than 50 US cities, providing decision-grade intelligence on pricing, distribution, promotional cycles, flavor trends, and competitor moves.
This blog explores why hard seltzer market data scraping has become indispensable, what kinds of insights it unlocks, and how Food Data Scrape's solutions transform the chaotic web of canned beverage commerce into structured, actionable intelligence.
The Hard Seltzer Boom: A Market in Constant Motion

The American hard seltzer category exploded into the mainstream around 2019 and has not slowed down since — though its trajectory has changed shape dramatically. After early hyper-growth driven by White Claw and Truly, the category went through a maturation phase, with hundreds of brands entering, dozens exiting, and the segment fragmenting into sub-categories: traditional hard seltzers, tequila-based seltzers, vodka soda RTDs, agave seltzers, wine-based spritzers, and crossover hybrids that blur the line between seltzer, cocktail, and craft beer.
Industry estimates place the US hard seltzer market at over $7 billion in annual retail sales, with the broader canned RTD category — including spirits-based cocktails — pushing past $13 billion. Crucially, the category is no longer growing in a straight line. Some sub-segments are accelerating (tequila-based seltzers, premium spirit RTDs), while others are contracting (legacy malt-based seltzers in certain regions). Understanding which way the wind is blowing in any given city or retailer requires data — not anecdote.
This volatility is exactly why hard seltzer market data has become so valuable. A pricing decision made on six-month-old assumptions can leave a brand significantly out of position by the time the next promotional cycle hits.
Why Hard Seltzer Pricing Intelligence Matters
The hard seltzer category operates differently from traditional beer or spirits in several important ways, and each difference amplifies the need for granular hard seltzer pricing intelligence.
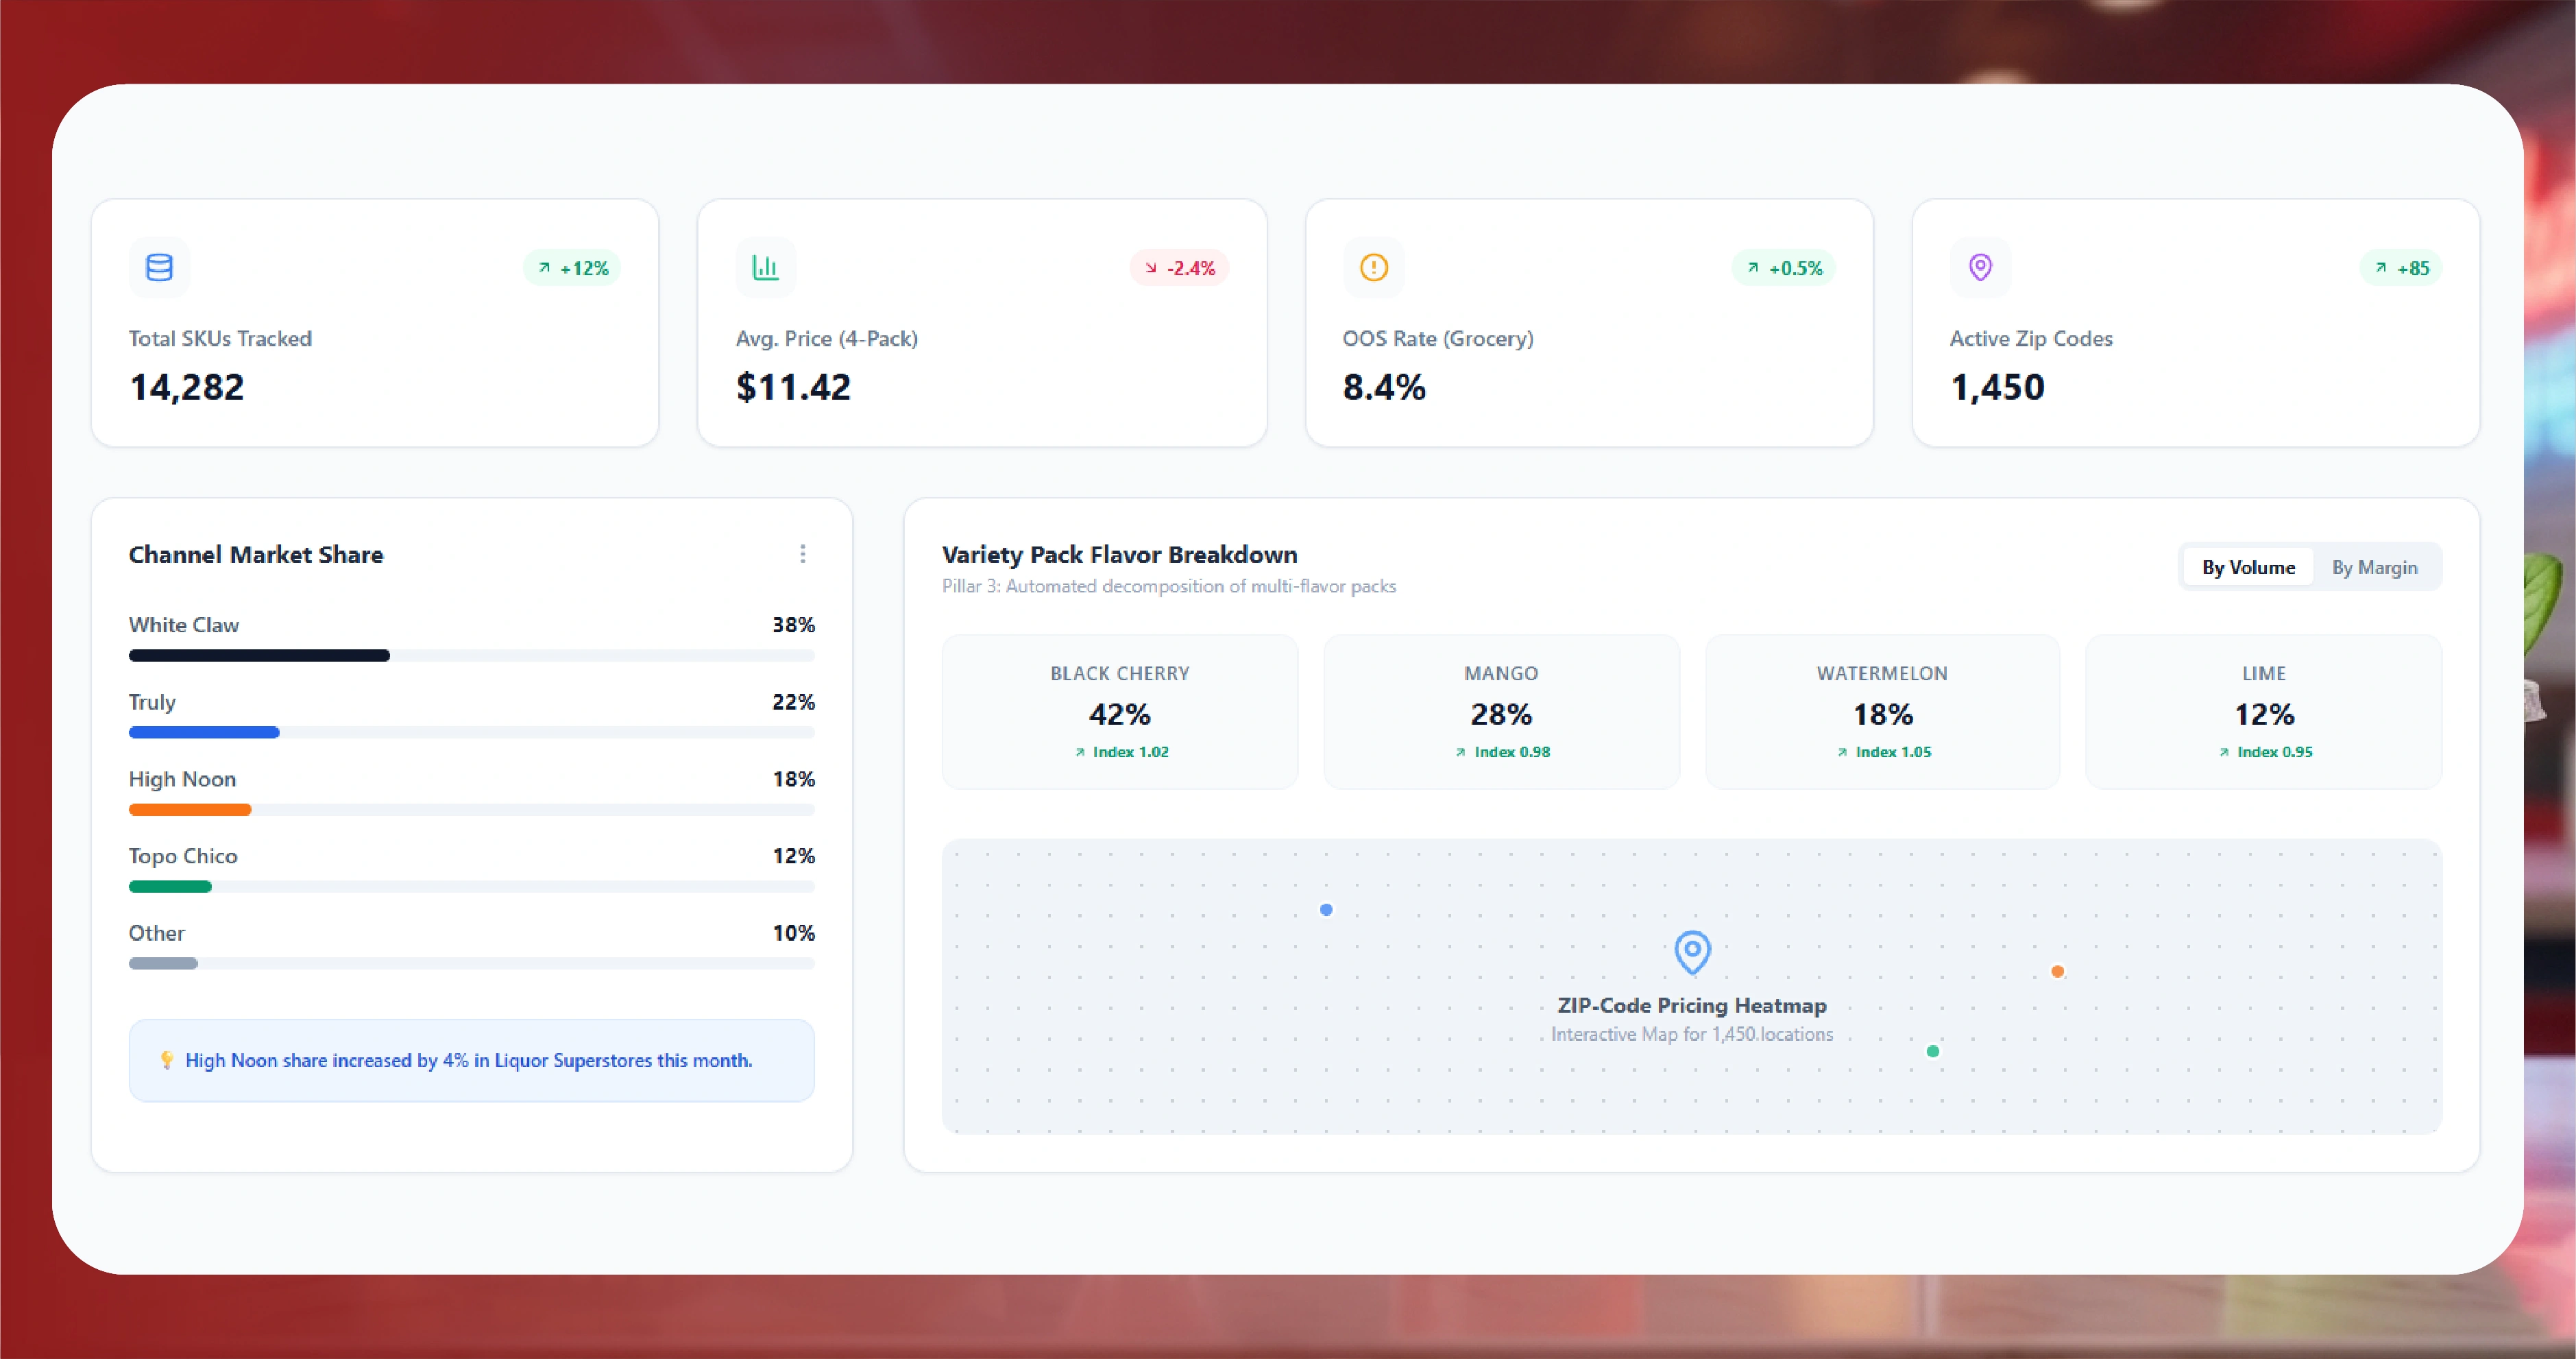
Variety pack dominance. Unlike beer, where single-flavor packs still dominate, the seltzer aisle is ruled by variety packs. Tracking the implied per-can price across 12-pack, 24-pack, and seasonal variety configurations — and how those prices shift week to week — requires structured scraping at scale.
Flavor velocity. Hard seltzer flavors come and go faster than nearly any other beverage category. Limited-edition mango passion fruit lime drops can sell out in weeks; pumpkin spice and peppermint variants appear and disappear with the seasons. Knowing which flavors are in stock, where, and at what price is critical for both brands and competitors.
Channel divergence. A 12-pack of hard seltzer can be priced 25 percent differently between a national grocery chain, a regional liquor superstore, and an on-demand delivery app — sometimes within the same ZIP code. Without ongoing monitoring, no team can keep up.
Promotional intensity. Hard seltzer is one of the most heavily promoted categories in alcoholic beverages, with rebates, multi-buy deals, and "buy one, get one" offers cycling rapidly. Tracking promotional depth and frequency is essential for both compliance and competitive response.
Regulatory complexity. Hard seltzer's classification varies by state — malt-based versus spirit-based products are taxed and shelved differently — creating distribution patterns that look nothing like beer or wine.
In each of these dimensions, canned beverage data scraping provides the only scalable way to stay current.
How Food Data Scrape Tracks the Canned Beverage Market
At Food Data Scrape, we have built a purpose-engineered data infrastructure for the canned RTD category. Our beverage data scraping services ingest information from a wide network of public web sources, every day, and apply rigorous quality controls before delivery. Our methodology rests on five pillars.
Multi-channel coverage. We Scrape Hard Seltzer Data from national grocery chains (Kroger, Safeway, Whole Foods), liquor superstores (Total Wine, BevMo, Spec's), regional bottle shops, on-demand delivery platforms (Drizly partner sites, Instacart-affiliated retailers, gopuff), brand-direct e-commerce sites, and convenience-store digital catalogs. This breadth ensures every important channel is represented in the dataset.
ZIP-code-level granularity. Our crawlers do not just capture "the price in Los Angeles." They capture pricing and availability across dozens of distinct outlets per metropolitan area, enabling true neighborhood-level analysis.
Variety-pack decomposition. Our parsers automatically decompose multi-flavor variety packs into their component flavors, enabling per-flavor demand and pricing analysis that most off-the-shelf datasets cannot offer.
Daily and intraday refresh. Pricing, availability, and promotional status on top-velocity SKUs refresh daily, with intraday recapture triggered by promotional flags, stock changes, or new SKU launches.
Quality assurance. Every record passes through schema validation, outlier detection, brand-name disambiguation, ABV sanity checks, and currency normalization before reaching client systems
Clients access the data through flexible delivery options: a fully documented beverage data scraping API (REST-based, with token authentication and filtering by city, retailer, brand, flavor, ABV range, and date), scheduled CSV or JSON exports, direct integration into Snowflake or BigQuery, and custom dashboards.
Sample Hard Seltzer & Canned Beverage Data
To illustrate the structure of the Hard Seltzer Dataset delivered by Food Data Scrape, here are representative samples from across the pipeline. Every record is normalized, deduplicated, and tagged with geographic and temporal metadata — ready for direct ingestion into BI tools, pricing engines, or consumer-facing apps.
Sample 1: Hard Seltzer Retail Pricing Snapshot
| City | Retailer | Brand | Product | ABV | Pack Size | Price | Date |
|---|---|---|---|---|---|---|---|
| Los Angeles, CA | Total Wine | White Claw | Variety Pack #1 | 5.0% | 12 x 12 oz | $17.99 | 2026-04-30 |
| Chicago, IL | Binny's | Truly | Tropical Mix | 5.0% | 12 x 12 oz | $16.49 | 2026-04-30 |
| Miami, FL | ABC Fine Wine | High Noon | Variety 8-Pack | 4.5% | 8 x 12 oz | $19.99 | 2026-04-30 |
| Dallas, TX | Spec's | Topo Chico | Ranch Water | 4.7% | 12 x 12 oz | $18.99 | 2026-04-30 |
| Boston, MA | Gordon's | Nutrl | Vodka Seltzer Variety | 4.5% | 8 x 12 oz | $17.99 | 2026-04-30 |
| Seattle, WA | Total Wine | BeatBox | Party Punch | 11.1% | 6 x 11.2 oz | $14.99 | 2026-04-30 |
| Denver, CO | Argonaut Liquor | Cutwater | Tequila Margarita | 12.5% | 4 x 12 oz | $11.99 | 2026-04-30 |
| Atlanta, GA | Total Wine | Surfside | Vodka Lemonade | 4.5% | 4 x 12 oz | $9.99 | 2026-04-30 |
| New York, NY | Drizly Partner | Loverboy | Hibiscus Pom | 4.2% | 6 x 11 oz | $14.99 | 2026-04-30 |
| Phoenix, AZ | BevMo | Mark Anthony | Cayman Jack Margarita | 5.8% | 12 x 12 oz | $17.99 | 2026-04-30 |
Sample 2: Per-Flavor Variety Pack Decomposition
| Brand | Variety Pack | Flavor | Cans in Pack | Implied Per-Can Price |
|---|---|---|---|---|
| White Claw | Variety #1 | Black Cherry | 3 | $1.50 |
| White Claw | Variety #1 | Ruby Grapefruit | 3 | $1.50 |
| White Claw | Variety #1 | Natural Lime | 3 | $1.50 |
| White Claw | Variety #1 | Raspberry | 3 | $1.50 |
| High Noon | Variety 8-Pack | Pineapple | 2 | $2.50 |
| High Noon | Variety 8-Pack | Black Cherry | 2 | $2.50 |
| High Noon | Variety 8-Pack | Watermelon | 2 | $2.50 |
| High Noon | Variety 8-Pack | Peach | 2 | $2.50 |
Sample 3: Promotional Activity Across Cities
| City | Retailer | Product | Original | Promo | Discount | Promo Type | Date |
|---|---|---|---|---|---|---|---|
| Houston, TX | Kroger | Truly Iced Tea 12pk | $17.99 | $14.99 | 17% | Weekly Special | 2026-04-29 |
| Minneapolis, MN | Total Wine | High Noon Variety 12pk | $24.99 | $21.99 | 12% | Multi-buy | 2026-04-29 |
| San Diego, CA | BevMo | White Claw Surge 12pk | $19.99 | $16.99 | 15% | Member Pricing | 2026-04-29 |
| Nashville, TN | Total Wine | Cutwater Margarita 4pk | $11.99 | $9.99 | 17% | Mix & Match 6 | 2026-04-29 |
Sample 4: Stock Availability Tracking
| City | Retailer | Product | Status | Last Seen | Days Out of Stock |
|---|---|---|---|---|---|
| Brooklyn, NY | Top Hops | Surfside Iced Tea 4pk | Out of Stock | 2026-04-22 | 8 |
| Austin, TX | Twin Liquors | Loverboy Hibiscus Pom | In Stock | 2026-04-30 | 0 |
| Portland, OR | Belmont Station | BeatBox Punch 6pk | In Stock | 2026-04-30 | 0 |
| Tampa, FL | ABC Fine Wine | Nutrl Vodka Variety | Low Stock | 2026-04-30 | 0 |
These samples represent only a fraction of the millions of records Food Data Scrape captures across the canned beverage category each month.
Coverage Across 50+ US Cities
Our US hard seltzer market analysis coverage spans every major metropolitan area where canned beverages drive meaningful retail volume:
Northeast: New York, Brooklyn, Boston, Philadelphia, Pittsburgh, Hartford, Providence, Burlington, Portland (ME).
Mid-Atlantic & South: Washington DC, Baltimore, Richmond, Charlotte, Raleigh, Atlanta, Nashville, Birmingham, New Orleans, Jacksonville, Tampa, Miami, Orlando.
Midwest: Chicago, Milwaukee, Detroit, Cleveland, Columbus, Cincinnati, Indianapolis, Minneapolis, Saint Louis, Kansas City, Des Moines.
Mountain & Southwest: Denver, Boulder, Salt Lake City, Phoenix, Tucson, Las Vegas, Albuquerque, Austin, Houston, Dallas, San Antonio, Oklahoma City.
West Coast & Pacific Northwest: San Diego, Los Angeles, San Francisco, Oakland, Sacramento, Portland (OR), Seattle, Spokane, Honolulu.
Each city is monitored across multiple retail tiers — chain liquor stores, independent bottle shops, grocery, convenience, and on-demand delivery platforms — delivering a true 360-degree view of local market dynamics.
High-Value Use Cases for Hard Seltzer Data
The applications of alcoholic beverage market data in the canned RTD space stretch across the entire commercial value chain
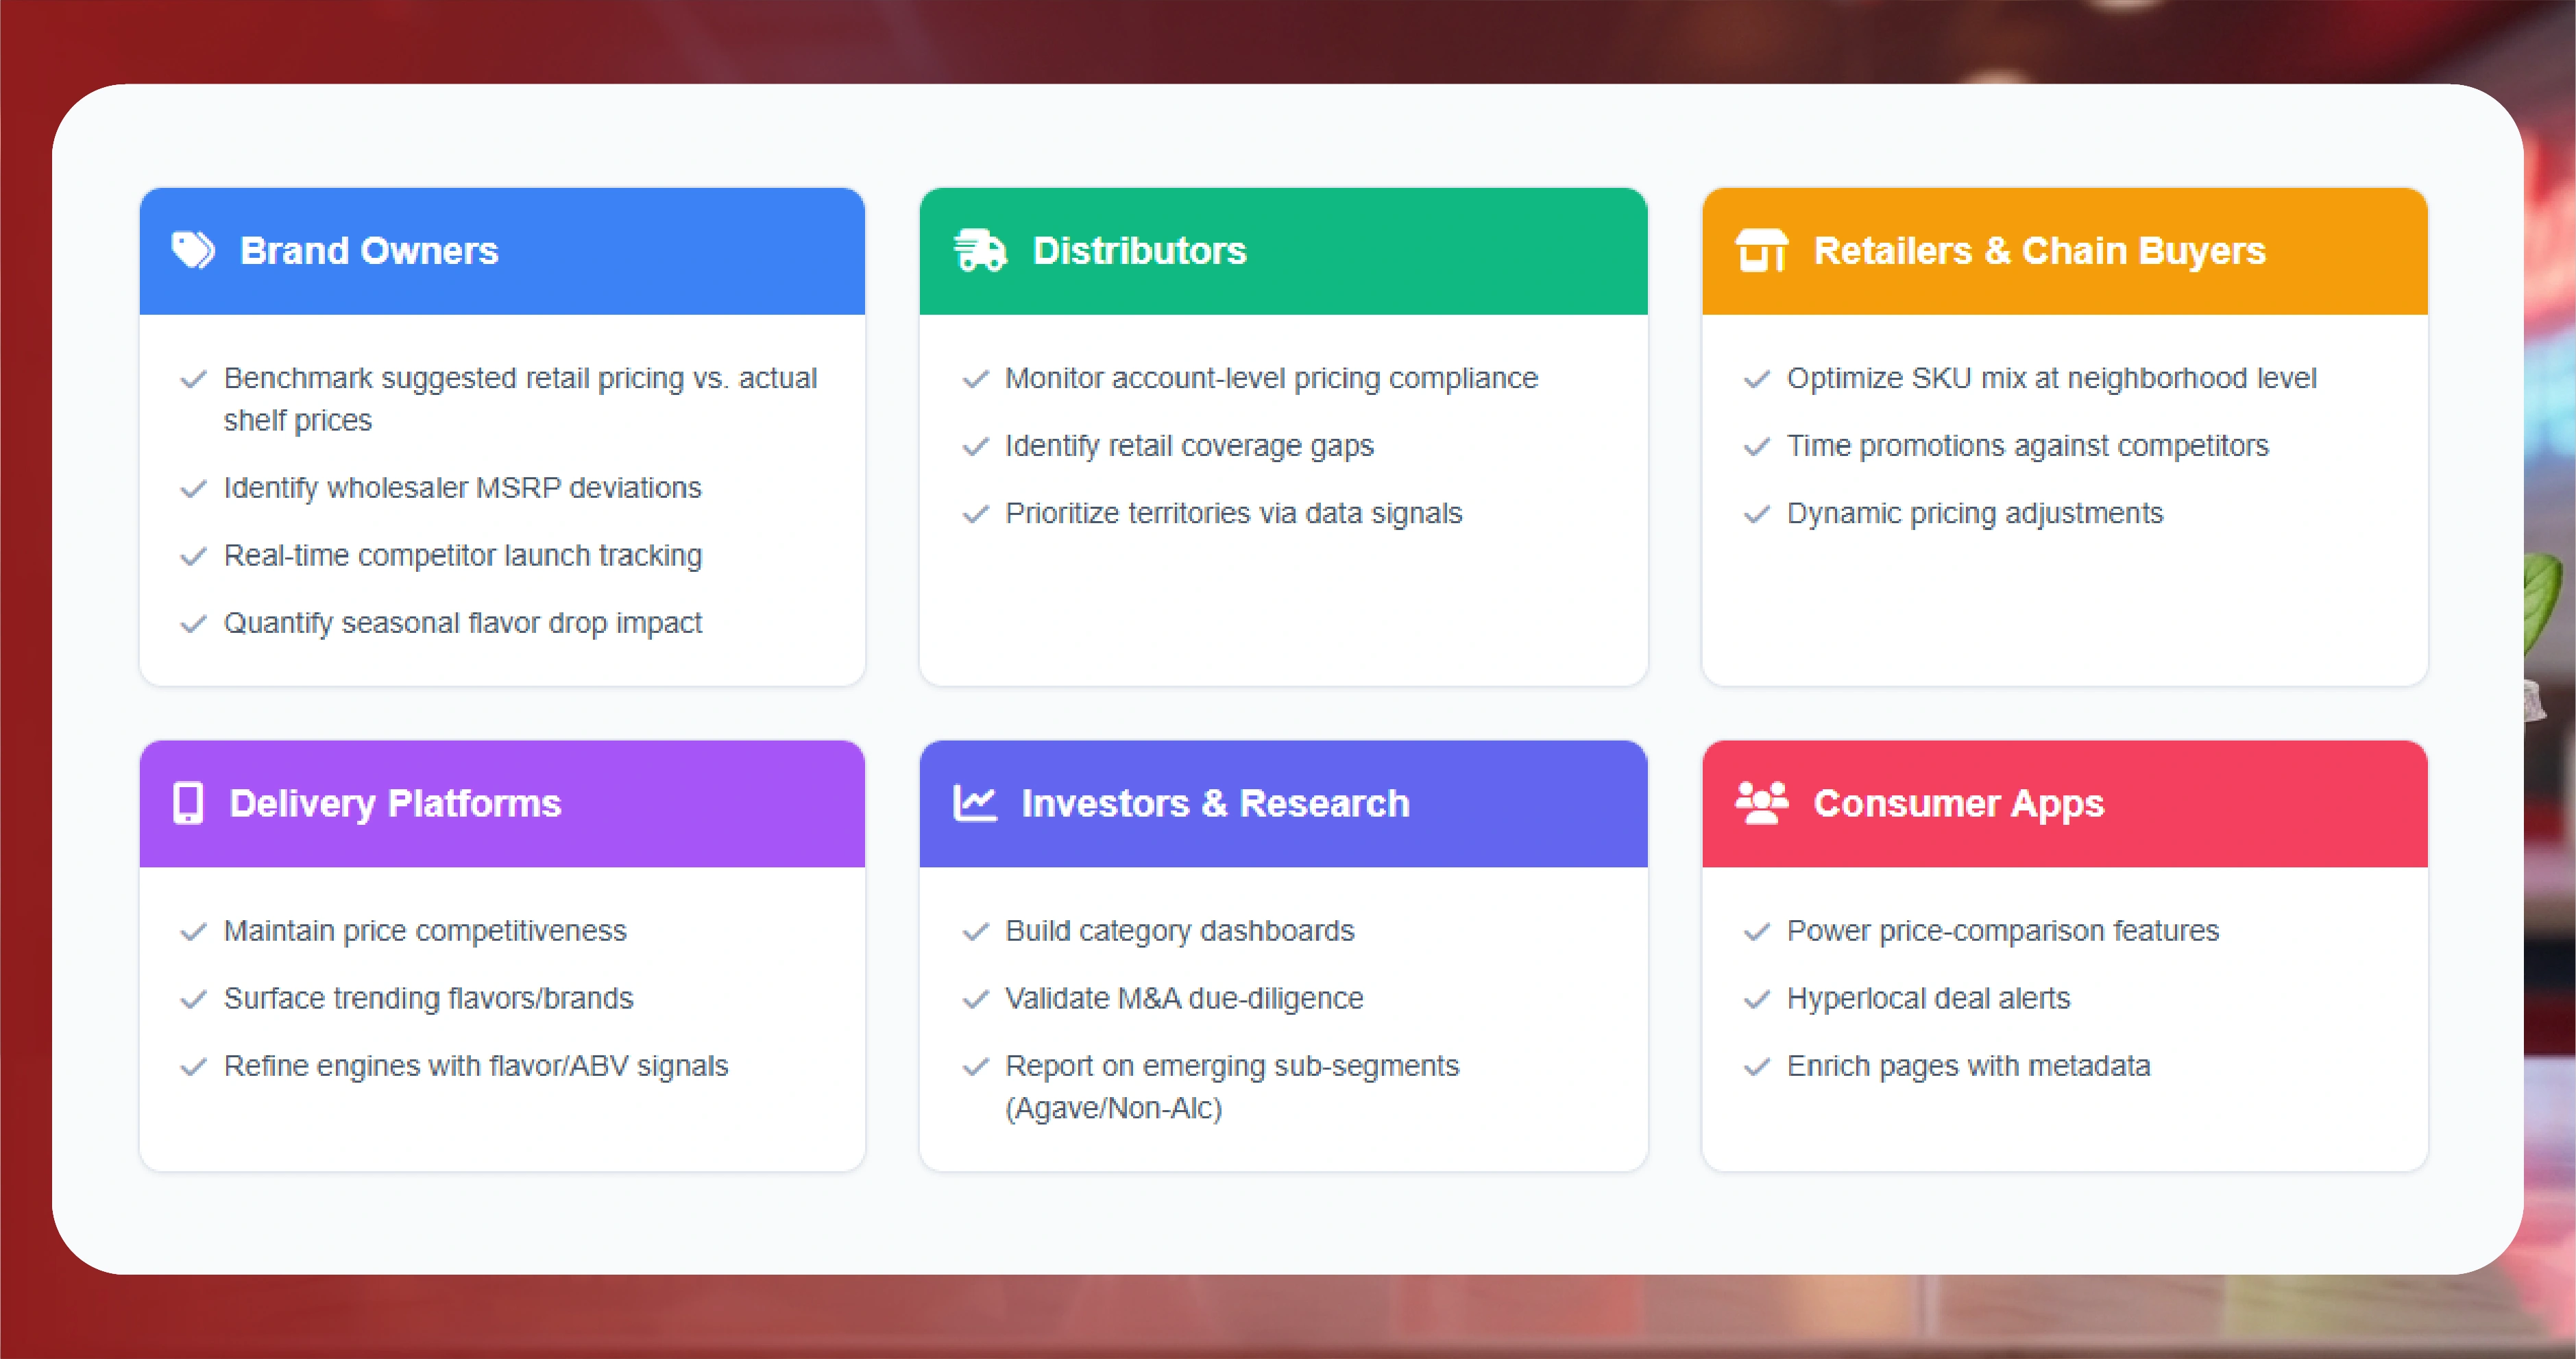
For brand owners: Benchmark suggested retail pricing against actual shelf prices, identify markets where wholesalers may be deviating from MSRP, track competitor product launches in near real time, and quantify the impact of seasonal flavor drops on competing SKUs.
For distributors: Monitor account-level pricing compliance, identify retail coverage gaps, and prioritize sales territories based on hard data signals — not gut instinct.
For retailers and chain buyers: Optimize SKU mix at the neighborhood level, time promotions to coincide with — or counter — competitor activity, and adjust pricing dynamically as market conditions shift.
For delivery platforms: Maintain price competitiveness, surface trending flavors and brands to consumers, and refine recommendation engines using flavor, brand, and ABV signals
For investors and market research firms:Build category dashboards, validate due-diligence assumptions during M&A processes, and produce defensible reports on emerging sub-segments like agave seltzers, premium spirit RTDs, and non-alcoholic crossovers.
For consumer-facing apps: Power price-comparison features, send hyperlocal deal alerts, and enrich product pages with cross-retailer context and flavor metadata.
These use cases all share one foundation: high-quality, well-structured hard seltzer competitor analysis data refreshed frequently enough to keep pace with the market.
Key Data Points Captured by Food Data Scrape
A robust canned beverage dataset goes far beyond a price tag. Our hard seltzer schema typically includes:
- Product name, brand, parent company, and sub-brand line
- Beverage type (hard seltzer, RTD cocktail, canned wine, hard tea, hard kombucha)
- Base alcohol type (malt, vodka, tequila, agave wine, real spirits)
- Flavor profile and primary fruit or botanical ingredients
- ABV, calorie count, sugar content, and carbohydrate data
- Pack format, can size, and number of flavors per variety pack
- Retail price, unit price, promotional price, and discount percentage
- Retailer name, retailer type, ZIP code, and geocoordinates
- Stock availability and out-of-stock duration
- Release date, seasonal flag, and limited-edition indicators
- Image URLs and product page URLs
- Consumer ratings and review counts where available
This rich schema enables sophisticated analysis — for example, correlating flavor launches with category-wide pricing pressure, or tracking how a viral social media moment shifts shelf availability over the following 14 days.
Why Choose Food Data Scrape
Many companies attempt to build in-house scraping for the canned beverage category and quickly discover the hidden complexity: hundreds of unique retailer site structures, frequent layout changes, anti-bot defenses, variety pack parsing edge cases, and the constant churn of new SKUs entering and exiting the market. Maintaining all of that internally is a full-time engineering burden that distracts from core business priorities
Food Data Scrape solves this with managed infrastructure, ethical and compliant data collection practices, and deep domain expertise in the food and beverage vertical. Our advantages include compliance-first architecture, scalable extraction across millions of pages daily, fully customizable schemas tailored to client needs, near-real-time refresh on priority SKUs, dedicated analyst support, and canned drinks market trends dashboards that highlight what is moving and what is fading. Whether you need a one-time market snapshot or an always-on pipeline feeding your BI stack, our team configures a delivery model that fits your workflow.
Conclusion: Riding the Canned Wave with Confidence
The hard seltzer and broader canned beverage category is one of the most dynamic, fragmented, and opportunity-rich segments in American alcohol today. Brands rise and fall in months, flavors trend and fade in weeks, and pricing power shifts neighborhood by neighborhood. In a market this fast, intuition is no substitute for intelligence.
Food Data Scrape exists to give brand owners, retailers, distributors, investors, and analysts the cleanest, most comprehensive, and most timely hard seltzer market data available in the United States. Across more than 50 cities, thousands of retailers, and millions of weekly data points, we transform the chaotic web of canned beverage commerce into structured intelligence you can act on with confidence.
If you are ready to replace guesswork with insight and ride the canned beverage wave with strategic clarity, get in touch with Food Data Scrape today and unlock the visibility your business deserves.

