
The Client
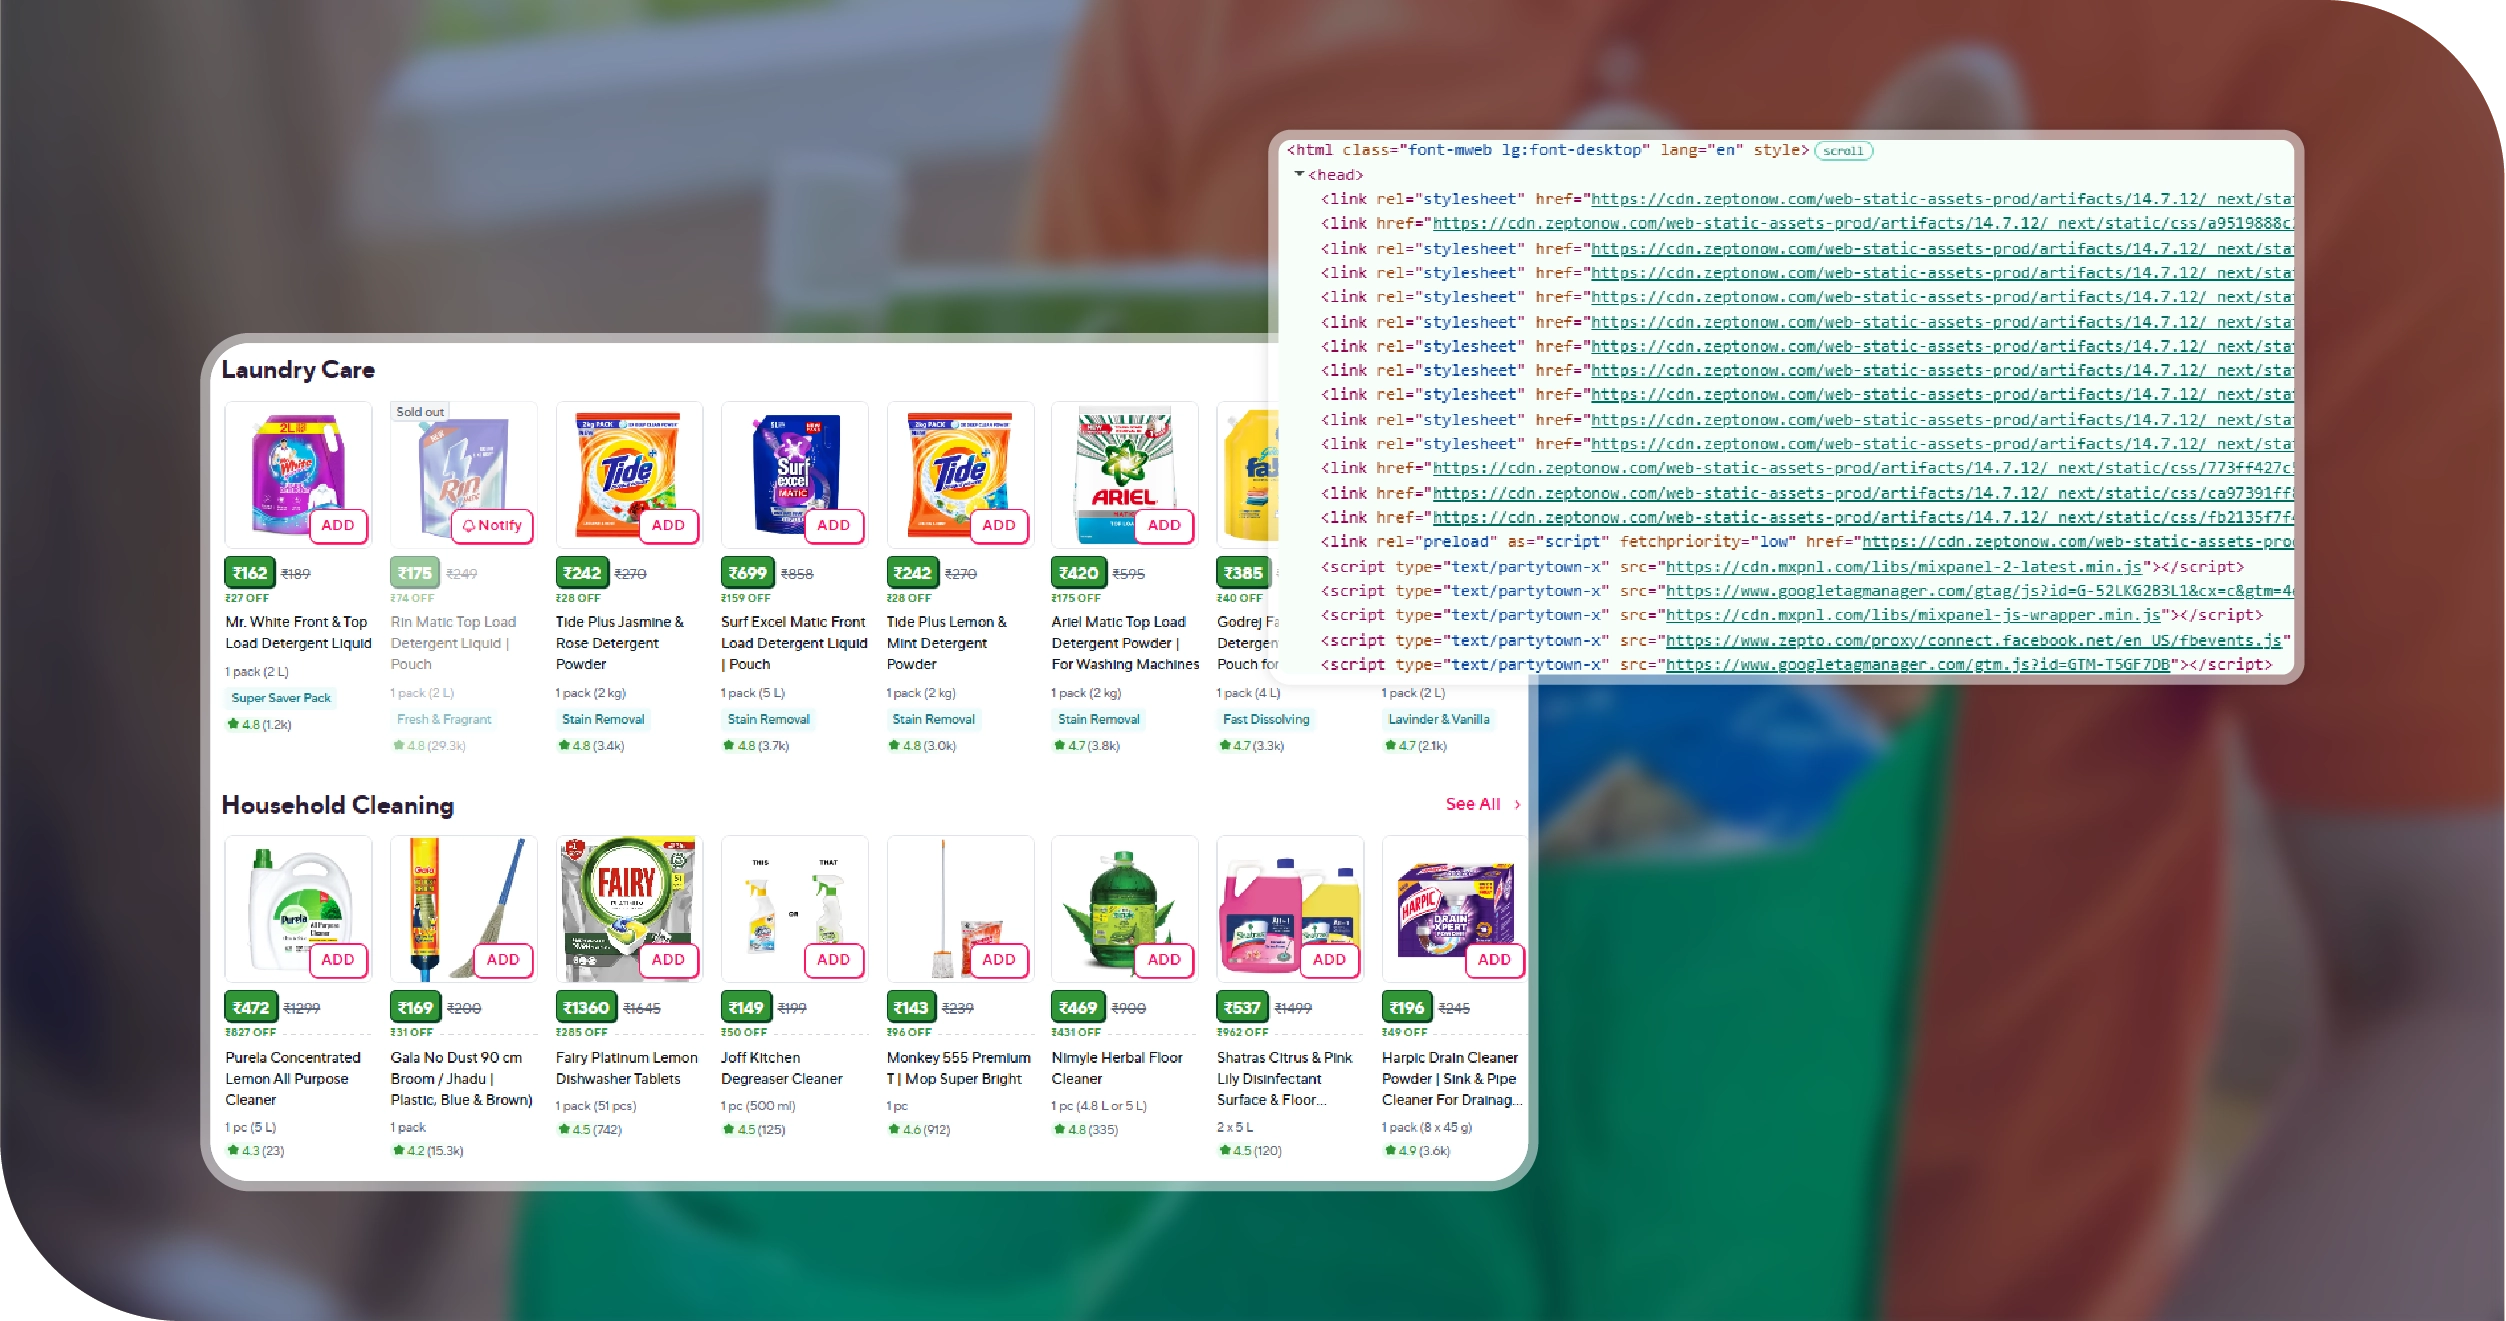
The client is a rapidly growing grocery retail chain focused on maximizing revenue by identifying high-potential products and optimizing inventory across stores. With an extensive product catalog spanning fresh, packaged, and specialty items, the client aimed to uncover opportunities where demand exceeded supply. To achieve this, the client sought to Scrape High-Demand / Low-Competition Grocery Product Data, enabling them to detect underrepresented SKUs with strong sales potential. Accurate, real-time insights were essential for prioritizing stocking and promotional strategies to capture untapped market demand efficiently. The client also leveraged tools to Extract High-Demand / Low-Competition Grocery Product Data, ensuring structured information for analysis, forecasting, and planning. Combined with robust Grocery App Data Scraping services, the firm gained visibility across multiple digital channels, monitored competitor offerings, and tracked emerging trends. These capabilities empowered the client to make faster, data-driven decisions, improve product assortment, and accelerate revenue growth.
Key Challenges
- Limited Visibility into Untapped Product Opportunities: The client struggled to identify high-demand products with low competition across multiple stores and regions. Without Grocery Delivery Scraping API Services, monitoring SKU availability and competitor gaps manually was time-consuming and prone to errors, limiting actionable insights.
- Difficulty in Tracking Price and Demand Trends: Manual data collection made it hard to analyze pricing patterns and demand fluctuations accurately. The absence of a centralized Grocery Price Dashboard delayed decision-making, reducing the client’s ability to respond quickly to emerging high-potential products.
- Inconsistent Competitive Benchmarking Across SKUs: Comparing product performance and pricing across regions and competitors was challenging. Without a unified Grocery Price Tracking Dashboard, teams could not efficiently monitor trends or adjust inventory and promotional strategies in a timely, data-driven manner.
Key Solutions
- Automated Multi-Channel Data Collection: We implemented a system that continuously collected product availability, pricing, and competitor information across multiple grocery platforms. This eliminated manual monitoring, ensured consistent SKU-level tracking, and provided the client with real-time visibility into high-demand, low-competition product gaps.
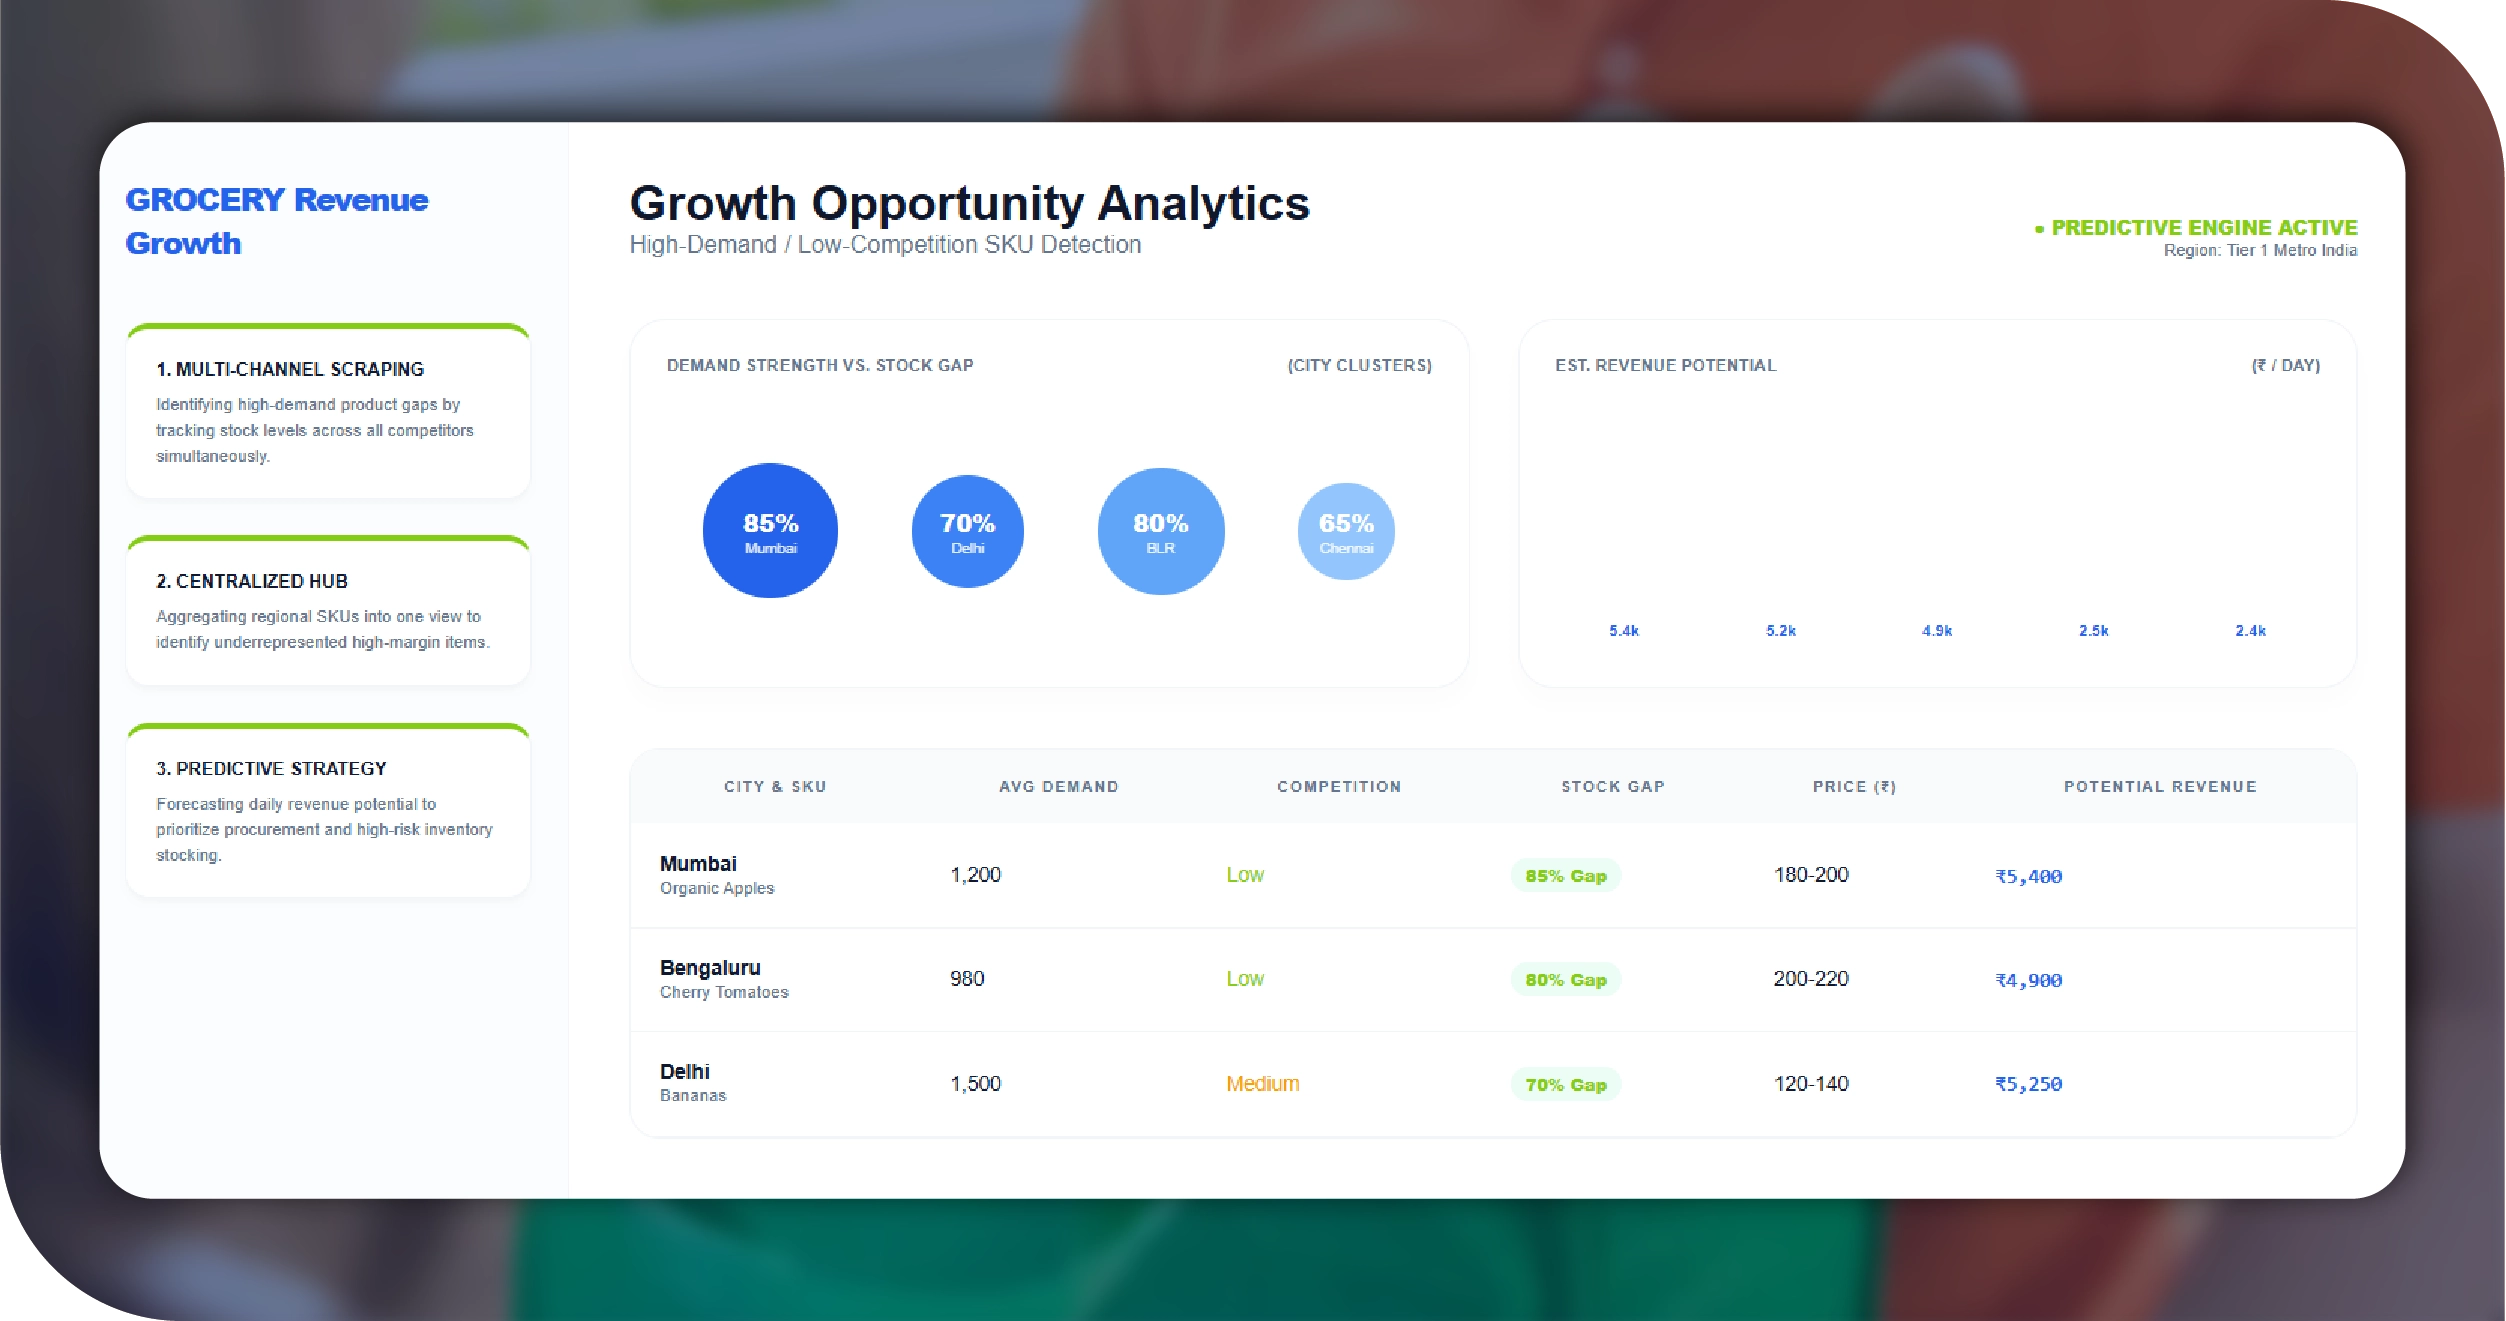
- Centralized Analytics and Visualization: Our solution aggregated all collected data into a single dashboard, enabling the client to easily track emerging trends, identify underrepresented SKUs, and benchmark product performance across regions. This improved decision-making and allowed teams to focus on strategic actions rather than data gathering.
- Predictive Insights for Product Strategy: We applied historical analysis and demand-supply correlation to identify potential revenue opportunities. By forecasting high-potential products and highlighting inventory gaps, the client could prioritize stocking, optimize promotions, and accelerate revenue growth effectively.
Sample High-Demand / Low-Competition Product Data
| City | SKU Category | Avg Daily Demand | Competitor Presence | Stock Gap Score | Price Range (₹) | Potential Revenue (₹/day) |
|---|---|---|---|---|---|---|
| Mumbai | Organic Apples | 1,200 | Low | 85% | 180 - 200 | 5,400 |
| Delhi | Bananas | 1,500 | Medium | 70% | 120 - 140 | 5,250 |
| Bengaluru | Cherry Tomatoes | 980 | Low | 80% | 200 - 220 | 4,900 |
| Hyderabad | Spinach | 850 | Low | 78% | 90 - 100 | 2,550 |
| Chennai | Carrots | 760 | Medium | 65% | 100 - 110 | 2,432 |
Methodologies Used
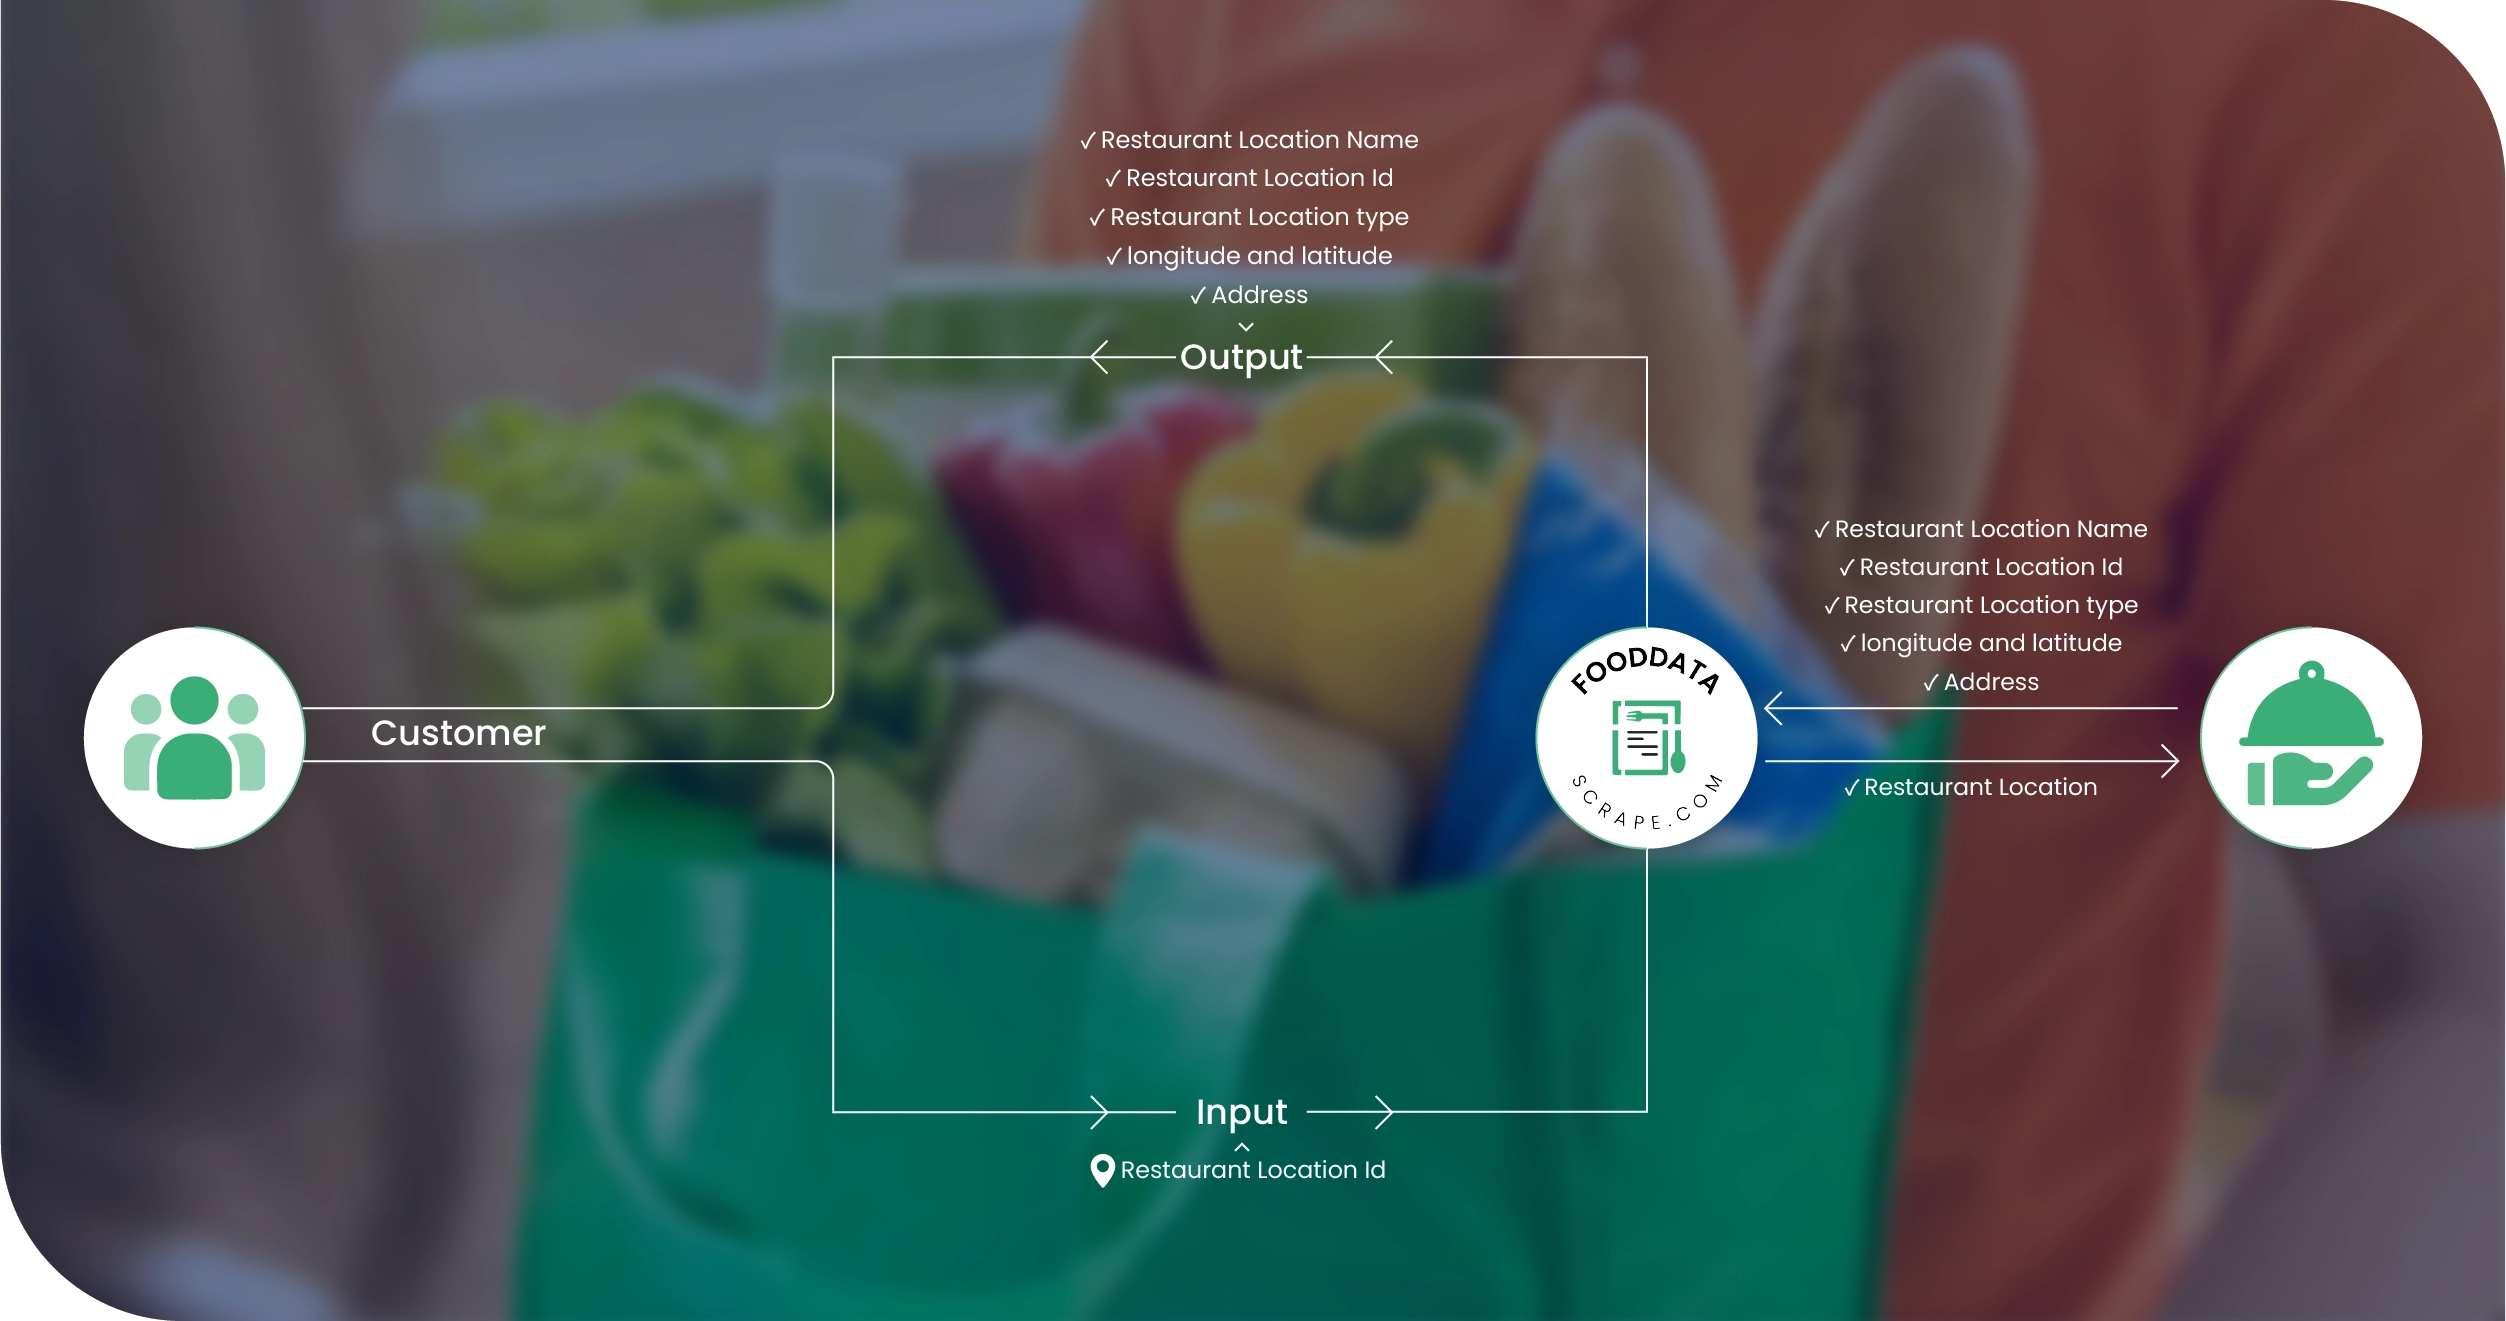
- Platform-Specific Data Mapping: We analyzed each grocery platform individually to understand product hierarchies, category structures, and update patterns. This ensured accurate SKU alignment, minimized mapping errors, and provided consistent data across stores, categories, and regions for reliable analysis.
- Hybrid Data Collection Approach: Data was collected using a combination of scheduled intervals and event-based triggers. High-demand or fast-moving products were monitored more frequently, ensuring timely detection of gaps without overloading the system with unnecessary data.
- Automated Data Validation and Cleansing: All collected information underwent real-time validation to remove duplicates, correct inconsistencies, and standardize formats. This process ensured that analysts worked with accurate, clean, and actionable data for decision-making.
- Demand-Supply Pattern Analysis: Historical demand and supply trends were studied to identify product gaps and high-potential SKUs. Correlating consumption patterns with competitor availability helped predict opportunities and guide inventory prioritization.
- Pilot Testing and Iterative Optimization: The solution was first deployed in select cities to test performance. Feedback from these pilots informed adjustments in thresholds, data rules, and workflows before full-scale rollout across all target markets.
Advantages of Collecting Data Using Food Data Scrape
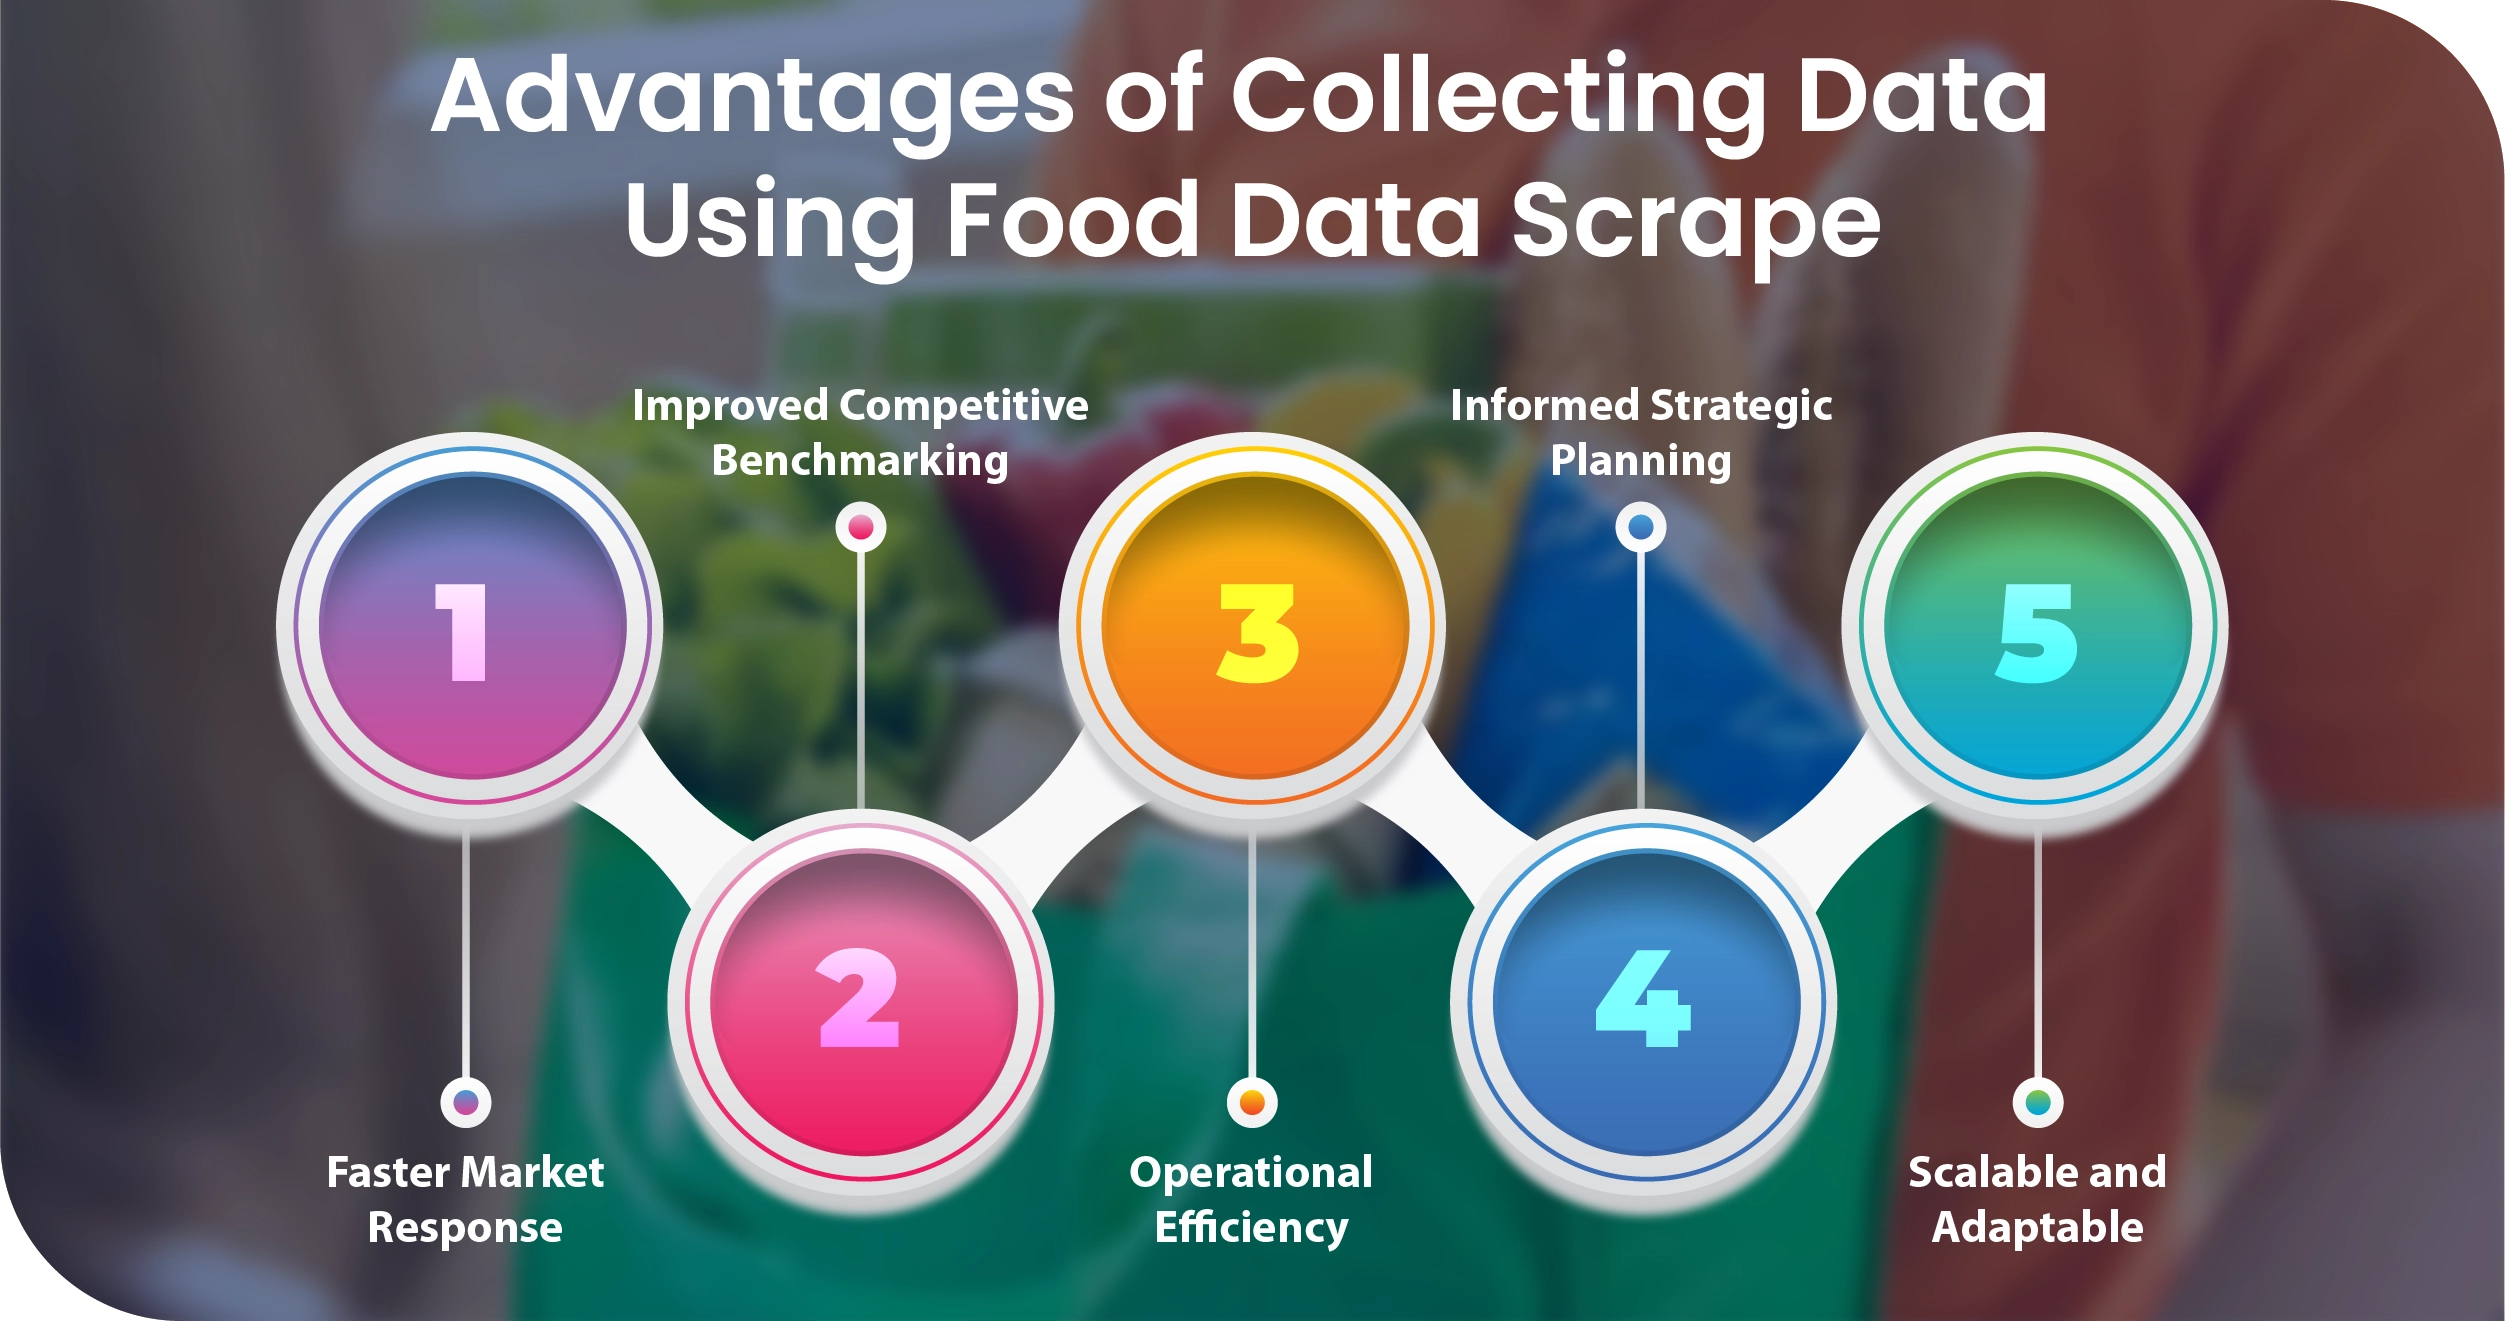
- Faster Market Response: Our services enable clients to detect product gaps and demand trends in real time, allowing faster reaction to emerging opportunities, minimizing missed sales, and supporting timely strategic decisions across multiple regions and product categories.
- Improved Competitive Benchmarking: By continuously monitoring product availability and performance, clients can compare their offerings against competitors, identify underrepresented SKUs, and adjust pricing or promotions to gain a market advantage.
- Operational Efficiency: Automated data collection reduces manual monitoring and reporting efforts, freeing teams to focus on analysis and strategy. This increases productivity, lowers operational costs, and ensures consistent, reliable data without human errors.
- Informed Strategic Planning: Structured insights from collected data help businesses optimize inventory, anticipate demand, and make better product assortment and stocking decisions, improving revenue potential and customer satisfaction across stores and channels.
- Scalable and Adaptable: The solution can easily expand to cover new cities, categories, or retailers, maintaining accuracy and reliability as business networks grow, enabling consistent decision-making even as operational complexity increases.
Client’s Testimonial
“Partnering on this project has been transformative for our business. The automated data collection and analytics provided clear visibility into high-demand, low-competition products across multiple cities. We could quickly identify product gaps, optimize inventory, and prioritize stocking strategies. The insights helped us reduce missed sales opportunities, respond faster to market trends, and improve overall revenue performance. The team’s expertise and reliable delivery made the entire process seamless, and the dashboards were intuitive and actionable. This solution has become a critical part of our operations, enabling data-driven decisions and strengthening our competitive position across India’s grocery retail market.”
Head of Operations
Final Outcomes:
The final outcome of the project delivered significant business impact for the client. By leveraging automated data collection and analysis, the client was able to identify high-demand, low-competition products across multiple Indian cities, enabling faster and more strategic inventory decisions. This proactive approach reduced stock gaps, minimized missed sales, and optimized product assortment for maximum revenue growth. Insights from Grocery Pricing Data Intelligence allowed the client to monitor market trends, competitor activity, and pricing dynamics in real time, improving decision-making efficiency. Additionally, structured and comprehensive Grocery Store Datasets provided SKU-level visibility and historical trends, supporting accurate forecasting, performance benchmarking, and long-term planning. Overall, the solution strengthened operational efficiency and competitive positioning in the Indian grocery retail sector.

