Introduction
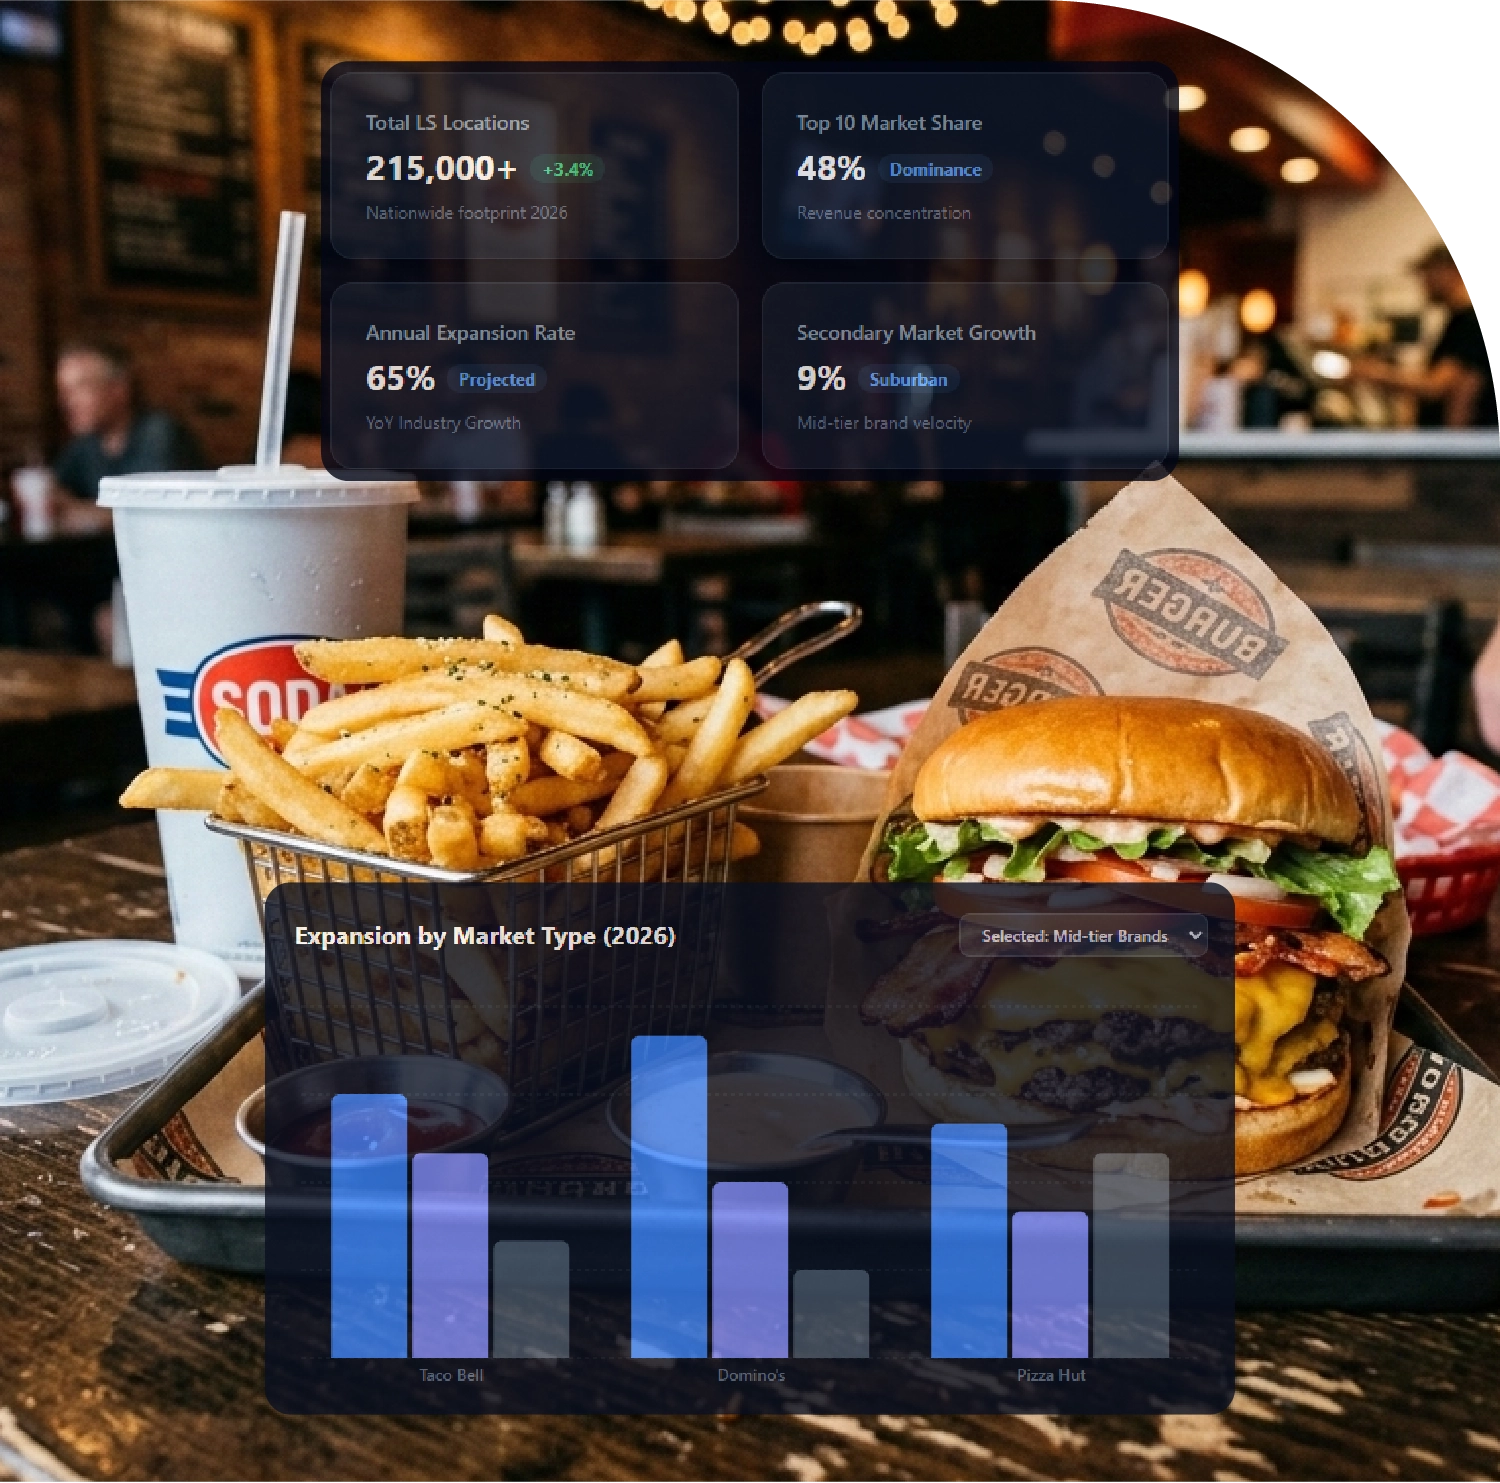
The limited-service restaurant (LSR) segment has maintained a commanding position in the U.S. foodservice market in 2026. Driven by convenience, affordability, and digital ordering growth, this segment includes quick-service restaurants (QSRs) and fast-casual brands. This report provides a detailed analysis of the 10 largest limited-service restaurant chains in the United States based on locations, states of operation, and city penetration. Businesses increasingly rely on structured intelligence to gain a competitive advantage using technologies like Scrape 10 Largest Limited-Service Restaurant Chains in USA – 2026 to track expansion, identify growth opportunities, and monitor competitors. Similarly, solutions like Extract 10 Largest Limited-Service Restaurant Chains USA – 2026 provide actionable insights on store distribution patterns, which are critical for strategic planning. For companies looking to capture emerging opportunities, Web Scraping 10 Largest Limited-Service Restaurant Chains USA is a foundational step in mapping the competitive landscape.
U.S. Limited-Service Restaurant Market Overview
Limited-service restaurants have evolved beyond simple counter service to embrace digital ordering, mobile apps, drive-thru optimization, and third-party delivery partnerships. In 2026, these factors, along with menu innovation and aggressive franchising, drive continued growth.
Brands are increasingly adopting Largest Limited Service Restaurant Chains Scraper USA 2026 to track the store network and expansion patterns across multiple states. 10 Largest Limited-Service Restaurant Chains Scraping USA provides detailed datasets, helping operators assess competitive density in urban, suburban, and rural areas. Moreover, Competitive Data Scraping from 10 Largest Restaurant Chains USA allows analysts to measure unit growth, menu pricing variations, and promotional strategies.
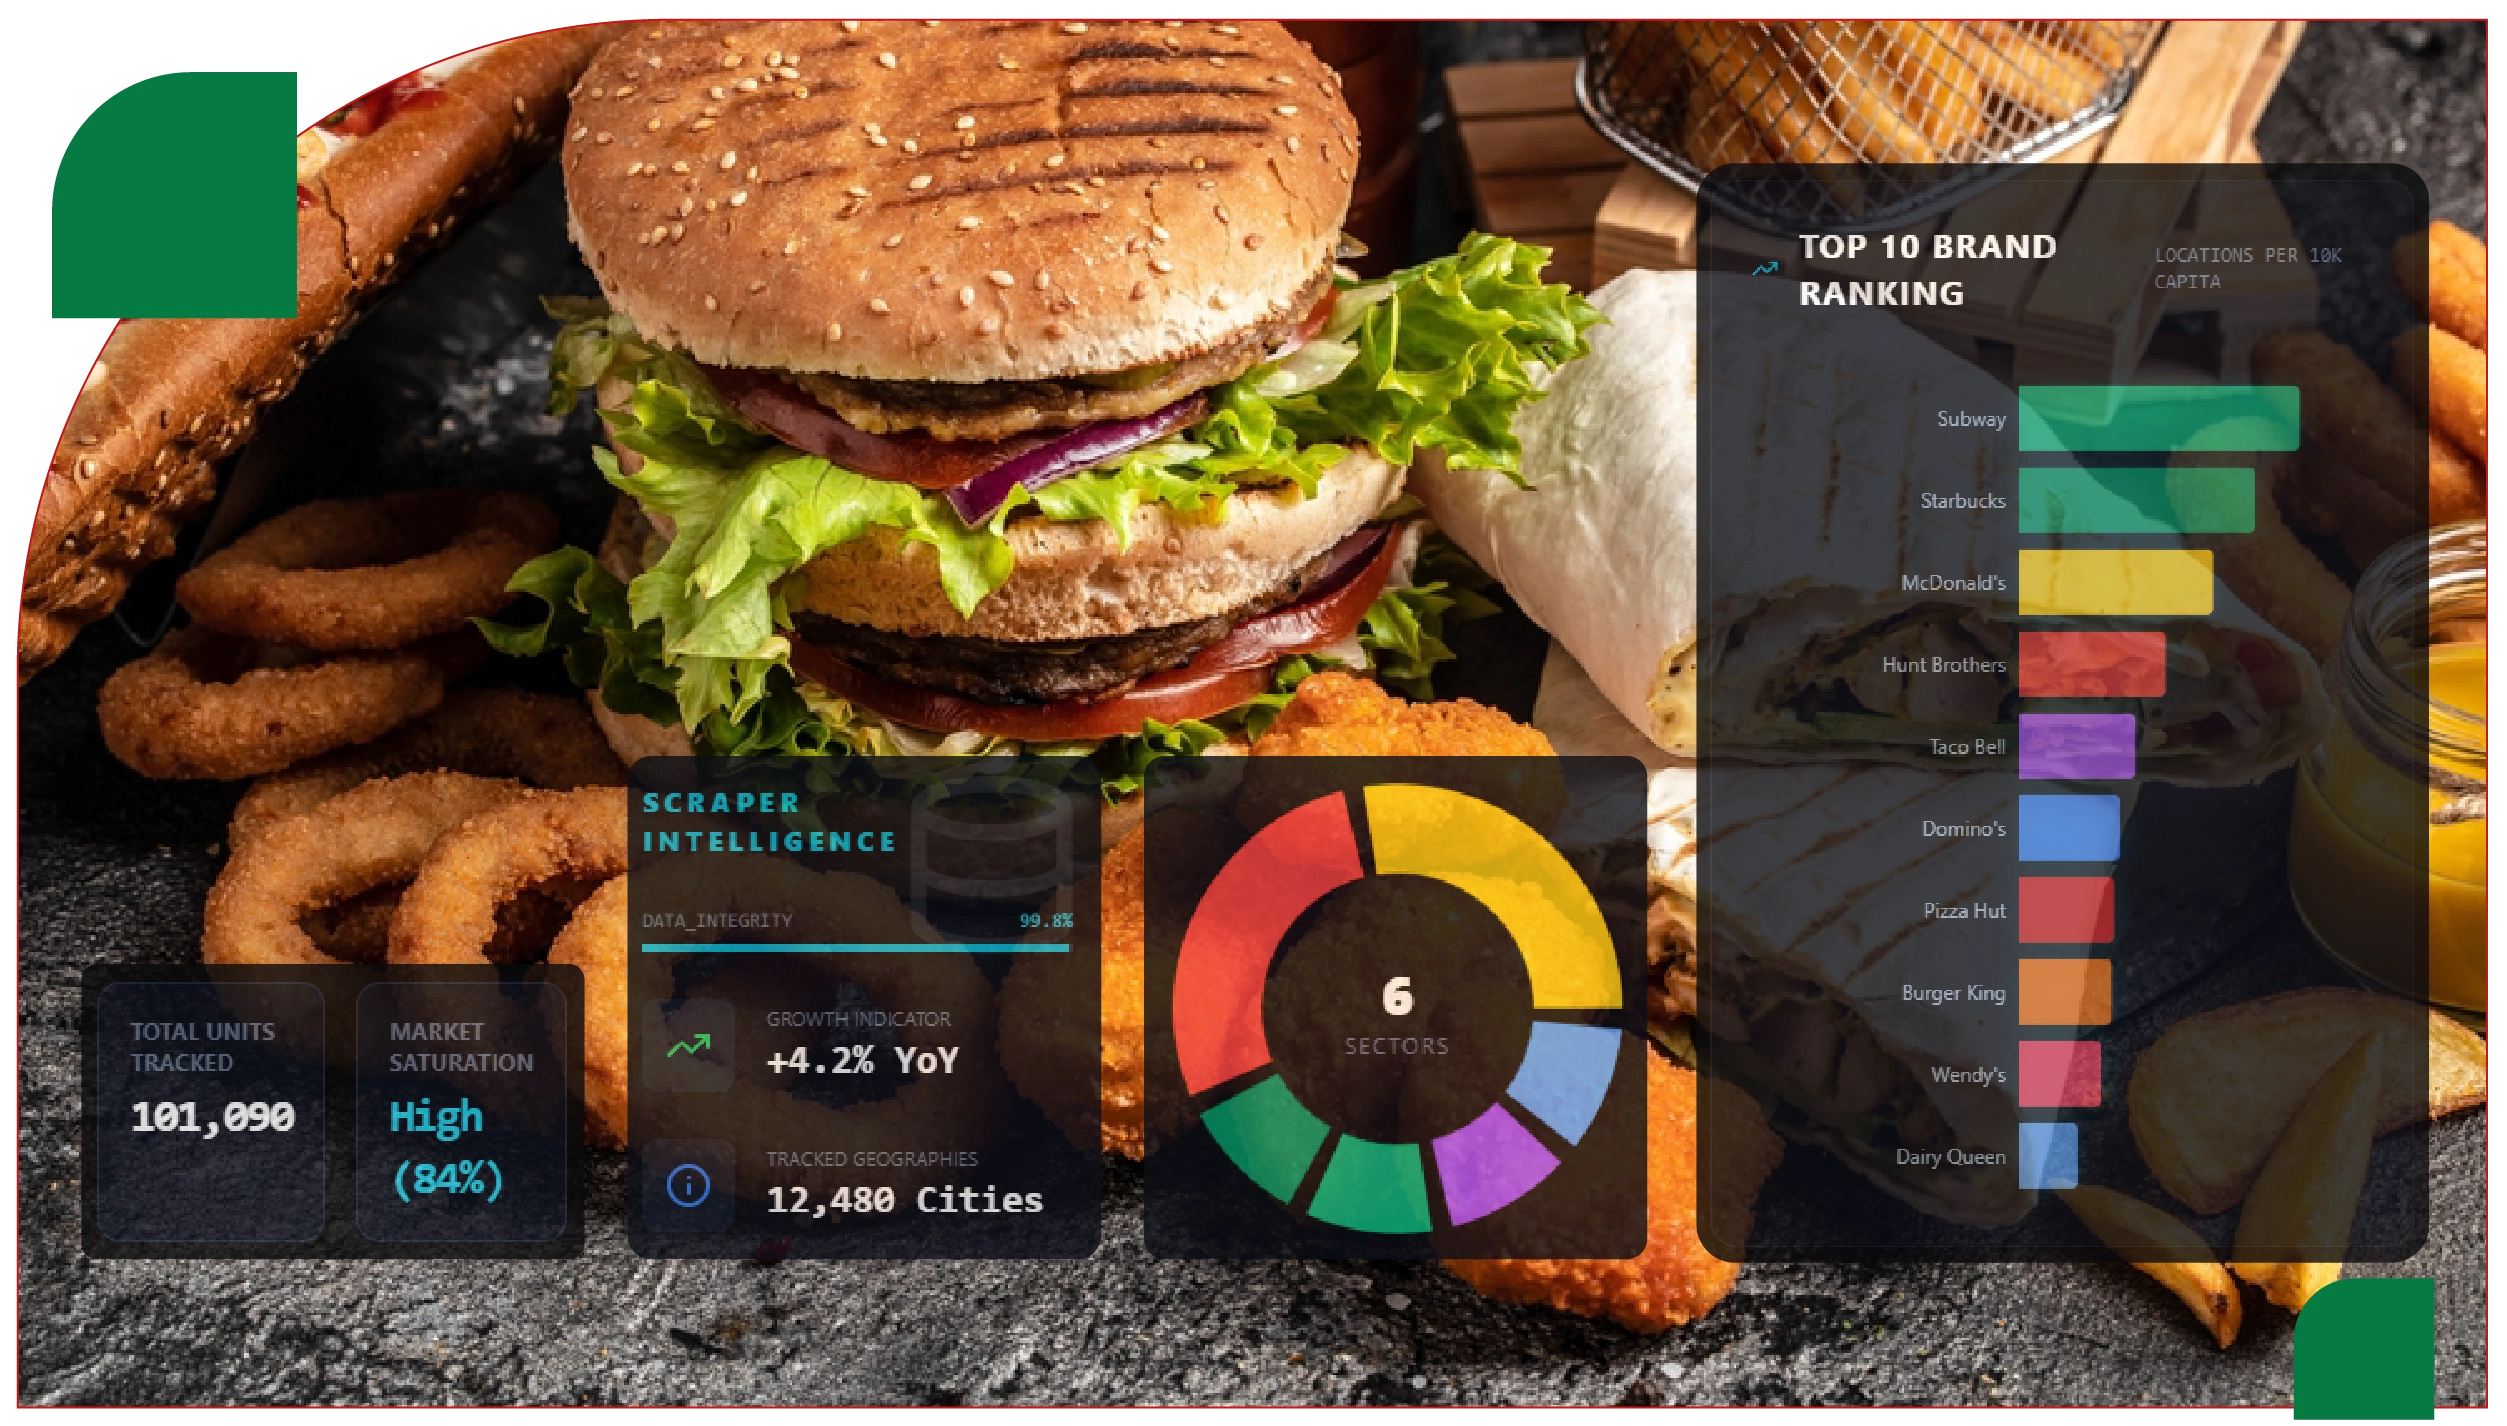
Top 10 Largest Limited-Service Restaurants in the U.S. – 2026
| Rank |
Brand |
Locations (2026 est.) |
States & Territories |
Cities Present |
Category |
| #1 |
Subway |
20,340 |
51 |
6,720 |
Sandwich QSR |
| #2 |
Starbucks |
17,120 |
52 |
3,940 |
Coffee & Beverages |
| #3 |
McDonald's |
14,050 |
54 |
5,110 |
Burger QSR |
| #4 |
Hunt Brothers Pizza |
10,620 |
37 |
4,610 |
Pizza/C-Store |
| #5 |
Taco Bell |
8,410 |
51 |
3,710 |
Mexican QSR |
| #6 |
Domino's Pizza |
7,310 |
52 |
3,760 |
Pizza Delivery |
| #7 |
Pizza Hut |
6,880 |
52 |
3,260 |
Pizza Dine-In/Delivery |
| #8 |
Burger King |
6,720 |
51 |
3,280 |
Burger QSR |
| #9 |
Wendy's |
5,960 |
51 |
2,880 |
Burger QSR |
| #10 |
Dairy Queen |
4,240 |
49 |
2,720 |
Ice Cream/Grill |
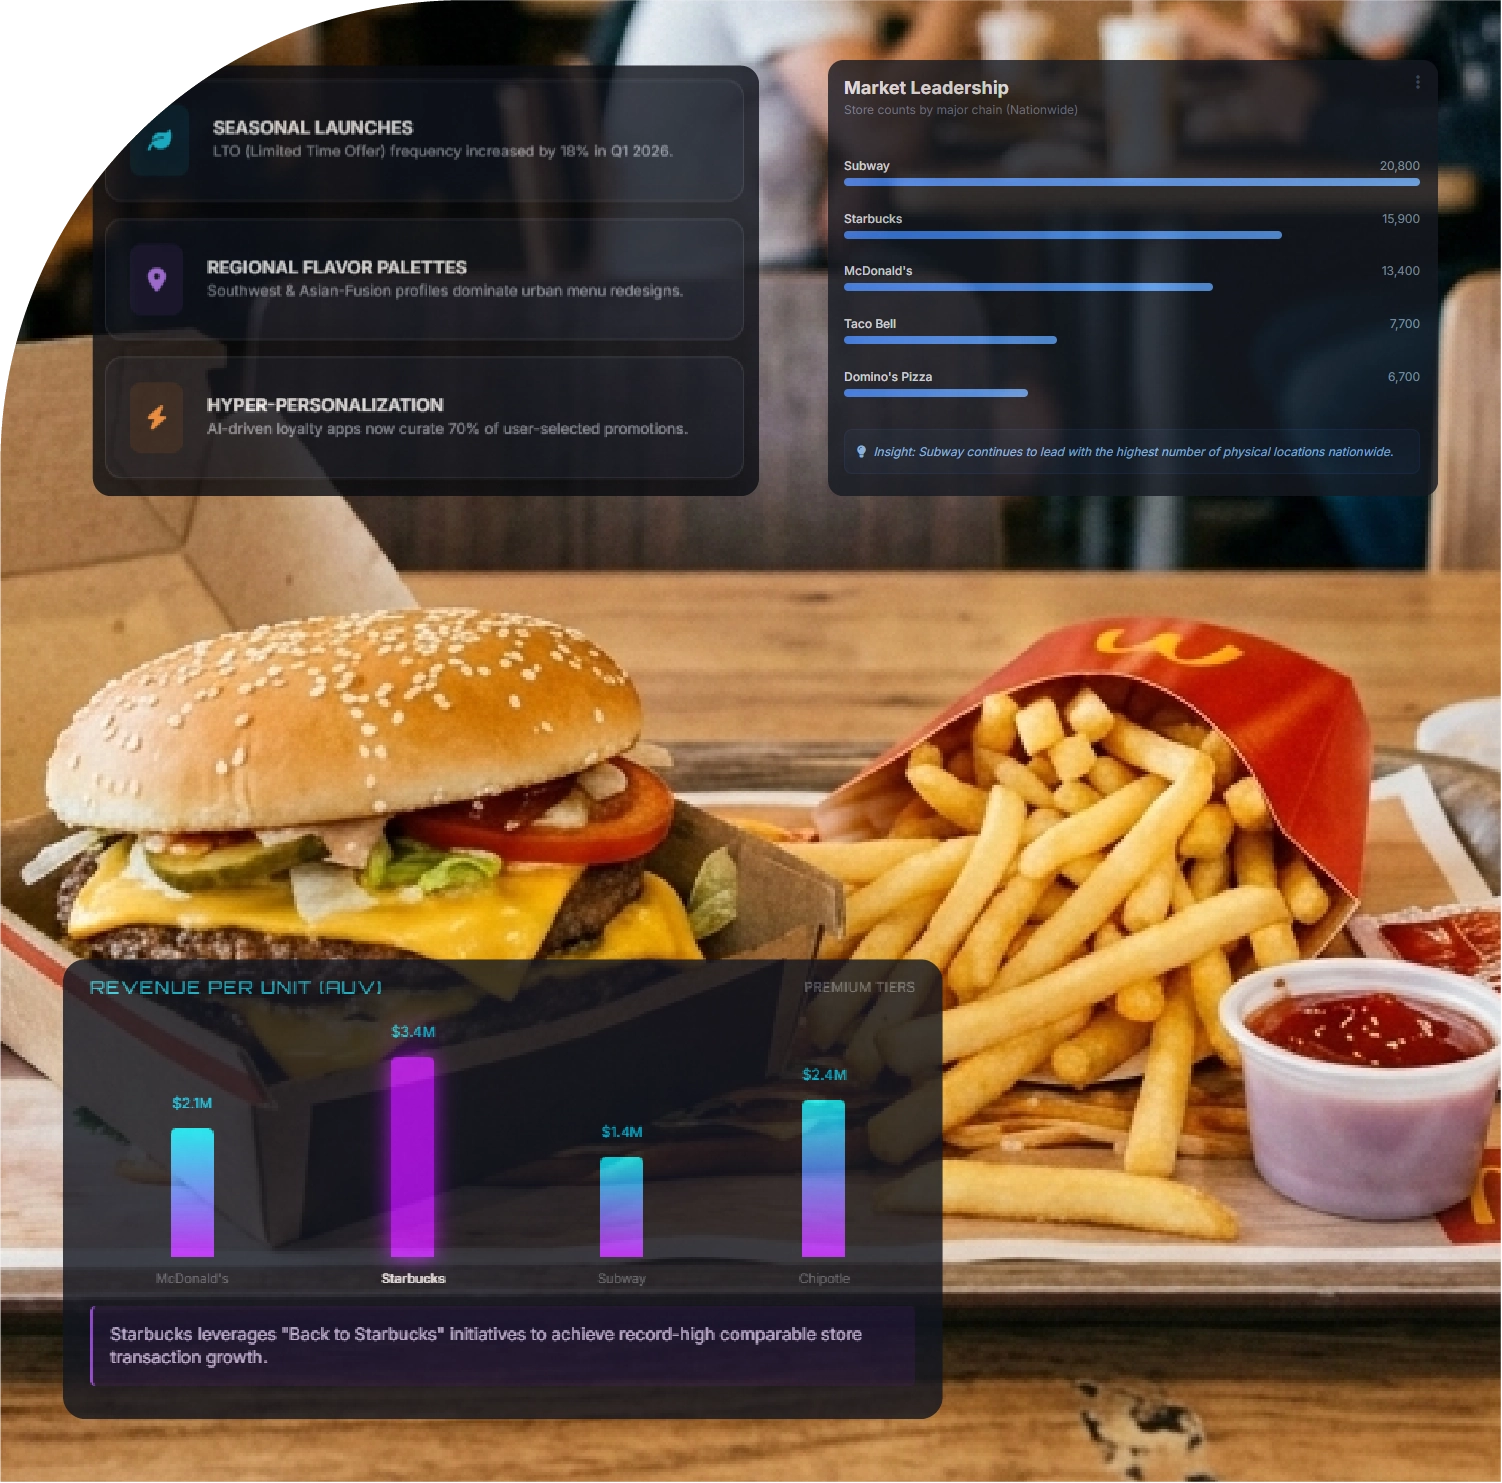
Subway remains the largest limited-service restaurant in the U.S., operating over 20,000 locations nationwide. California is its most saturated market, representing approximately 9.7% of its total footprint. Starbucks, with more than 17,000 stores, leads in beverage-driven revenue and high-traffic urban locations. McDonald's continues its dominance in the burger segment, with over 14,000 restaurants spread across all states and territories.
Tracking these large chains using Web Scraping Food Delivery Data allows market analysts to measure unit-level growth, city saturation, and geographic gaps.
Geographic Distribution and State-Level Dominance
| Brand |
Leading State |
Locations in Leading State |
% of Brand Total |
Expansion Trend |
| Subway |
California |
1,980 |
9.7% |
West Coast |
| Starbucks |
California |
3,120 |
18.2% |
West Coast |
| McDonald's |
Texas |
1,310 |
9.3% |
South Expansion |
| Hunt Brothers Pizza |
Texas |
1,250 |
11.8% |
Convenience Store Growth |
| Taco Bell |
California |
920 |
10.9% |
West Coast |
| Domino’s Pizza |
Texas |
805 |
11.0% |
Delivery Expansion |
| Pizza Hut |
Texas |
940 |
13.6% |
Mixed Channel |
| Burger King |
Texas |
590 |
8.7% |
South Expansion |
| Wendy’s |
Florida |
510 |
8.5% |
Southeast Focus |
| Dairy Queen |
Texas |
550 |
13.0% |
South Expansion |
Texas, California, and Florida dominate the market due to population density, economic growth, and tourism demand. Mid-tier markets like Ohio, Georgia, and Pennsylvania are increasingly targeted by brands using method to Extract Restaurant Menu Data to optimize offerings based on local preferences.
Key Operational Insights for 2026
- Digital Ordering Optimization – Starbucks and Domino’s report that 40–45% of sales originate from mobile and web platforms. Leveraging Food Delivery Scraping API enables brands to track menu items, promotions, and digital performance across competitors.
- Drive-Thru and Pickup Expansion – McDonald’s, Taco Bell, and Burger King have redesigned drive-thru layouts for double-lane efficiency and faster turnaround.
- Menu Innovation Frequency – Hunt Brothers Pizza, Domino’s, and Pizza Hut launch seasonal and regional menu items, which can be monitored via Restaurant Data Intelligence to inform competitor benchmarks.
- Value Menu Strategy – Wendy’s and Burger King introduce tiered value bundles, combining digital coupons with in-store promotions. Competitive Data Scraping from 10 Largest Restaurant Chains USA provides insights into pricing and discount patterns.
- Delivery Integration – Brands integrate third-party platforms like DoorDash and Uber Eats. Collecting data via Extract Restaurant Menu Data ensures menu accuracy and delivery pricing optimization.
City Penetration and Expansion Strategy
Top metropolitan areas, including Los Angeles, New York City, Chicago, Dallas, and Houston, remain dense with LSR locations. However, expansion in tier-2 cities, highway corridors, and suburban clusters is increasing. Chains using Largest Limited Service Restaurant Chains Scraper USA 2026 can identify underpenetrated markets and monitor competitor saturation.
Ghost kitchens, co-branded locations, and micro-franchise models further enhance penetration without requiring large real estate investments. Analysts use 10 Largest Limited-Service Restaurant Chains Scraping USA and Web Scraping Food Delivery Data to understand consumer demand patterns and menu popularity in these emerging regions.
Competitive Market Dynamics
- Top-tier brands (Subway, Starbucks, McDonald’s) account for approximately 50% of all locations in the top 10, reflecting strong market control.
- Mid-tier players like Taco Bell, Domino’s, Pizza Hut, and Hunt Brothers Pizza show higher year-on-year expansion percentages, especially in secondary markets.
- Price intelligence, menu innovation, and local marketing campaigns are closely monitored via Food Delivery Scraping API solutions.
Urban competition is highest in California, Texas, and Florida, while rural and suburban growth is strongest in the Midwest and Mountain states. Using Restaurant Data Intelligence, analysts can quantify growth opportunities and identify potential cannibalization risks among brands.
Emerging Trends 2026–2027
- AI-driven demand forecasting helps optimize inventory, staffing, and menu rotation.
- Hyperlocal promotions and dynamic pricing models are increasingly adopted by Starbucks, Domino’s, and Taco Bell.
- Subscription-based beverage and meal programs are gaining traction, particularly in high-density urban areas.
- Ghost kitchens and shared spaces reduce overhead costs while increasing delivery capacity.
Brands monitoring these trends with Web Scraping Food Delivery Data gain insights into expansion efficiency, menu appeal, and competitive strategy.
Conclusion
The 10 largest limited-service restaurant chains in the United States in 2026 illustrate a highly competitive yet data-driven market. Subway leads in store count, Starbucks dominates beverage revenues, and McDonald’s remains the burger segment leader. Mid-tier brands like Taco Bell, Domino’s, and Pizza Hut expand strategically into underpenetrated markets.
Companies leveraging Food delivery Intelligence can track real-time operational performance, while tools like a Food Price Dashboard allow monitoring of promotions, menu pricing, and competitive positioning. Consolidated Food Datasets provide actionable insights to optimize expansion, pricing strategies, and digital integration, ensuring a strategic edge in the fast-evolving U.S. limited-service restaurant market.
If you are seeking for a reliable data scraping services, Food Data Scrape is at your service. We hold prominence in Food Data Aggregator and Mobile Restaurant App Scraping with impeccable data analysis for strategic decision-making.