Introduction
The functional soda category has rapidly emerged as one of the fastest-growing segments in the global beverage market. Consumers increasingly prefer beverages that combine taste with health benefits such as low sugar, prebiotic fiber, and gut-health support. In this evolving landscape, two brands dominate digital retail shelves: Olipop and Poppi. Both brands position themselves as healthier alternatives to traditional carbonated beverages and compete aggressively across major e-commerce and omnichannel retail platforms including Walmart, Target, and Amazon.
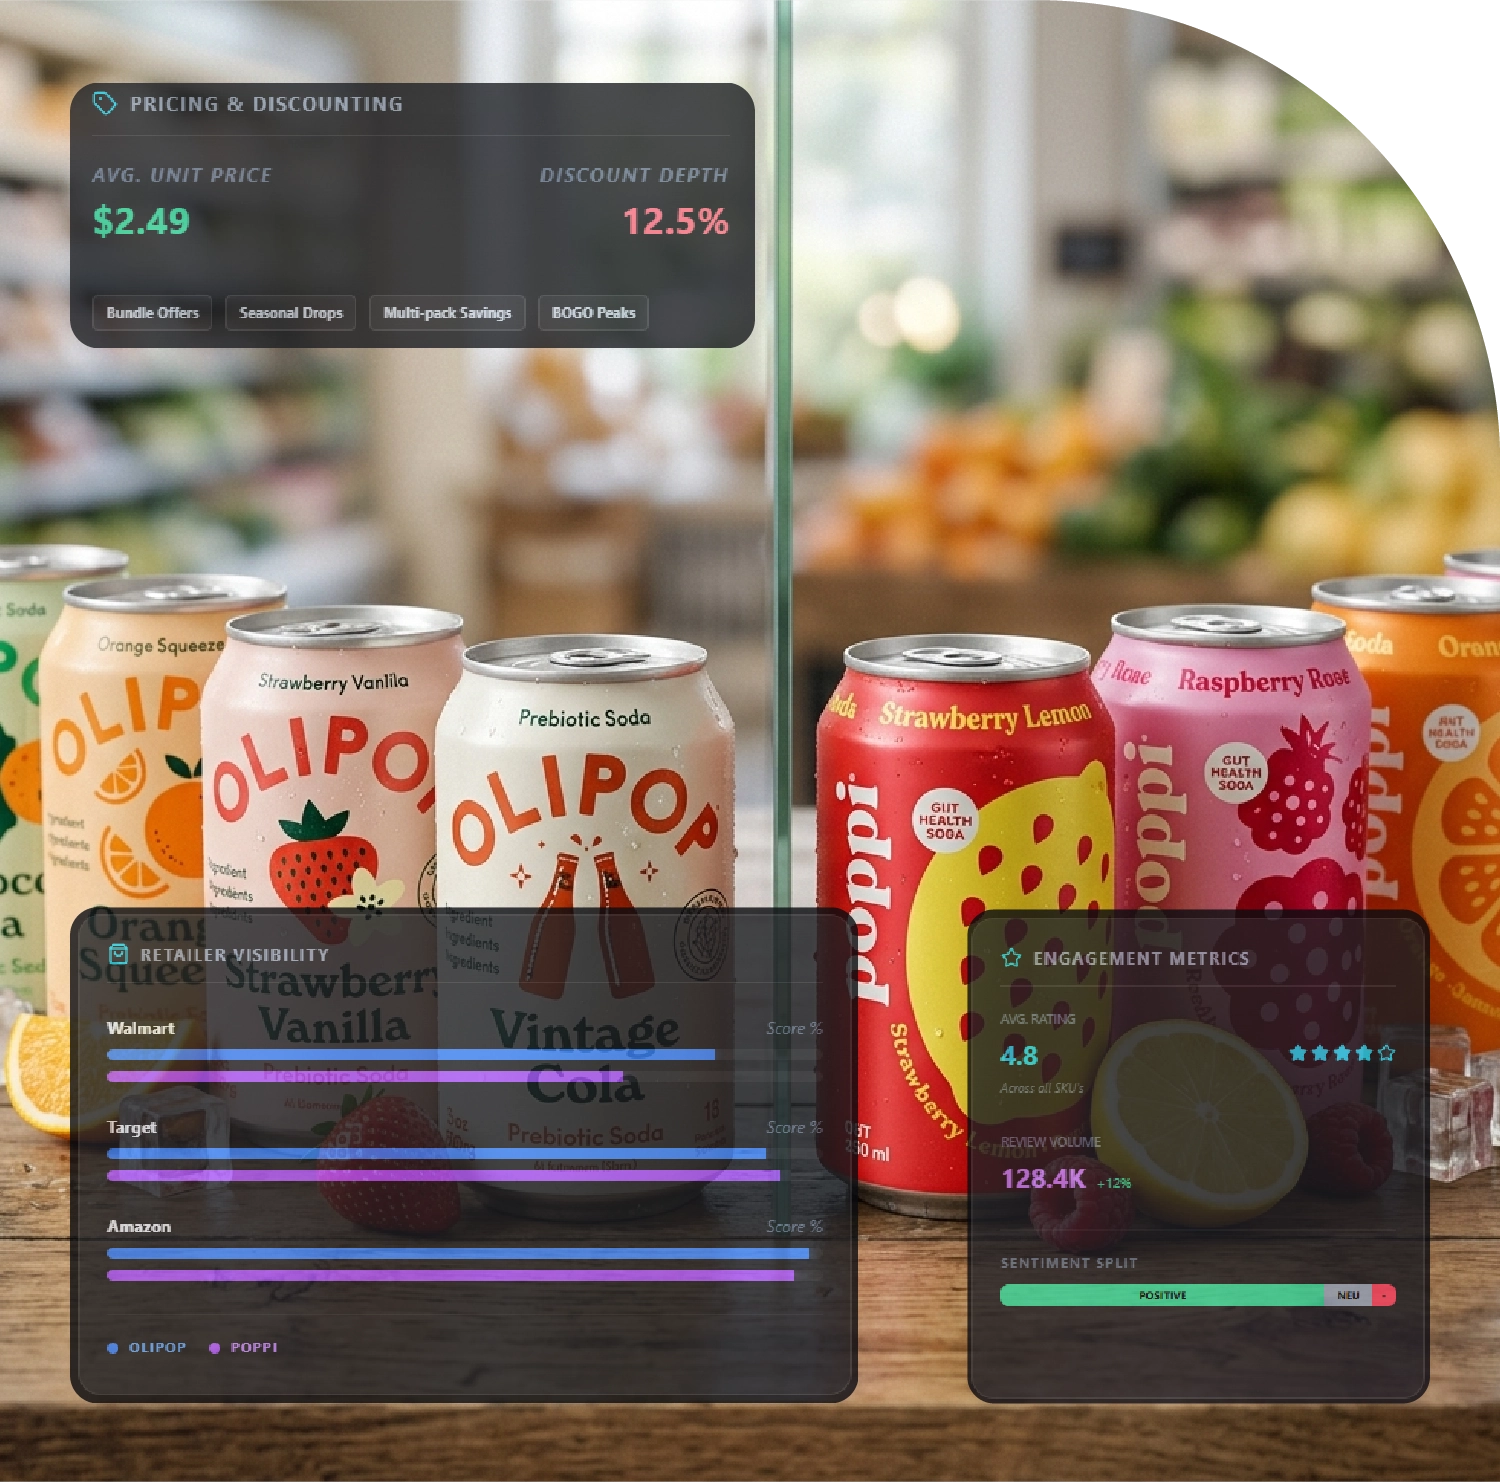
The growth of digital grocery platforms has made digital shelf share a critical metric for beverage brands. Digital shelf share measures how frequently a brand appears in search results, category pages, promotional placements, and sponsored listings across online marketplaces. Monitoring this data provides valuable insights into SKU visibility, pricing competitiveness, and promotional effectiveness.
Olipop vs Poppi - Digital Shelf Share Tracking Across Walmart, Target & Amazon highlights how these two functional soda brands compete for online visibility and consumer attention. Using Olipop Vs Poppi Digital Shelf Share Analysis, researchers can examine SKU distribution, promotional placements, search ranking performance, and category positioning across major digital retail environments.
Through Functional Soda Brand Data Scraping - Olipop vs Poppi, businesses can identify key indicators such as product availability, discount patterns, and retailer-specific assortment strategies. These insights help beverage companies optimize pricing, inventory, and marketing strategies in highly competitive digital grocery ecosystems.
The digital shelf analysis also reveals broader trends in consumer behavior, including increasing demand for functional beverages. The functional soda category grew from approximately $197 million in 2020 to over $440 million by 2024, driven by consumer interest in healthier soda alternatives.
Furthermore, both brands maintain strong retail distribution. Olipop is available in more than 65,000 retail locations nationwide, while Poppi expanded rapidly after its acquisition by PepsiCo, strengthening its presence across major grocery and online marketplaces.
Digital Shelf Importance in Functional Beverage Markets
Digital shelf analytics helps brands understand how consumers discover and compare products online. Unlike physical store shelves, digital shelves constantly change due to algorithmic rankings, sponsored listings, and promotional placements.
Key metrics tracked during method to Extract Beverage Data from Olipop vs Poppi include:
- Search ranking positions for keywords such as “prebiotic soda” or “healthy soda”
- SKU availability across retailers
- Product ratings and reviews
- Promotional placements
- Pricing and discount strategies
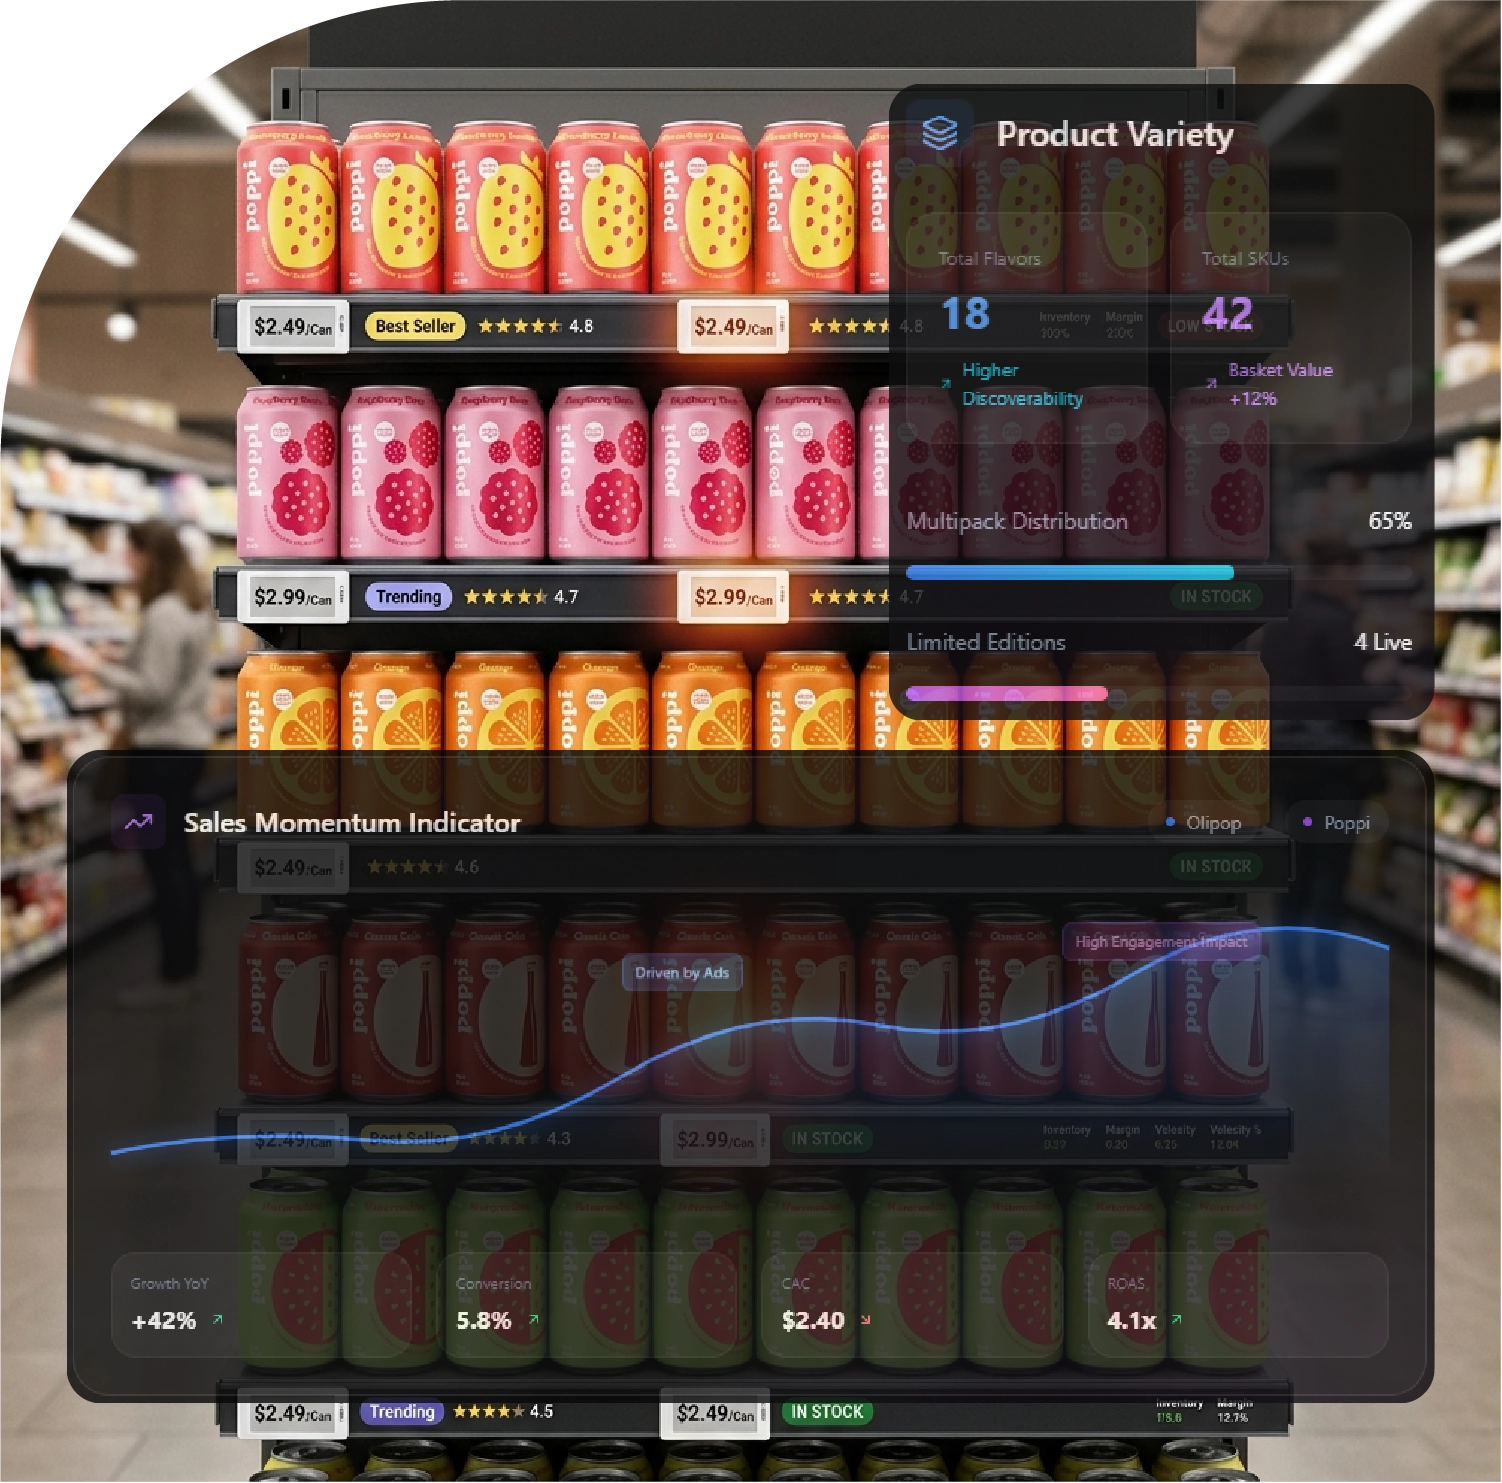
Brands that dominate digital shelf share often experience higher click-through rates, stronger conversion rates, and increased market share. As a result, Beverage Brand Competitive Benchmarking - Olipop vs Poppi has become an essential component of digital retail strategy.
Using Web Scraping Beverage Data - Olipop vs Poppi, analysts track SKU-level performance across online grocery platforms. This approach provides a granular understanding of how individual flavors, pack sizes, and product bundles perform across digital marketplaces.
Table 1: Digital Shelf Share Comparison Across Major Retail Platforms
| Retail Platform |
Metric |
Olipop Performance |
Poppi Performance |
Key Insights |
| Walmart |
Total SKUs Listed |
28 |
22 |
Olipop offers wider flavor assortment |
| Walmart |
Avg Search Rank |
#3 |
#5 |
Olipop appears earlier in category search |
| Walmart |
Sponsored Listings |
12 |
10 |
Both brands invest in sponsored placements |
| Walmart |
Avg Price per Can |
$2.49 |
$2.39 |
Poppi slightly lower pricing |
| Walmart |
Discount Frequency |
18% |
12% |
Olipop runs more promotional offers |
| Target |
Total SKUs Listed |
26 |
21 |
Olipop maintains larger assortment |
| Target |
Category Page Visibility |
34% |
29% |
Olipop stronger presence on category pages |
| Target |
Featured Promotions |
8 |
6 |
Olipop receives more promotional banners |
| Target |
Avg Customer Rating |
4.6 |
4.4 |
Both brands maintain strong reviews |
| Target |
Bundle Availability |
7 bundles |
5 bundles |
Olipop promotes multipack bundles |
| Amazon |
Total Listings |
30 |
27 |
Amazon has broader selection for both brands |
| Amazon |
Monthly Units Sold |
2.8M |
3.3M |
Poppi leads Amazon sales volume |
| Amazon |
Sponsored Ads |
15 |
17 |
Poppi invests heavily in Amazon advertising |
| Amazon |
Avg Discount |
14% |
11% |
Olipop offers stronger promotional deals |
| Amazon |
Buy Box Ownership |
84% |
79% |
Olipop maintains stable seller control |
This dataset demonstrates how digital shelf share varies by retailer. Olipop generally leads in assortment size and promotional visibility, while Poppi shows stronger sales velocity on Amazon due to aggressive advertising and strong brand recognition.
Pricing and Promotion Strategies
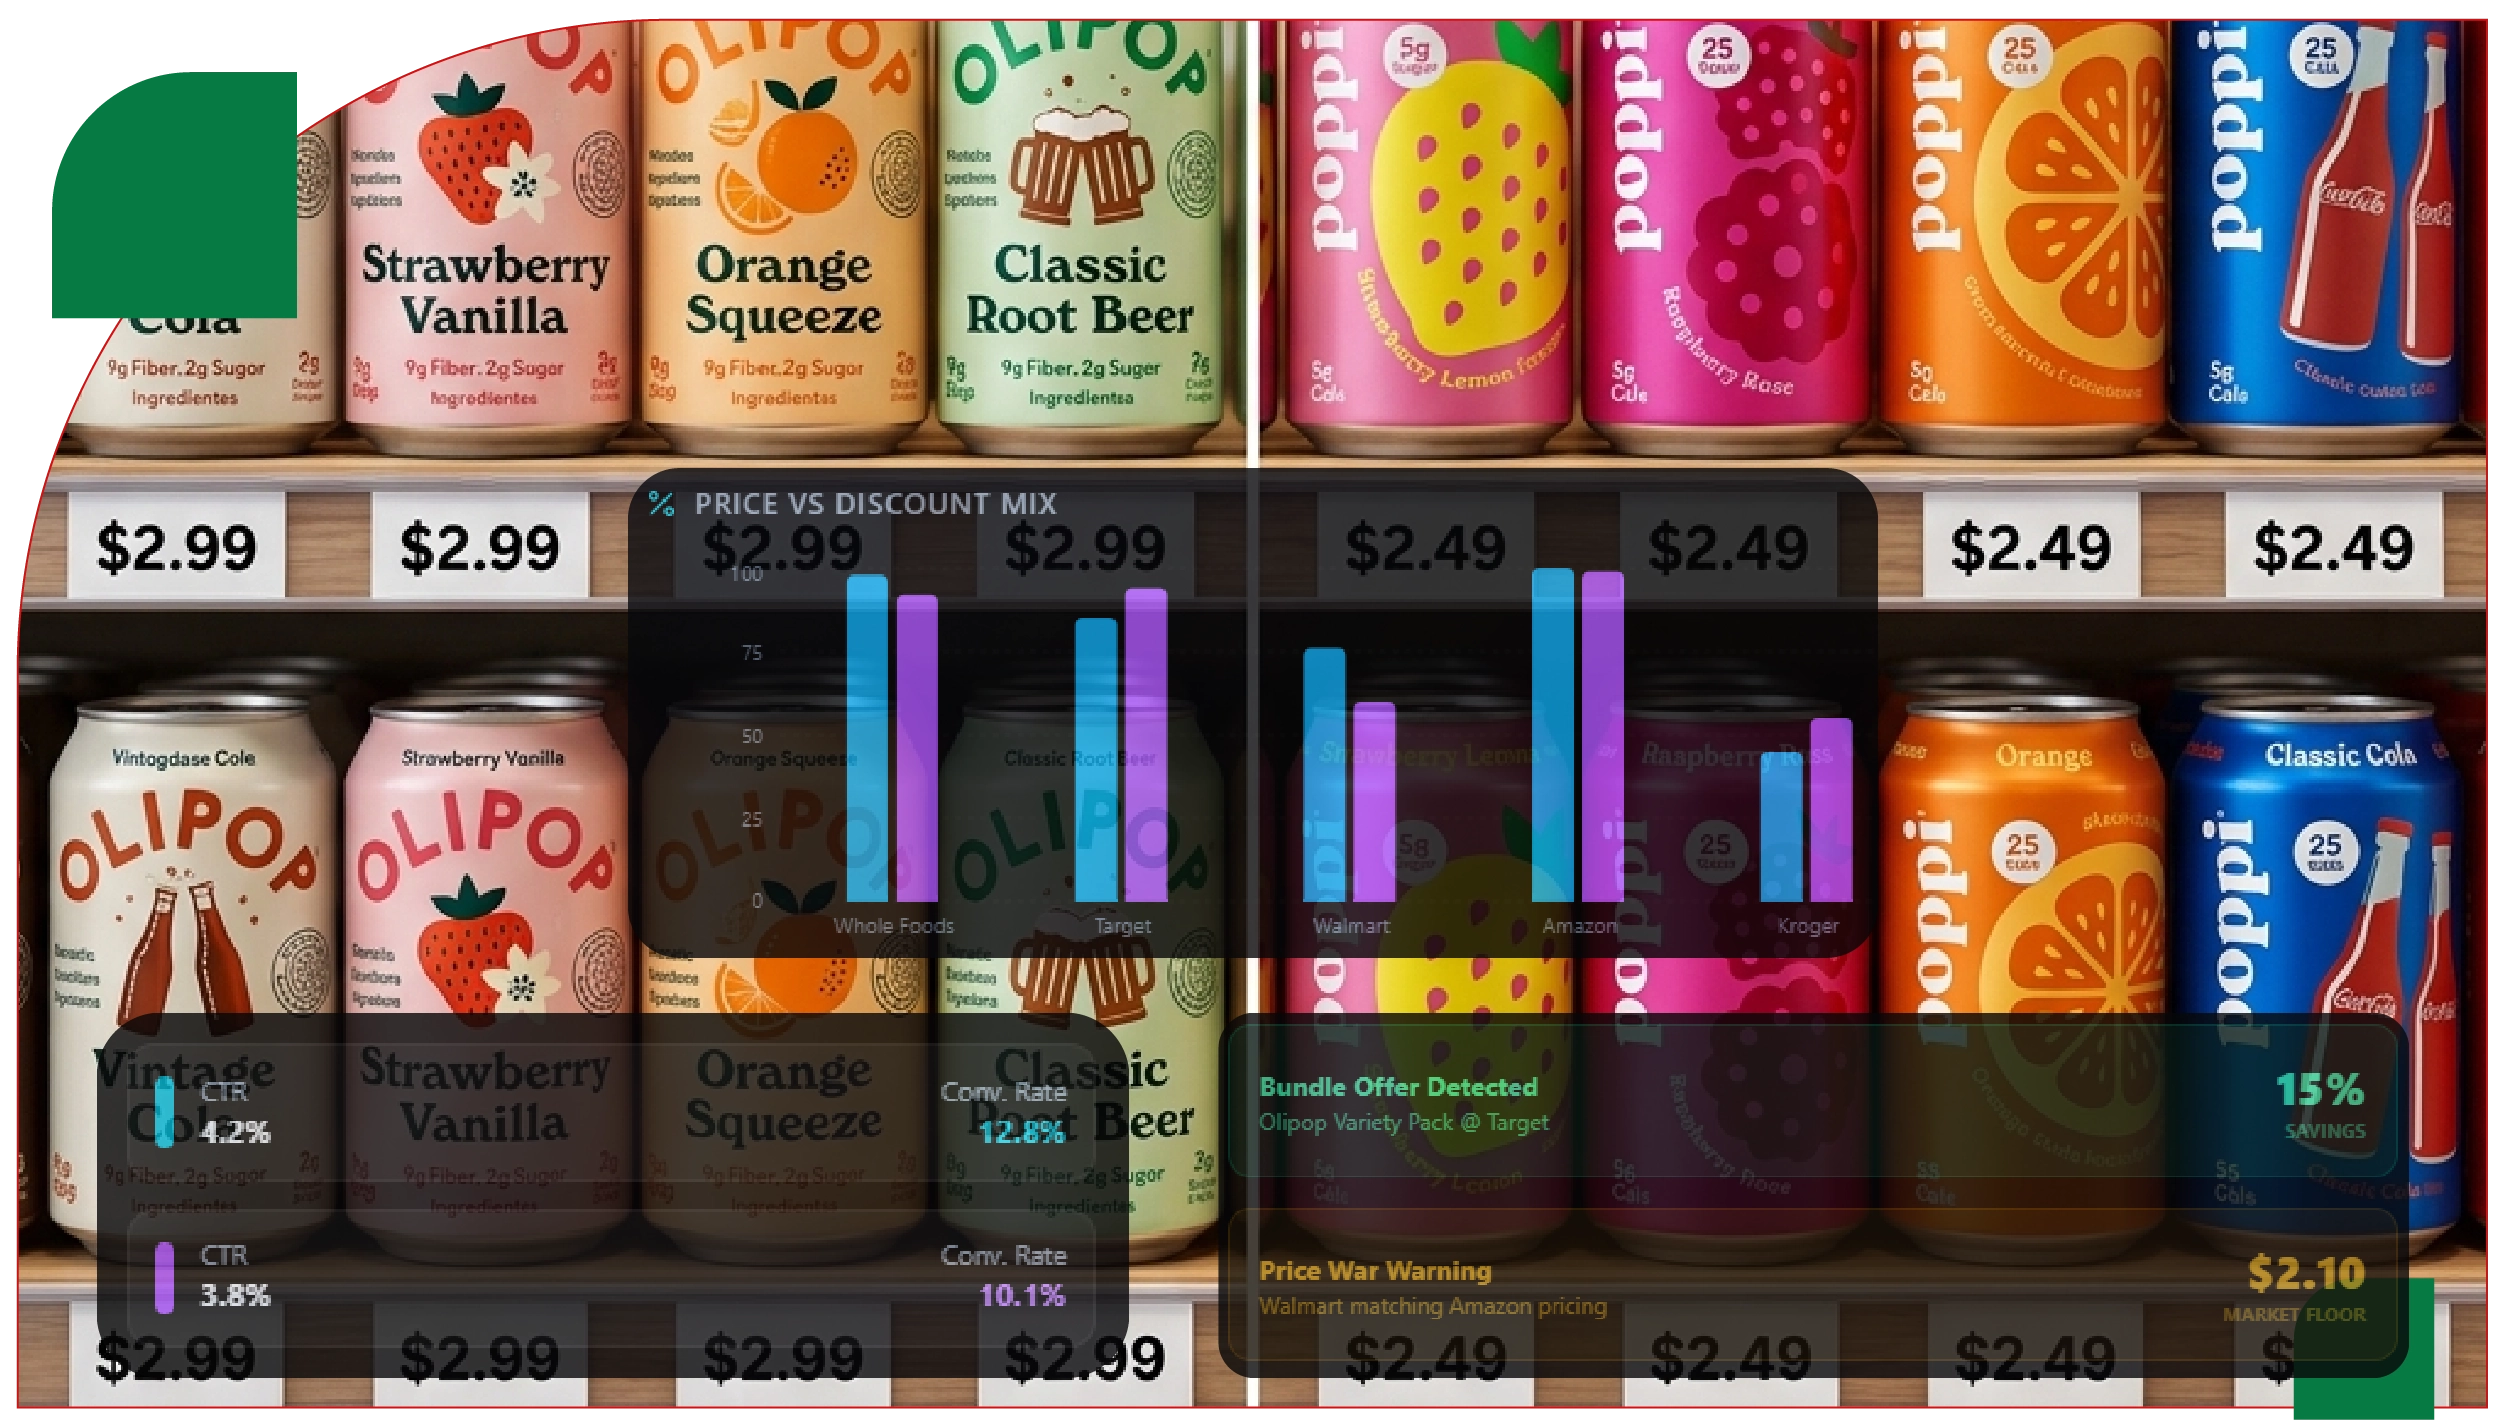
Pricing and promotion tracking plays a crucial role in digital shelf competition. Functional sodas typically sell at premium price points due to their health-focused formulations and ingredient sourcing.
Through Online Pricing And Promotion Tracking For Soda Brands, analysts observe several patterns:
- Promotional discounts increase significantly during seasonal sales events.
- Multipack bundles dominate online sales.
- Sponsored placements influence product ranking on search pages.
- Limited-edition flavors generate temporary spikes in digital shelf visibility.
Recent product launches such as Olipop’s Shirley Temple flavor highlight how brands use new releases to drive digital engagement and retailer promotions.
Retailers often prioritize brands that demonstrate high sales velocity and strong customer engagement, further increasing digital shelf visibility.
Table 2: SKU Performance and Category Visibility Metrics
| Metric |
Olipop |
Poppi |
Market Benchmark |
| Total Online SKUs |
30 |
27 |
24 |
| Avg Monthly Search Impressions |
1.8M |
1.6M |
1.2M |
| Avg Conversion Rate |
7.9% |
7.2% |
6.5% |
| Avg Rating Score |
4.6 |
4.4 |
4.2 |
| Avg Price per Can |
$2.49 |
$2.39 |
$2.10 |
| Average Discount Rate |
14% |
11% |
9% |
| Sponsored Listing Share |
28% |
31% |
22% |
| Social Engagement Index |
120 |
100 |
85 |
| Top Flavor Sales Share |
60% |
45% |
50% |
| Repeat Purchase Rate |
38% |
34% |
30% |
| Amazon Sales Volume |
2.8M |
3.3M |
2.1M |
| Walmart Online Conversion |
8.2% |
7.5% |
6.7% |
| Target Bundle Sales |
22% |
18% |
15% |
| Category Visibility Score |
78 |
71 |
65 |
| Digital Shelf Dominance Index |
74 |
69 |
60 |
These metrics demonstrate that Olipop maintains stronger visibility and engagement metrics, while Poppi achieves higher sales volume in certain channels due to pricing competitiveness and advertising.
Digital Retail Analytics and Data Collection Methods
Modern beverage analytics relies heavily on automated data collection technologies. Through Web Scraping Grocery Data, analysts gather thousands of SKU-level insights daily across e-commerce platforms.
Key technologies supporting digital shelf analysis include:
- Retail API integrations
- Automated scraping pipelines
- SKU-level inventory monitoring
- Promotion detection algorithms
- Price change alerts
Using tools like a Grocery Delivery Extraction API, brands can continuously monitor product listings across digital grocery marketplaces. This data feeds into a centralized Grocery Price Dashboard, enabling teams to track price fluctuations, promotional campaigns, and competitor strategies in real time.
Such analytics allow beverage brands to quickly respond to pricing changes, optimize search rankings, and adjust promotional strategies to maintain digital shelf dominance.
Market Outlook for Functional Soda Brands
The rise of health-focused beverages has transformed the competitive landscape of the soda industry. Consumers are increasingly shifting toward low-sugar beverages containing functional ingredients such as prebiotics, botanicals, and fiber.
Both Olipop and Poppi leverage unique product formulations to differentiate themselves. Olipop uses a proprietary blend of plant fibers and botanicals designed to support gut health, while Poppi incorporates apple cider vinegar and prebiotic fiber to achieve similar benefits.
These formulations help the brands position themselves as wellness beverages rather than traditional soft drinks.
Digital shelf analytics will continue to play a central role in determining which brands dominate the online grocery landscape. As e-commerce grocery adoption grows globally, brands that effectively monitor pricing, inventory, and promotional placements will gain significant competitive advantages.
Conclusion
Digital shelf share tracking provides a powerful framework for understanding competitive positioning in online grocery marketplaces. By analyzing SKU availability, pricing strategies, promotional placements, and customer engagement metrics, brands can identify opportunities to improve visibility and increase sales.
The analysis of Olipop and Poppi across Walmart, Target, and Amazon demonstrates that both brands maintain strong digital presence, but their strategies differ. Olipop leads in SKU assortment, category visibility, and promotional activity, while Poppi achieves strong sales momentum through aggressive advertising and competitive pricing.
To maintain digital competitiveness, beverage companies increasingly rely on advanced analytics tools such as a Grocery Price Tracking Dashboard, which consolidates retailer data and promotional insights into actionable intelligence. These platforms transform raw retail data into strategic Grocery Data Intelligence, enabling brands to monitor market trends, track competitor strategies, and optimize digital merchandising.
Ultimately, access to large-scale Grocery Datasets empowers beverage manufacturers, retailers, and analysts to make data-driven decisions that improve product visibility, enhance promotional effectiveness, and strengthen market leadership in the rapidly growing functional soda industry.
Are you in need of high-class scraping services? Food Data Scrape should be your first point of call. We are undoubtedly the best in Food Data Aggregator and Mobile Grocery App Scraping service and we render impeccable data insights and analytics for strategic decision-making. With a legacy of excellence as our backbone, we help companies become data-driven, fueling their development. Please take advantage of our tailored solutions that will add value to your business. Contact us today to unlock the value of your data.