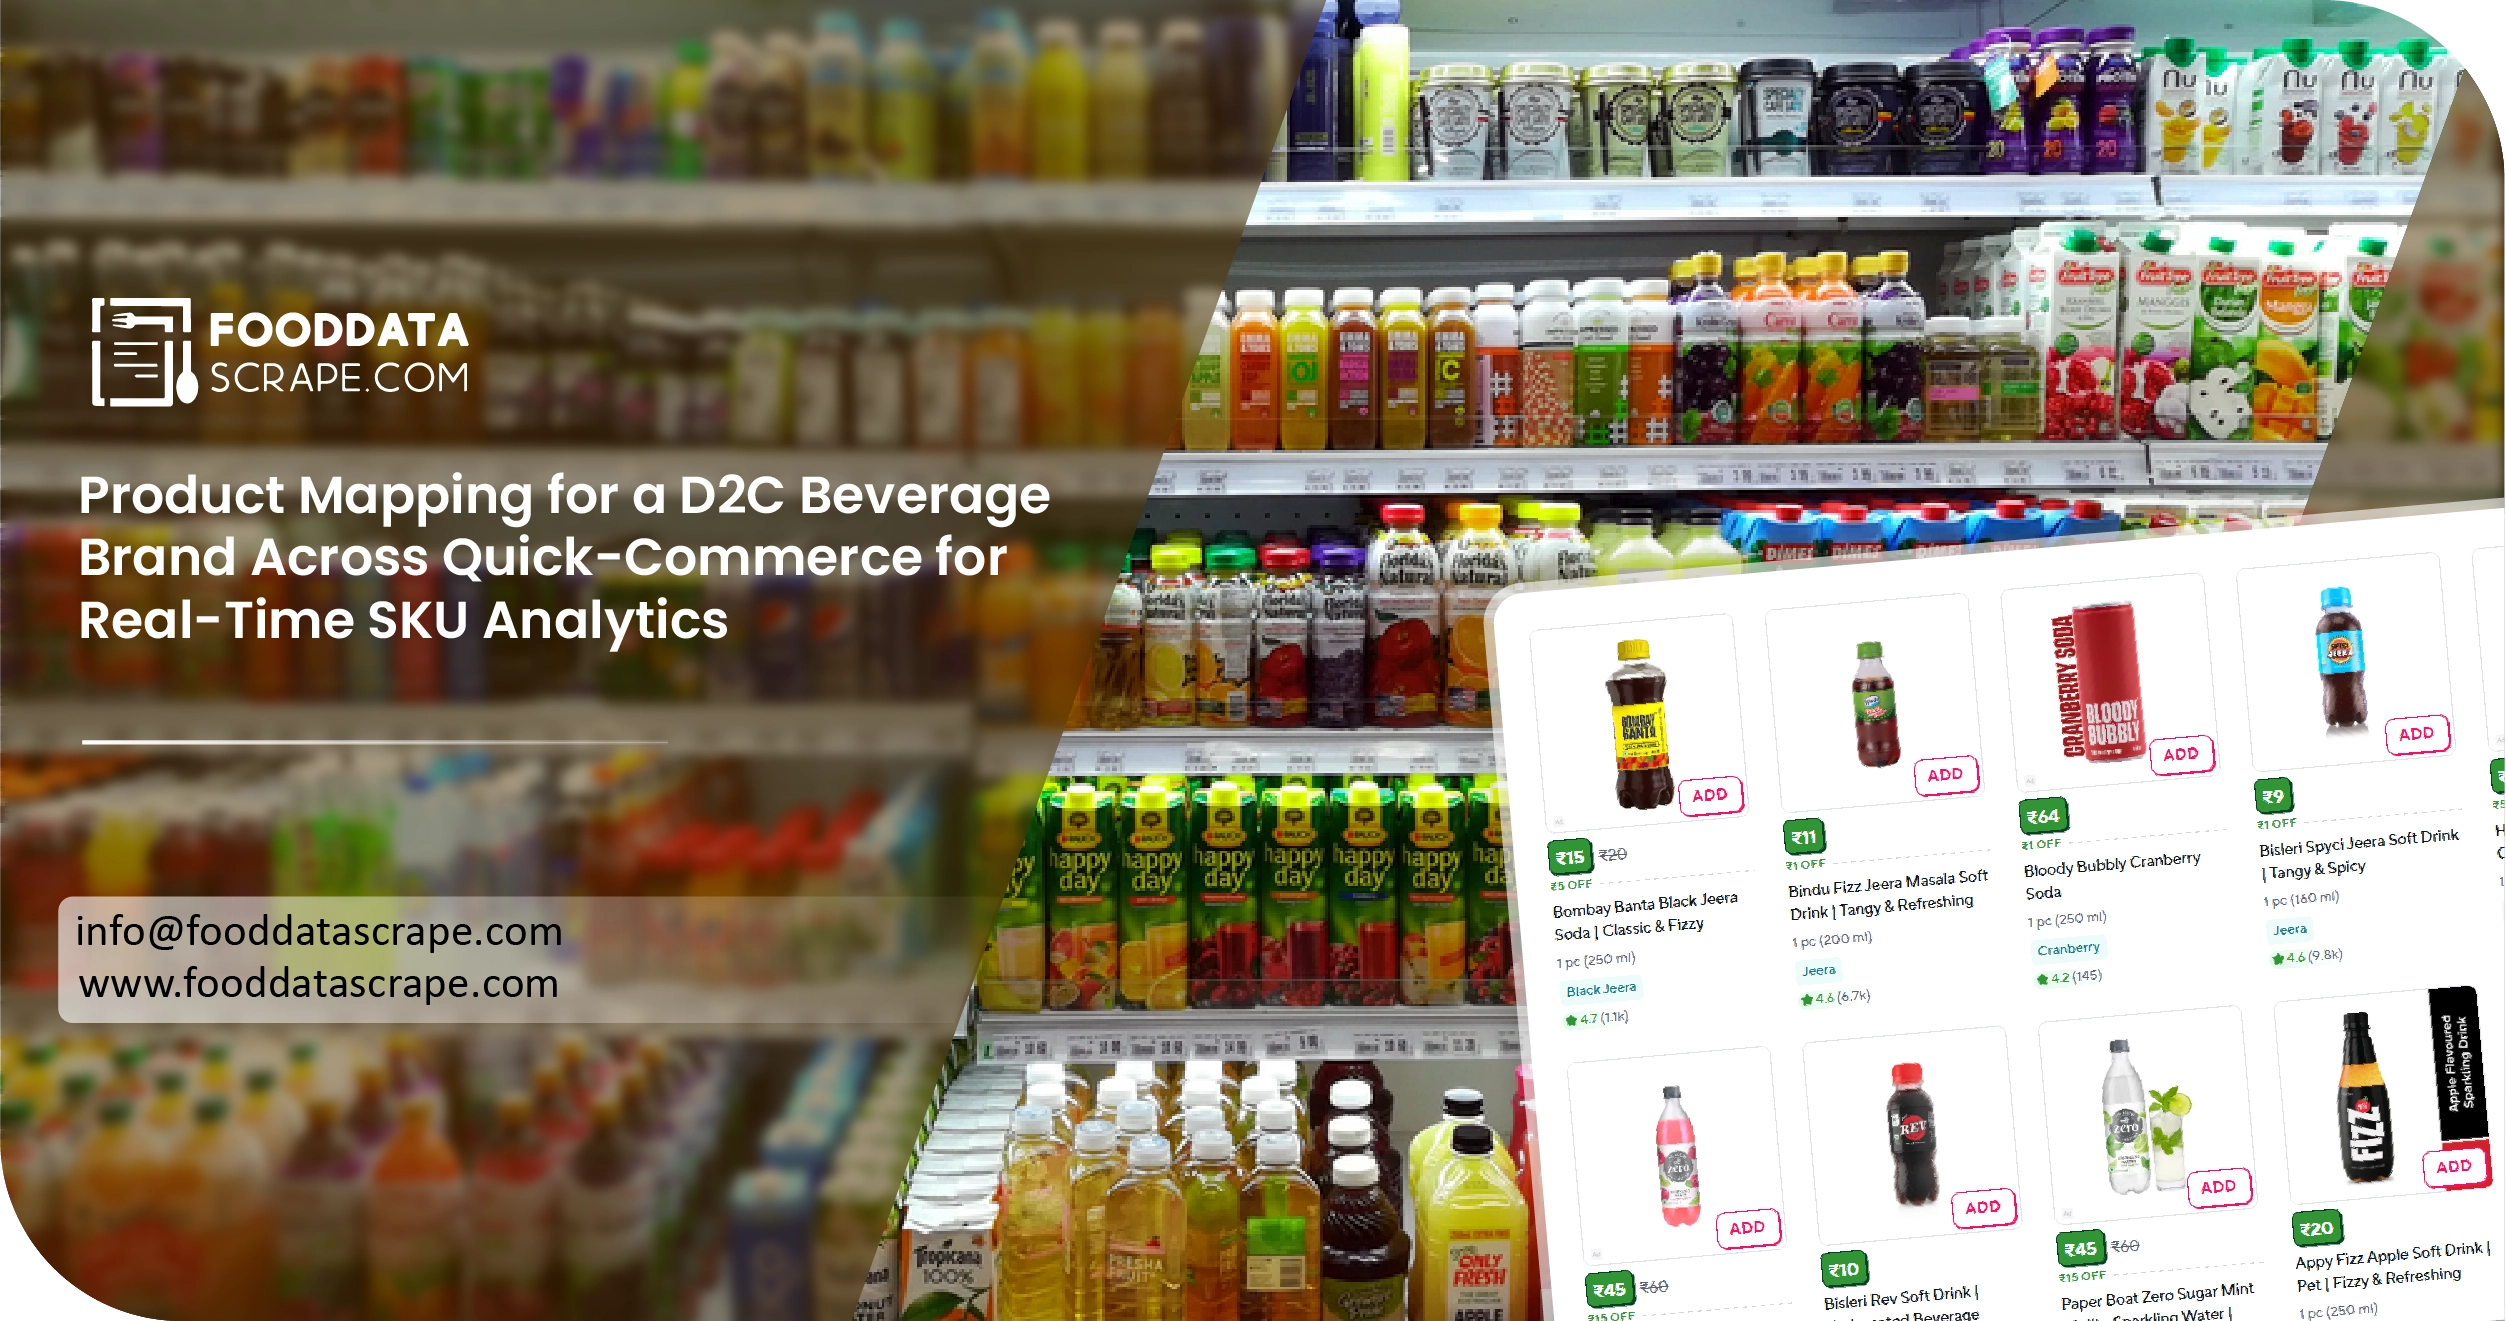
The Client
The client is a leading analytics-driven D2C beverage company focused on understanding market dynamics and consumer preferences in India’s quick-commerce ecosystem. Their goal is to monitor product performance, pricing trends, and availability across multiple digital platforms. By leveraging D2C Beverage Product Mapping Across Quick Commerce Platforms, the client gains real-time insights into SKU-level performance, promotions, and assortment gaps, enabling data-driven marketing and sales strategies. To ensure comprehensive coverage, they implement Multi-Platform Product Mapping for D2C Beverage Brands, tracking competitors, regional demand, and category-level trends. This approach allows the client to optimize inventory, improve product visibility, and enhance operational efficiency across platforms. By using advanced automation to Scrape Beverage Product Data from Quick-Commerce Platforms, the client obtains structured, high-quality datasets that support strategic decision-making, competitive benchmarking, and forecasting. Overall, the client is empowered to maximize reach, optimize sales, and maintain a competitive edge in India’s rapidly evolving quick-commerce beverage market.
Key Challenges
- Limited Visibility Across Platforms
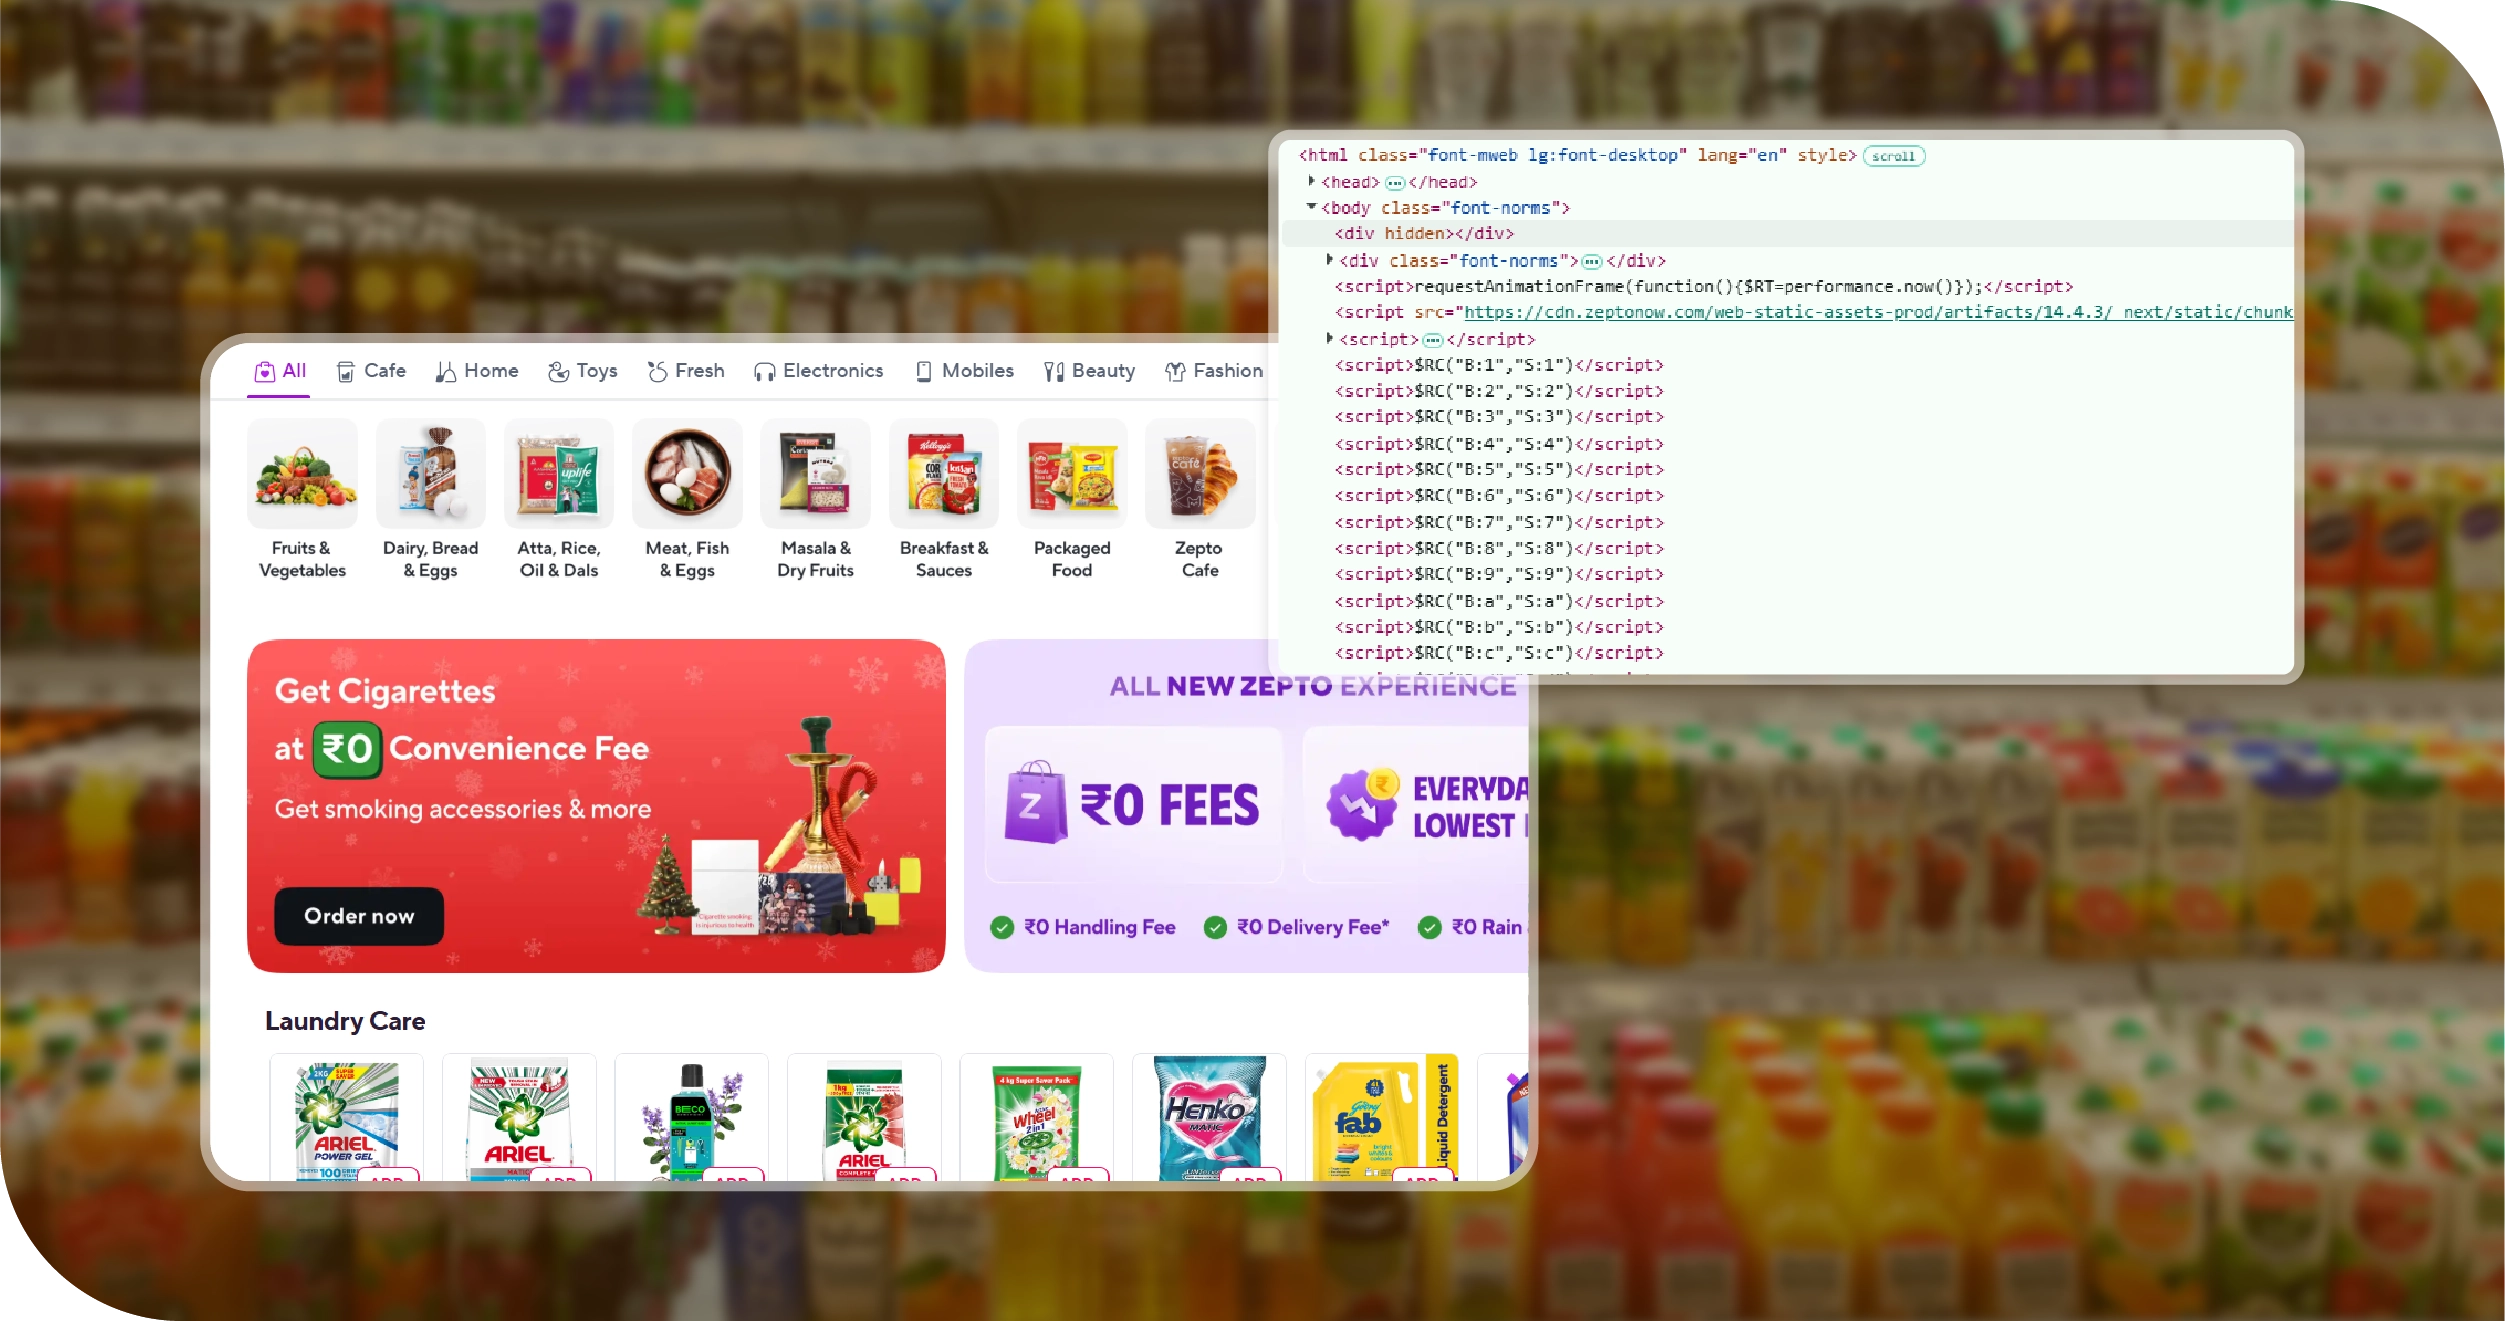
The client struggled to monitor all SKUs due to incomplete listings and varying product availability. Utilizing Quick Commerce Datasets provided partial coverage, but consolidating comprehensive, accurate information from multiple sources was a key challenge. - Complex Extraction Requirements
Frequent changes in app design, dynamic content, and anti-bot mechanisms disrupted data capture. Leveraging Web Scraping Quick Commerce Data demanded sophisticated techniques and continuous maintenance to ensure reliable collection from multiple quick-commerce apps. - Real-Time Data Processing Challenges
Handling large volumes of SKU-level pricing, promotions, and availability data in real-time was difficult. Using Quick Commerce Data Scraping API helped automate ingestion and normalization, but maintaining speed, accuracy, and consistency at scale required significant technical effort.
Key Solutions
- Unified SKU Monitoring
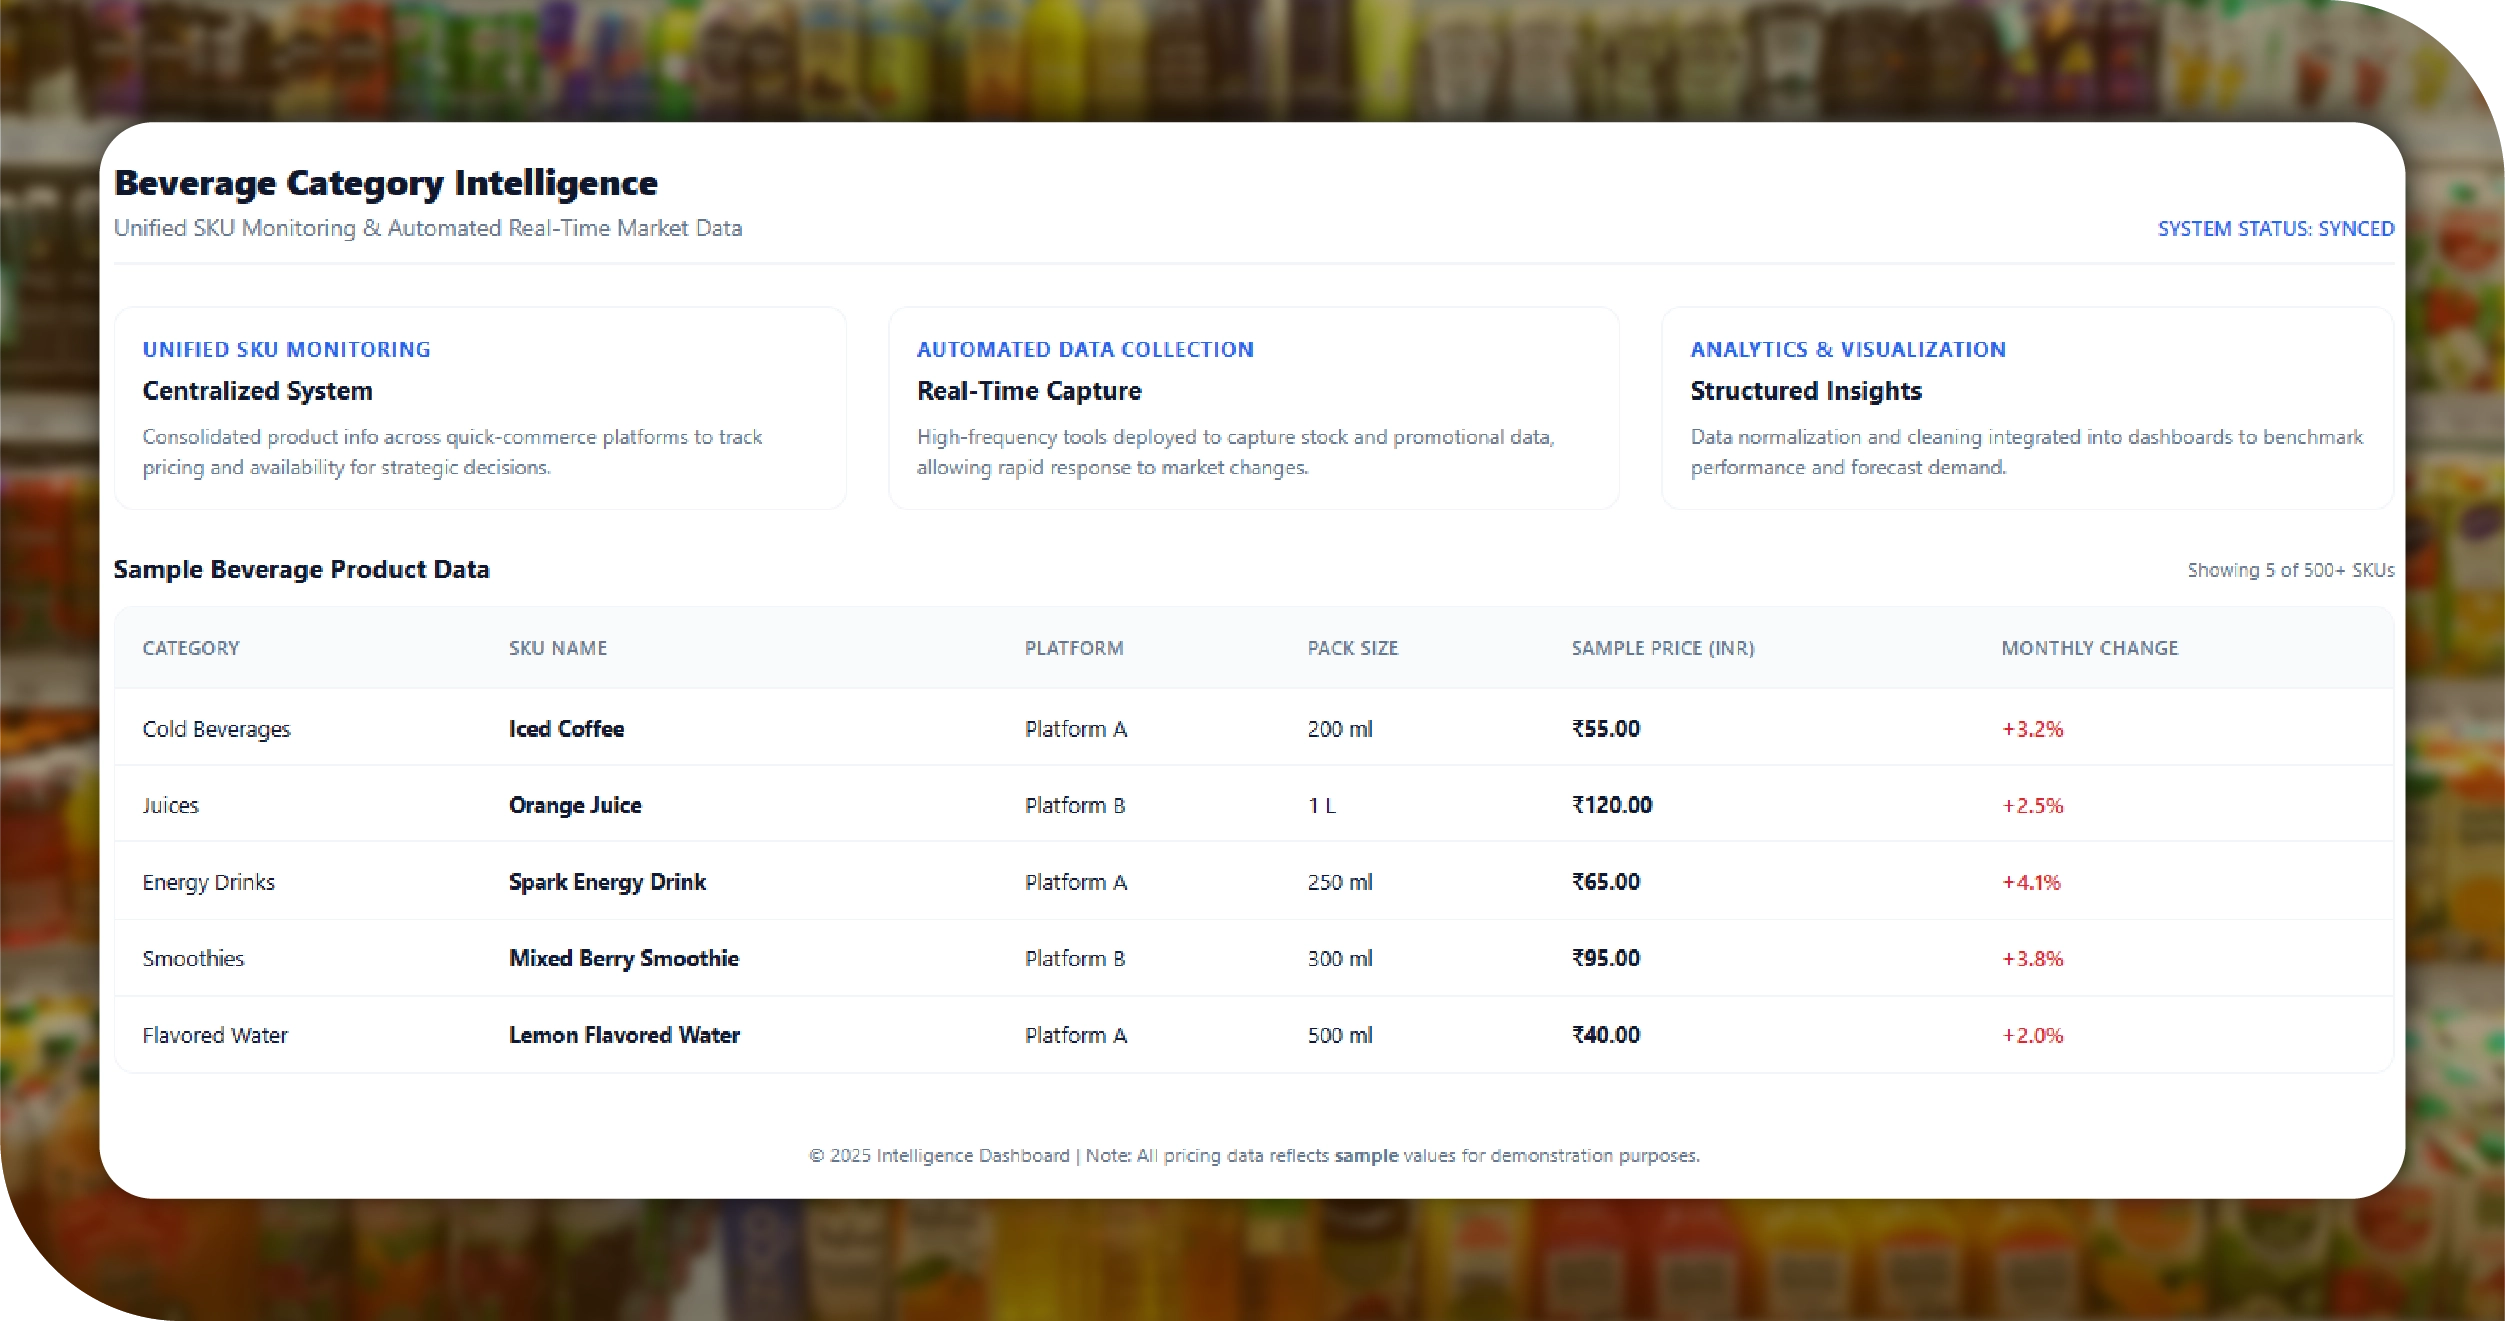
We implemented a centralized system that consolidated product information across multiple quick-commerce platforms. This allowed the client to track SKUs, pricing, availability, and promotions efficiently, providing a complete and accurate view of the beverage category for strategic decision-making. - Automated Real-Time Data Collection
Advanced automated tools were deployed to capture pricing, stock, and promotional data at high frequency. This approach ensured timely updates, minimized manual effort, and allowed analysts to respond quickly to market changes and competitor actions. - Structured Analytics and Visualization
Collected data was cleaned, normalized, and organized into structured formats for detailed analysis. Dashboards and reports enabled the client to identify trends, benchmark performance, and forecast demand effectively, improving operational efficiency and strategic planning.
Sample Beverage Product Data
| Product Category | SKU Name | Platform | Pack Size | Price (INR) | Monthly Change (%) |
|---|---|---|---|---|---|
| Cold Beverages | Iced Coffee | Platform A | 200 ml | 55 | +3.2% |
| Juices | Orange Juice | Platform B | 1 L | 120 | +2.5% |
| Energy Drinks | Spark Energy Drink | Platform A | 250 ml | 65 | +4.1% |
| Smoothies | Mixed Berry Smoothie | Platform B | 300 ml | 95 | +3.8% |
| Flavored Water | Lemon Flavored Water | Platform A | 500 ml | 40 | +2.0% |
Methodologies Used
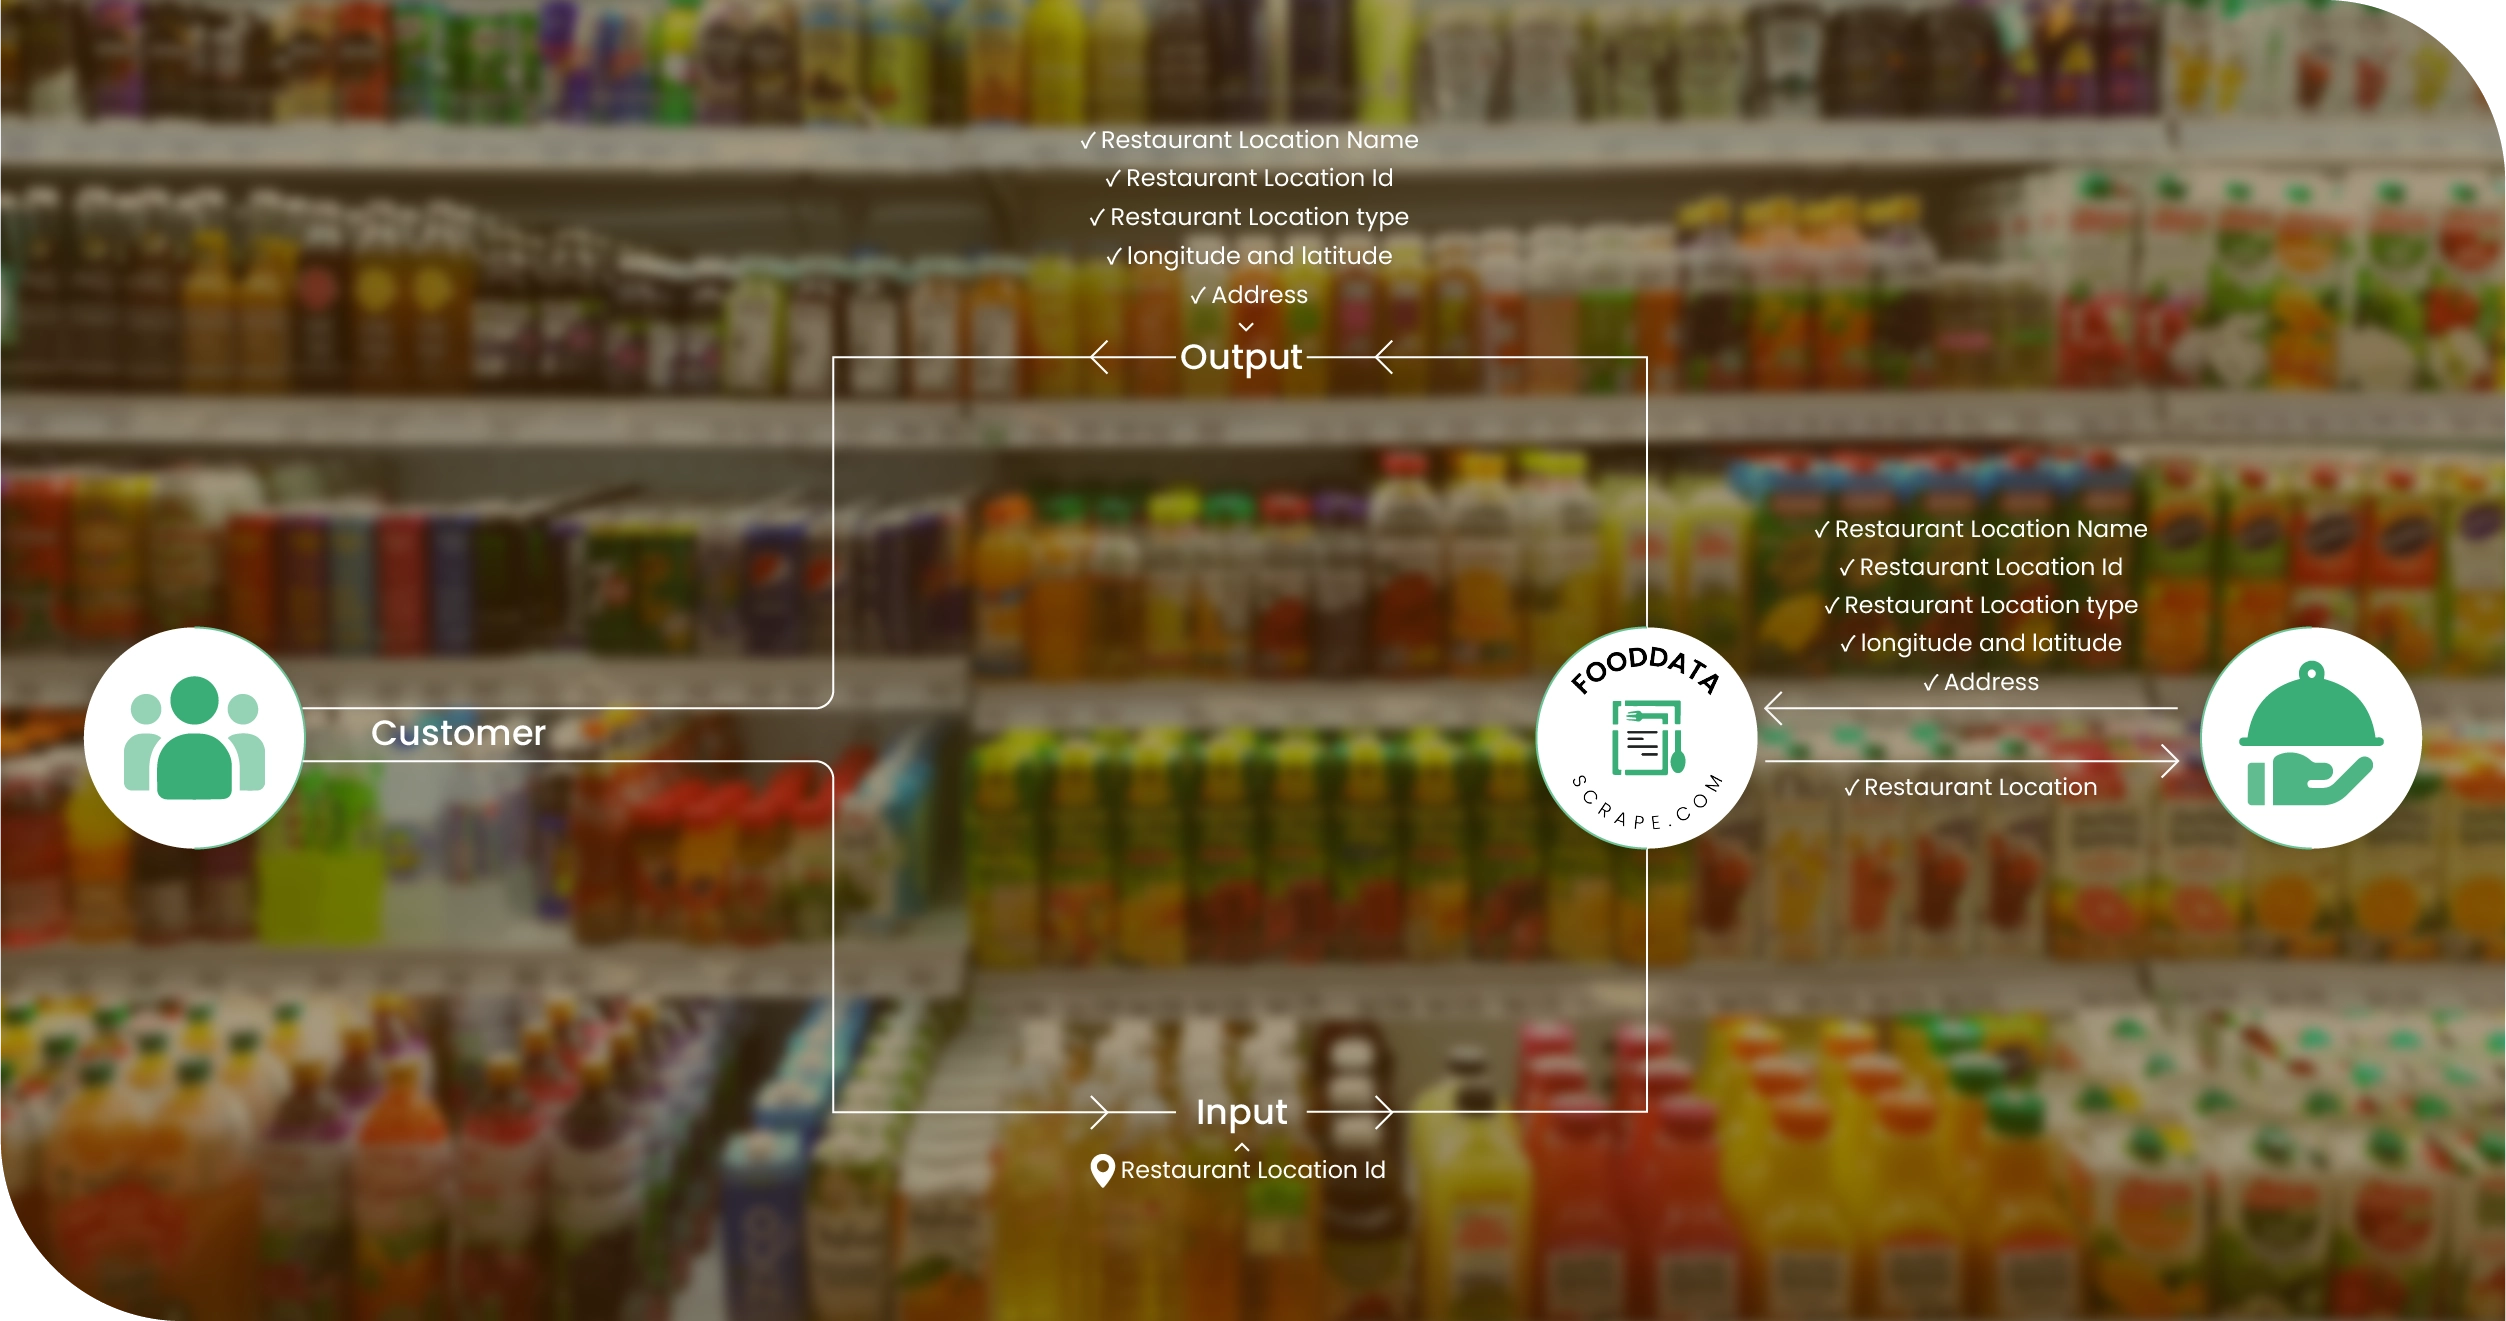
- Comprehensive Platform Mapping
We identified all relevant quick-commerce platforms and mapped key SKUs to ensure full coverage. This approach allowed us to capture product availability, pricing, and promotional information across multiple sources, providing a holistic view of the beverage category. - Automated Data Collection
High-frequency automated scripts were employed to extract data from web and app interfaces. This methodology ensured timely updates, captured real-time pricing and stock changes, and minimized manual effort, enabling continuous monitoring of product performance across platforms. - Dynamic Content Handling
Advanced techniques were applied to extract data from dynamically loaded pages, JavaScript-rendered content, and mobile app structures. This ensured consistent data capture despite frequent interface changes or updates on quick-commerce platforms. - Data Cleaning and Standardization
Collected data was rigorously validated, de-duplicated, and normalized. Pack sizes, units, and pricing formats were standardized, and anomalies flagged, enabling accurate cross-platform comparisons and reliable analytics. - Historical Structuring and Trend Analysis
Data was stored in structured time-series formats to support longitudinal analysis. This allowed month-over-month comparisons, trend identification, and forecasting, providing actionable insights into product performance, pricing shifts, and market dynamics over time.
Advantages of Collecting Data Using Food Data Scrape
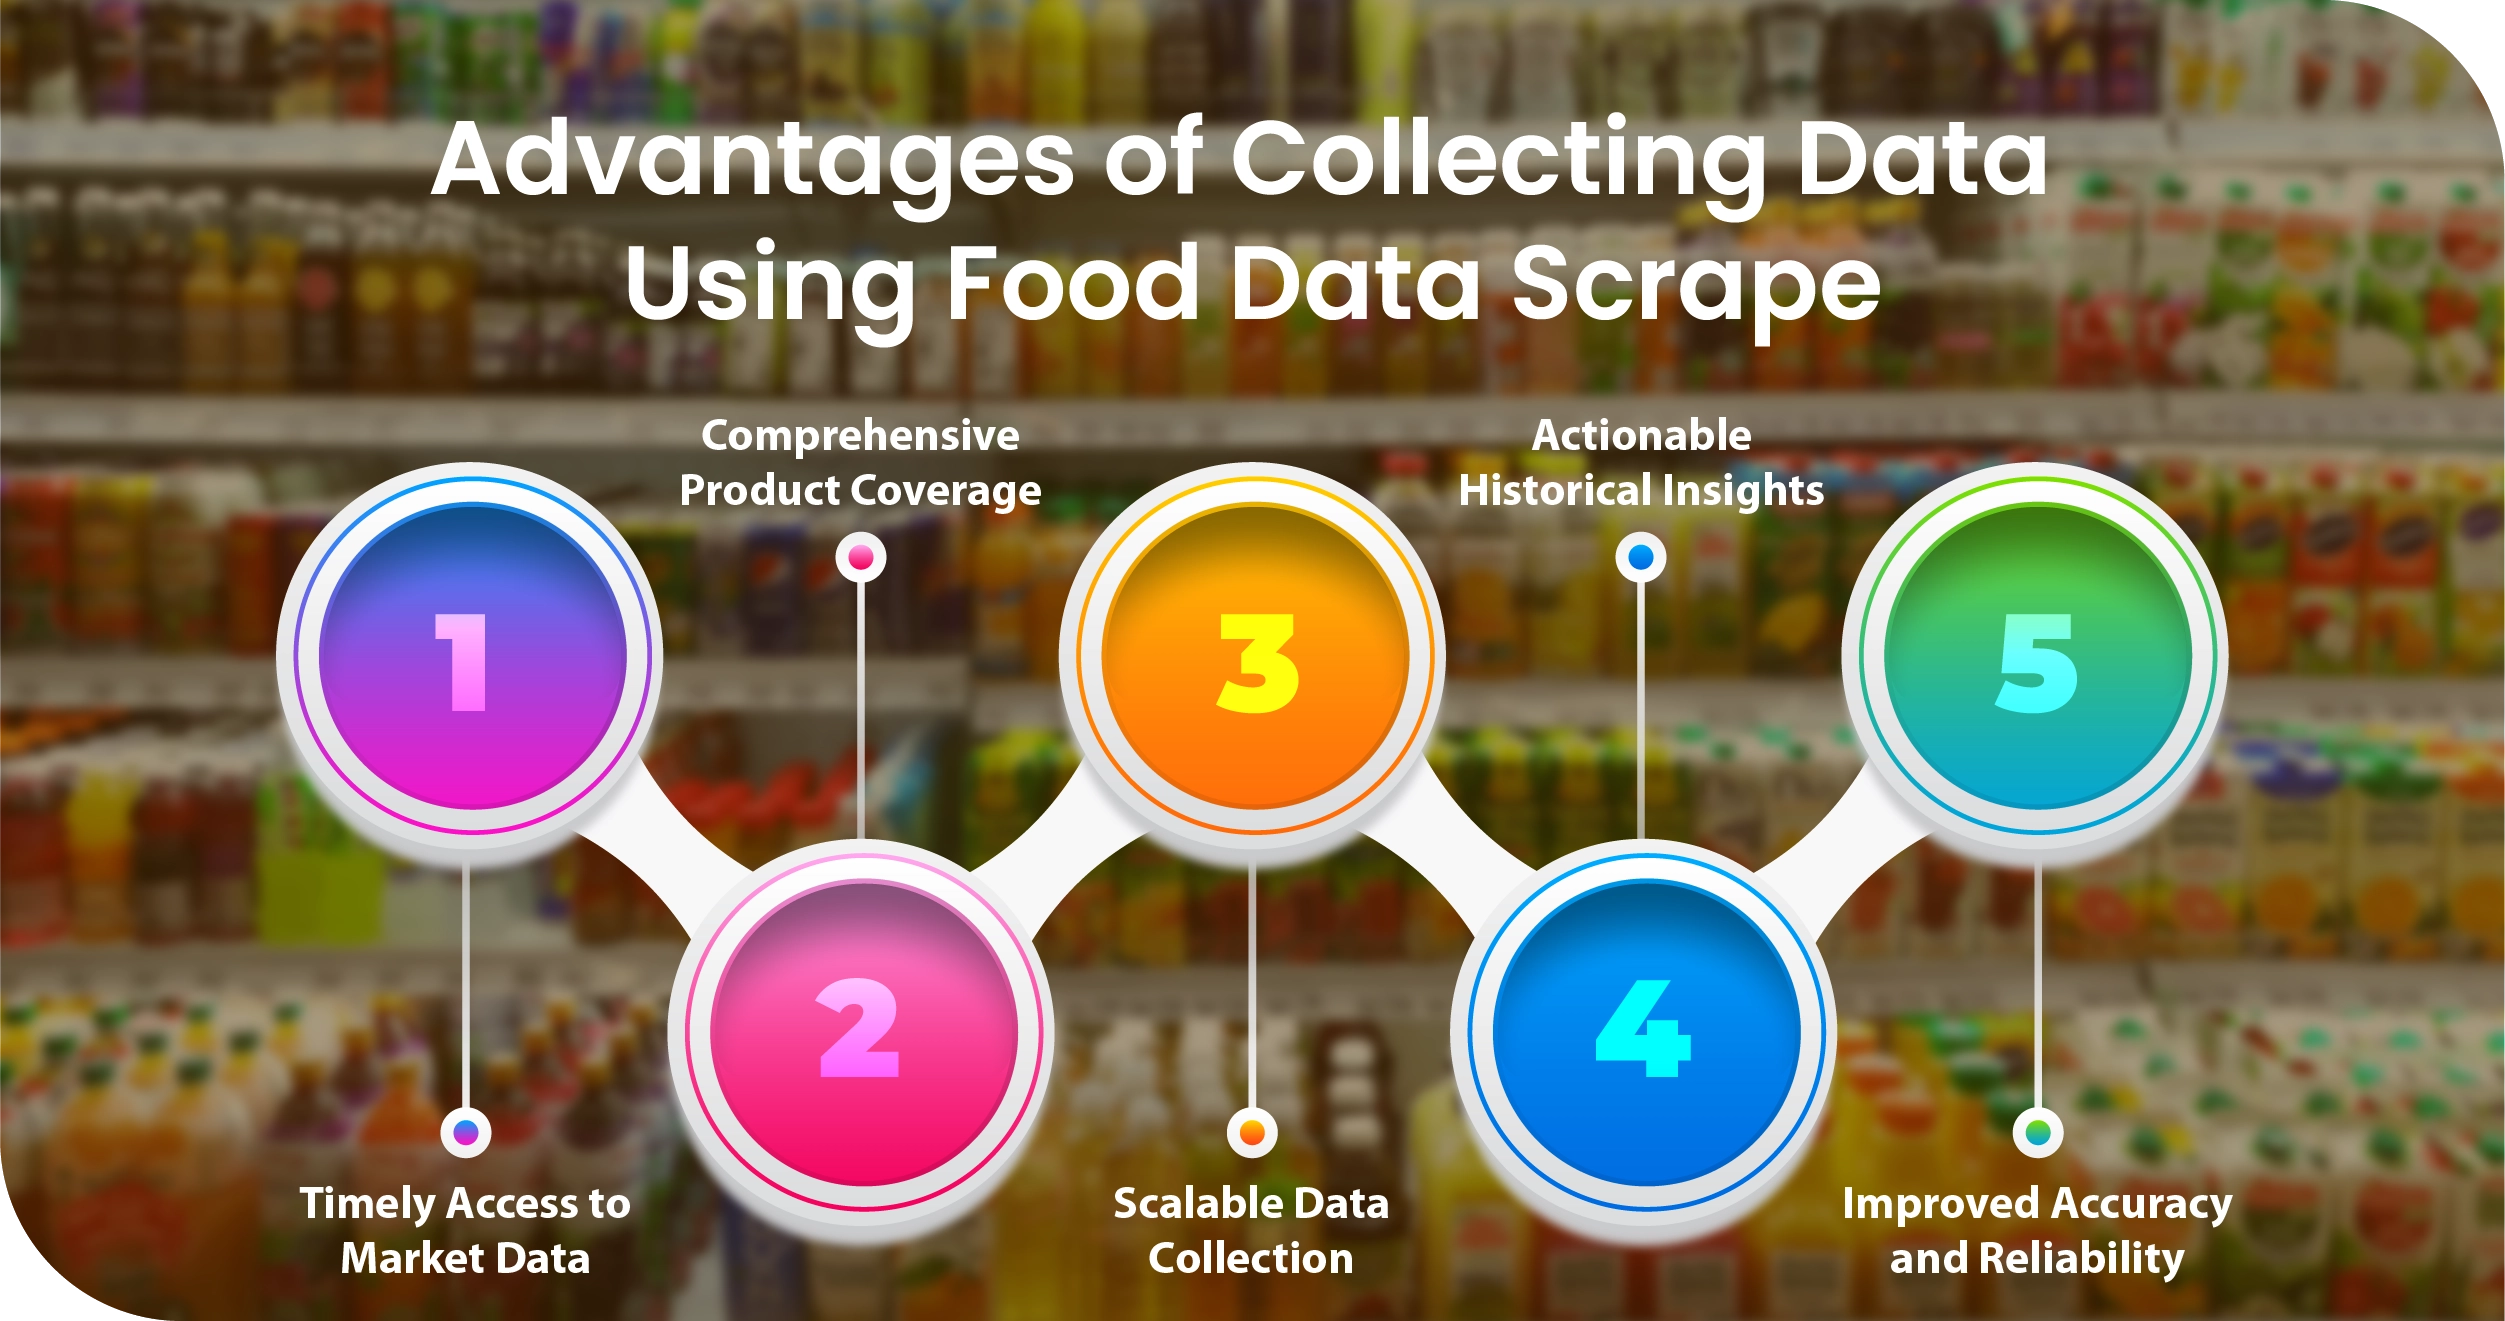
- Timely Access to Market Data
Our services provide real-time insights into product availability, pricing, and promotions, allowing clients to respond quickly to market shifts and make proactive decisions instead of relying on delayed reports or manual data collection. - Comprehensive Product Coverage
We capture detailed SKU-level information across multiple platforms, ensuring complete visibility of product assortments, competitor activity, and regional variations. This comprehensive coverage enables clients to make well-informed strategic and operational decisions. - Scalable Data Collection
Automated systems handle high volumes of data across platforms and locations efficiently. As client requirements grow, data collection can scale without additional manual effort, saving time and reducing operational costs. - Actionable Historical Insights
Collected data is structured for longitudinal analysis, trend identification, and performance benchmarking. This supports forecasting, category planning, and strategic decision-making based on reliable historical and real-time insights. - Improved Accuracy and Reliability
Automated extraction, validation, and normalization minimize human error and inconsistencies. Clients gain confidence in using the data for competitive benchmarking, inventory planning, and market intelligence initiatives.
Client’s Testimonial
"Partnering with the team has revolutionized how we monitor our D2C beverage products across quick-commerce platforms. Their data scraping services provided accurate, real-time SKU-level insights into pricing, availability, and promotions, enabling us to make faster, data-driven decisions. The structured datasets and dashboards allowed our analysts to identify trends, optimize inventory, and benchmark against competitors effectively. Their technical expertise, responsiveness, and commitment to data quality exceeded our expectations. Thanks to their solutions, we can strategically plan marketing campaigns, improve product visibility, and enhance operational efficiency, ensuring stronger market performance and a competitive edge in the rapidly evolving quick-commerce landscape."
Head of Market Analytics
Final Outcome
The final outcome empowered the client with a comprehensive, real-time understanding of their D2C beverage products across quick-commerce platforms. By leveraging Quick Commerce Data Intelligence Services, the client gained accurate SKU-level insights into pricing, availability, and promotions, enabling informed decision-making. Structured datasets and dashboards facilitated trend analysis, competitor benchmarking, and inventory optimization. Analysts could quickly identify gaps in product assortment, monitor regional demand variations, and respond proactively to market shifts. The project enhanced operational efficiency, improved product visibility, and strengthened strategic planning. Overall, the client achieved a data-driven approach that maximized market performance and provided a sustainable competitive advantage in India’s fast-growing quick-commerce ecosystem.

