The Client
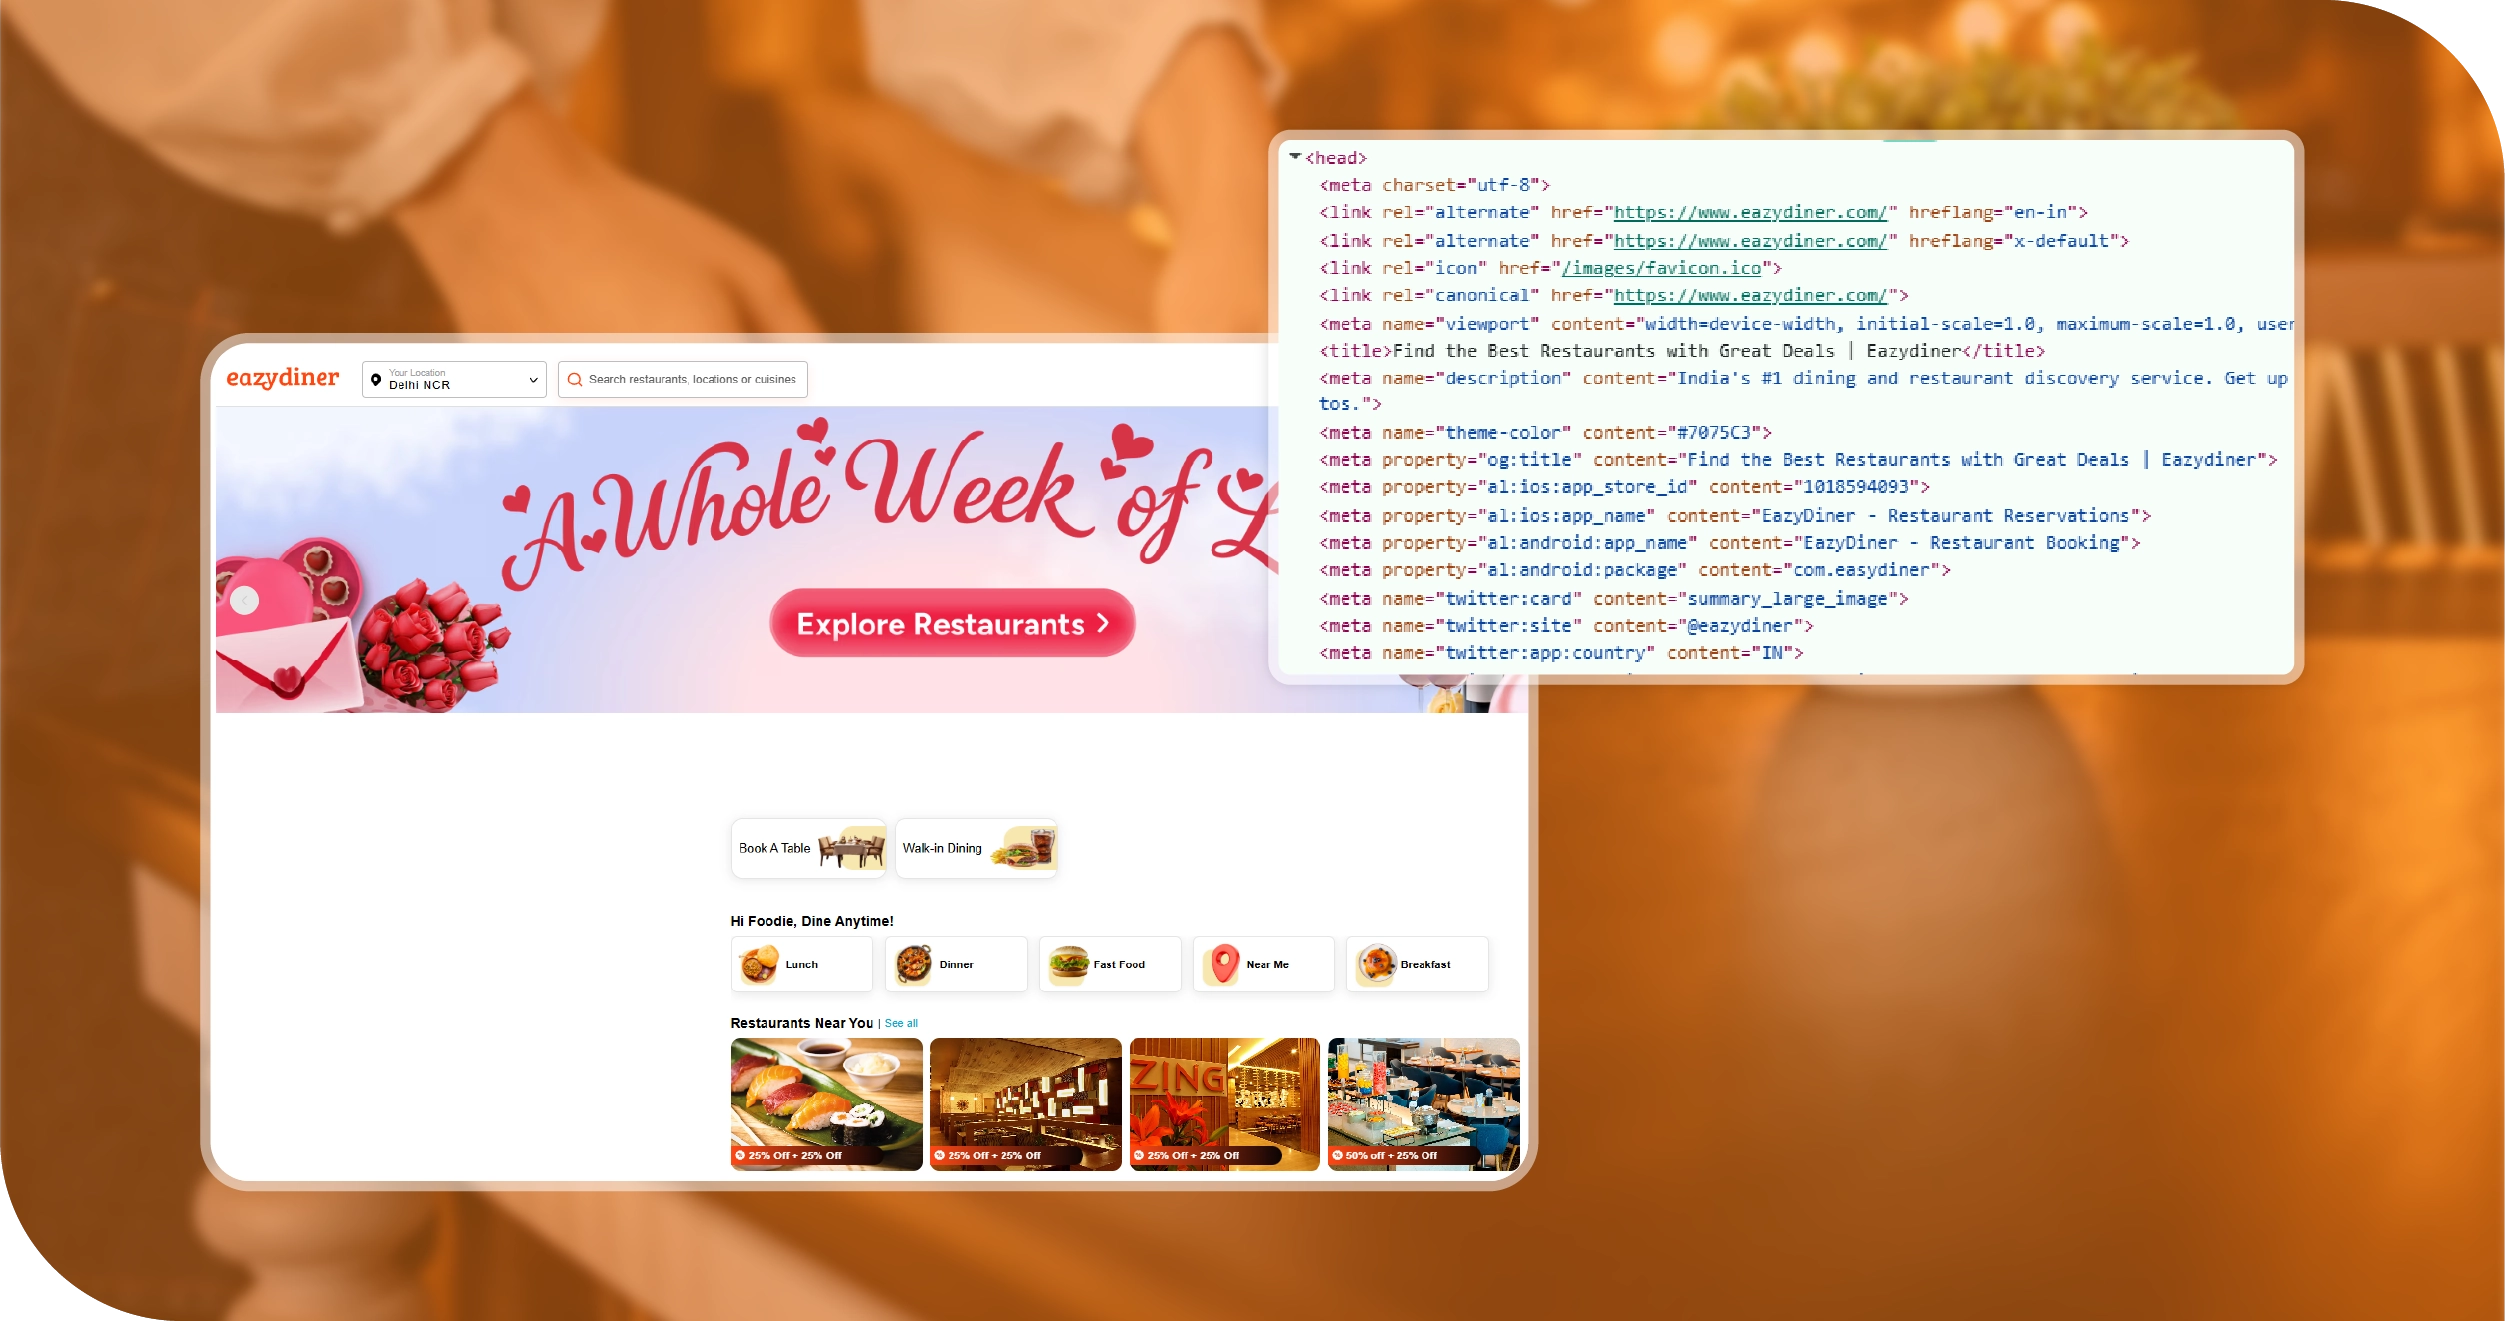
The client was a well-established fine-dining restaurant group operating across Mumbai, Delhi, and Bengaluru. Known for curated dining experiences, they relied heavily on reservations and weekend footfall. However, fragmented booking information and inconsistent delivery order reports made performance tracking difficult. They approached us after struggling with manual reconciliation of data from multiple platforms, including Web Scraping Bookings & Orders Data from EazyDiner to better understand guest behavior and cancellation trends. Their primary need was unified visibility. By implementing Real-Time Restaurant Orders And Reservations API Data Scraping, we helped them monitor table occupancy, peak reservation hours, and parallel delivery demand in a single system. Using structured tools to Scrape Reservations And Orders Data From Food Platforms, the brand gained actionable insights into booking patterns, no-show percentages, and order frequency, enabling smarter staffing decisions and improved revenue planning across all outlets.
Key Challenges
- Fragmented Reservation and Order Data: The client struggled with disconnected reporting systems across platforms. Reservation data, dine-in occupancy, and delivery orders were stored separately, making reconciliation time-consuming. Lack of centralized insights from Zomato Food Delivery Scraping API limited their ability to analyze overall performance accurately.
- Inconsistent Demand Forecasting: Without structured analytics, predicting peak hours and staffing requirements was challenging. Delivery spikes often clashed with dine-in rush hours. Limited visibility into trends from Swiggy Food Delivery Scraping API prevented proactive planning and resulted in service delays during high-demand periods.
- High Cancellation and No-Show Rates: Frequent last-minute cancellations affected revenue and table utilization. The absence of detailed booking behavior analytics from EazyDiner Food Delivery Scraping API made it difficult to identify patterns, optimize confirmation strategies, and implement data-backed measures to reduce losses.
Key Solutions
- Unified Data Integration Framework: We built a centralized system using Web Scraping Food Delivery Data to combine reservations, dine-in occupancy, and delivery orders into a single dashboard. This eliminated data silos, improved reporting accuracy, and provided management with a complete operational overview.
- Menu & Demand Alignment Strategy: Our team helped Extract Restaurant Menu Data across platforms to analyze item-level performance, pricing variations, and seasonal demand patterns. This enabled smarter menu engineering, better stock planning, and alignment between kitchen capacity and platform demand trends.
- Automated Real-Time Monitoring System: By deploying a structured Food Delivery Scraping API, we enabled live tracking of bookings, cancellations, peak hours, and order volumes. This allowed proactive staffing decisions, dynamic promotional campaigns, and improved table utilization across all restaurant locations.
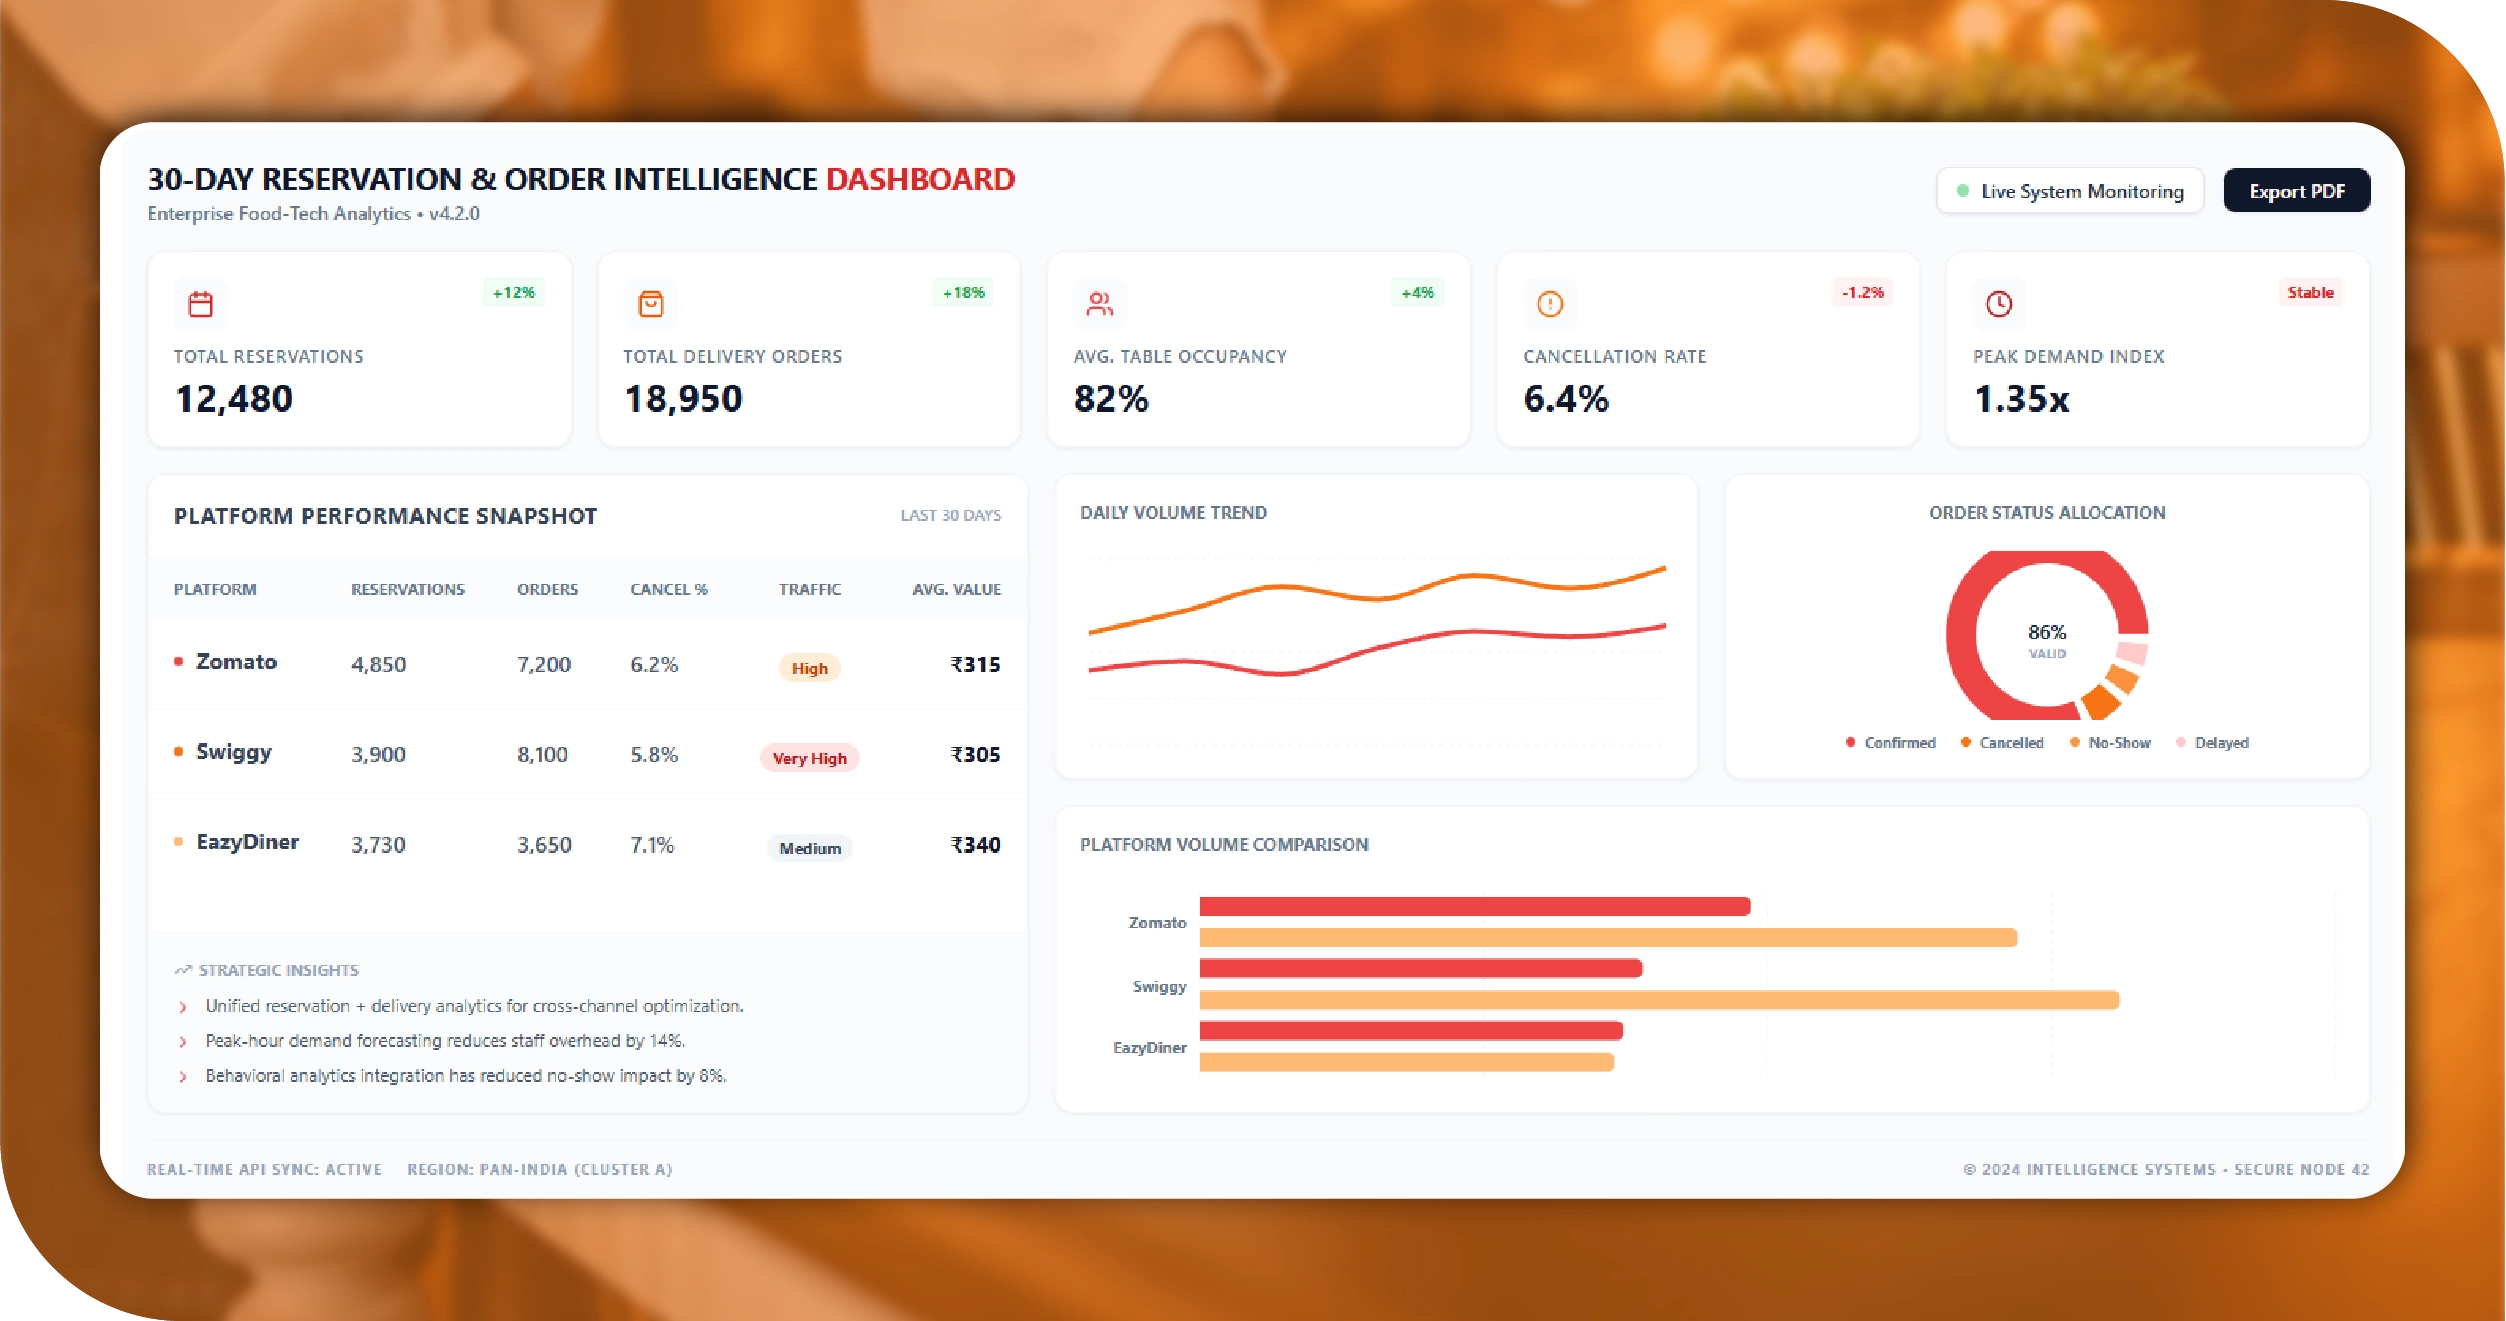
Below is a consolidated 30‑Day Performance & Reservation Intelligence Snapshot prepared for the client after implementation:
| Outlet Name | City | Total Reservations | Confirmed Bookings | Cancellation Rate (%) | Avg Guests per Booking | Peak Reservation Time | Total Delivery Orders | Avg Order Value (₹) | Delivery Revenue (₹) | Dine-In Revenue (₹) | Top-Selling Dish | Repeat Customer Rate (%) | No-Show Rate (%) | Weekend Occupancy (%) |
|---|---|---|---|---|---|---|---|---|---|---|---|---|---|---|
| Royal Bistro | Mumbai | 1,280 | 1,110 | 13.3 | 3.4 | 8:30 PM | 3,450 | 820 | 28,29,000 | 34,75,000 | Truffle Pasta | 38 | 6.2 | 92 |
| Urban Grill | Delhi | 1,540 | 1,320 | 14.2 | 3.8 | 9:00 PM | 4,120 | 760 | 31,31,200 | 39,60,000 | Butter Chicken | 41 | 5.8 | 95 |
| Coastal Spice | Bengaluru | 1,110 | 980 | 11.7 | 3.2 | 8:00 PM | 3,780 | 690 | 26,08,200 | 29,40,000 | Prawn Curry | 36 | 4.9 | 88 |
| The Velvet Table | Mumbai | 1,360 | 1,190 | 12.5 | 3.6 | 9:15 PM | 3,960 | 840 | 33,26,400 | 37,85,000 | Lamb Chops | 44 | 5.1 | 93 |
| Spice Heritage | Delhi | 1,220 | 1,050 | 13.9 | 3.5 | 8:45 PM | 3,510 | 710 | 24,92,100 | 31,10,000 | Dal Makhani | 39 | 6.0 | 90 |
Methodologies Used
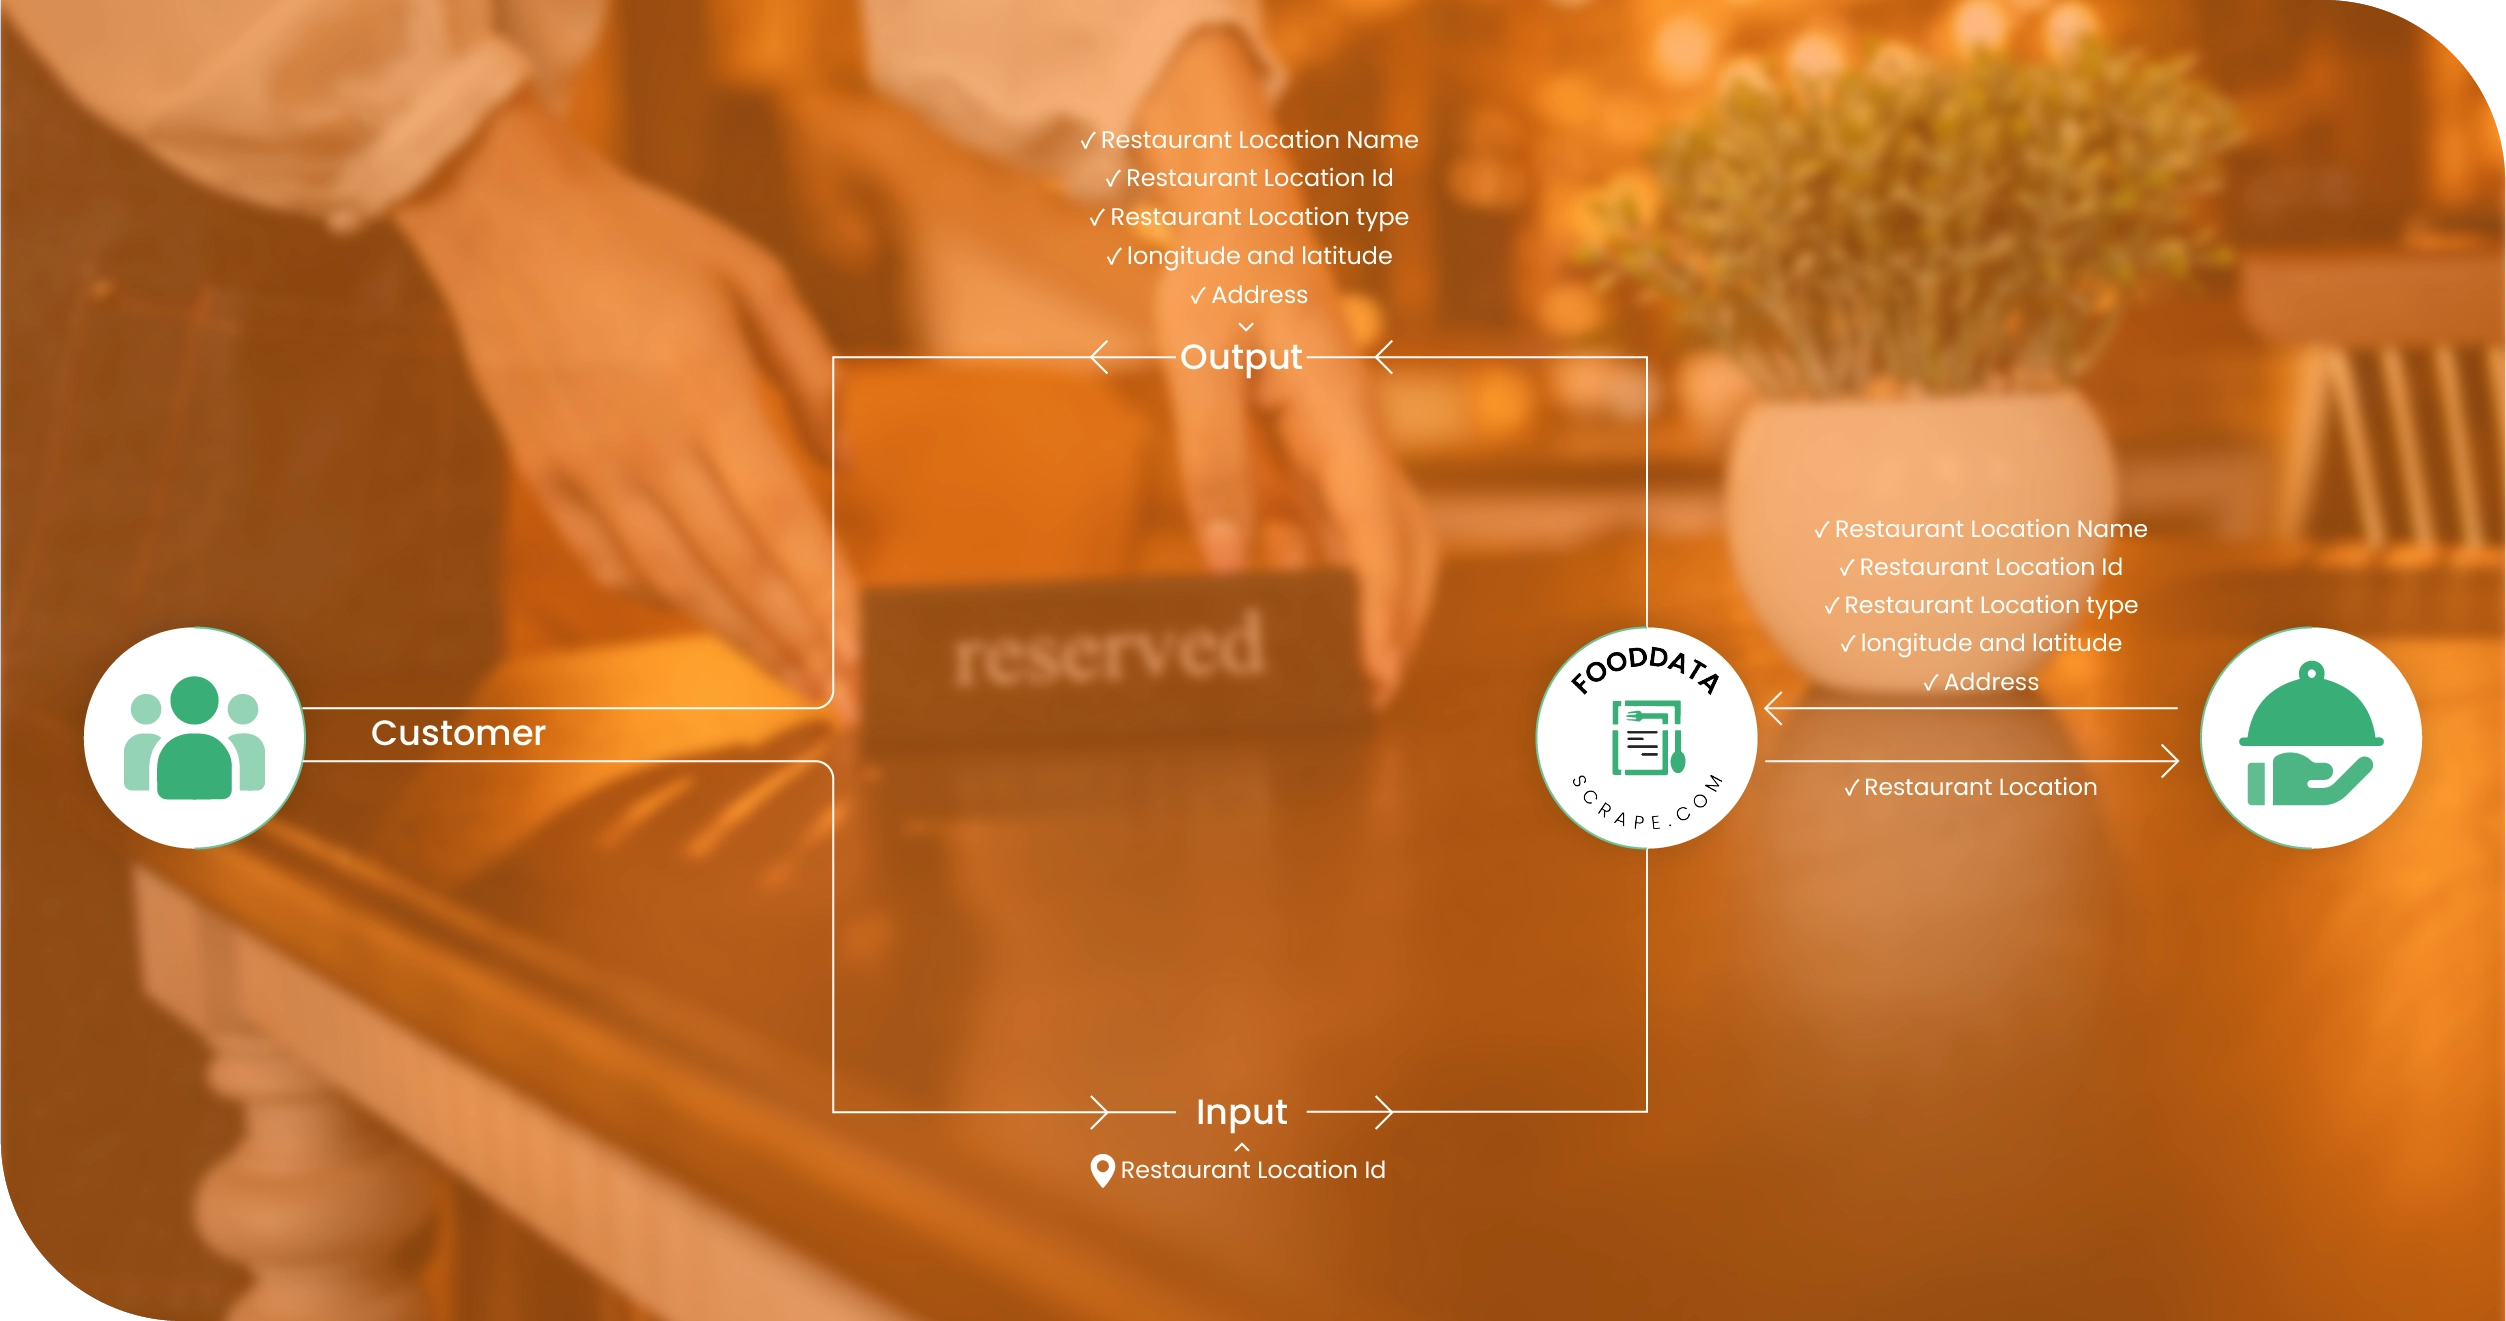
- Centralized Data Collection: We designed a unified framework to gather reservations, delivery orders, and guest information from multiple platforms into a single structured database. This ensured consistent formatting, timestamping, and validation, enabling accurate cross-outlet performance analysis and reliable reporting for management teams.
- Automated Data Cleaning and Standardization: Raw data was processed through automated pipelines to remove duplicates, standardize dish names, align pricing, and correct inconsistencies. This step ensured that analytics were accurate, comparable, and ready for insights, reducing manual intervention and improving operational efficiency across multiple locations.
- Real-Time Synchronization: We implemented frequent updates and near real-time synchronization to capture hourly booking changes, cancellations, and delivery orders. This methodology allowed restaurants to monitor trends dynamically, react promptly to demand fluctuations, and optimize service and resource allocation effectively.
- Competitive Benchmarking and Trend Analysis: By mapping similar cuisine categories, price ranges, and booking patterns, we provided structured competitor benchmarking. This enabled actionable insights into market trends, popular dishes, and customer preferences, helping restaurants make informed strategic and promotional decisions.
- Interactive Analytics and Reporting: We developed dashboards with visualizations, trend charts, and performance metrics for each outlet. This allowed management to monitor key indicators, forecast demand, and make data-driven decisions for staffing, pricing, menu adjustments, and marketing campaigns efficiently.
Advantages of Collecting Data Using Food Data Scrape
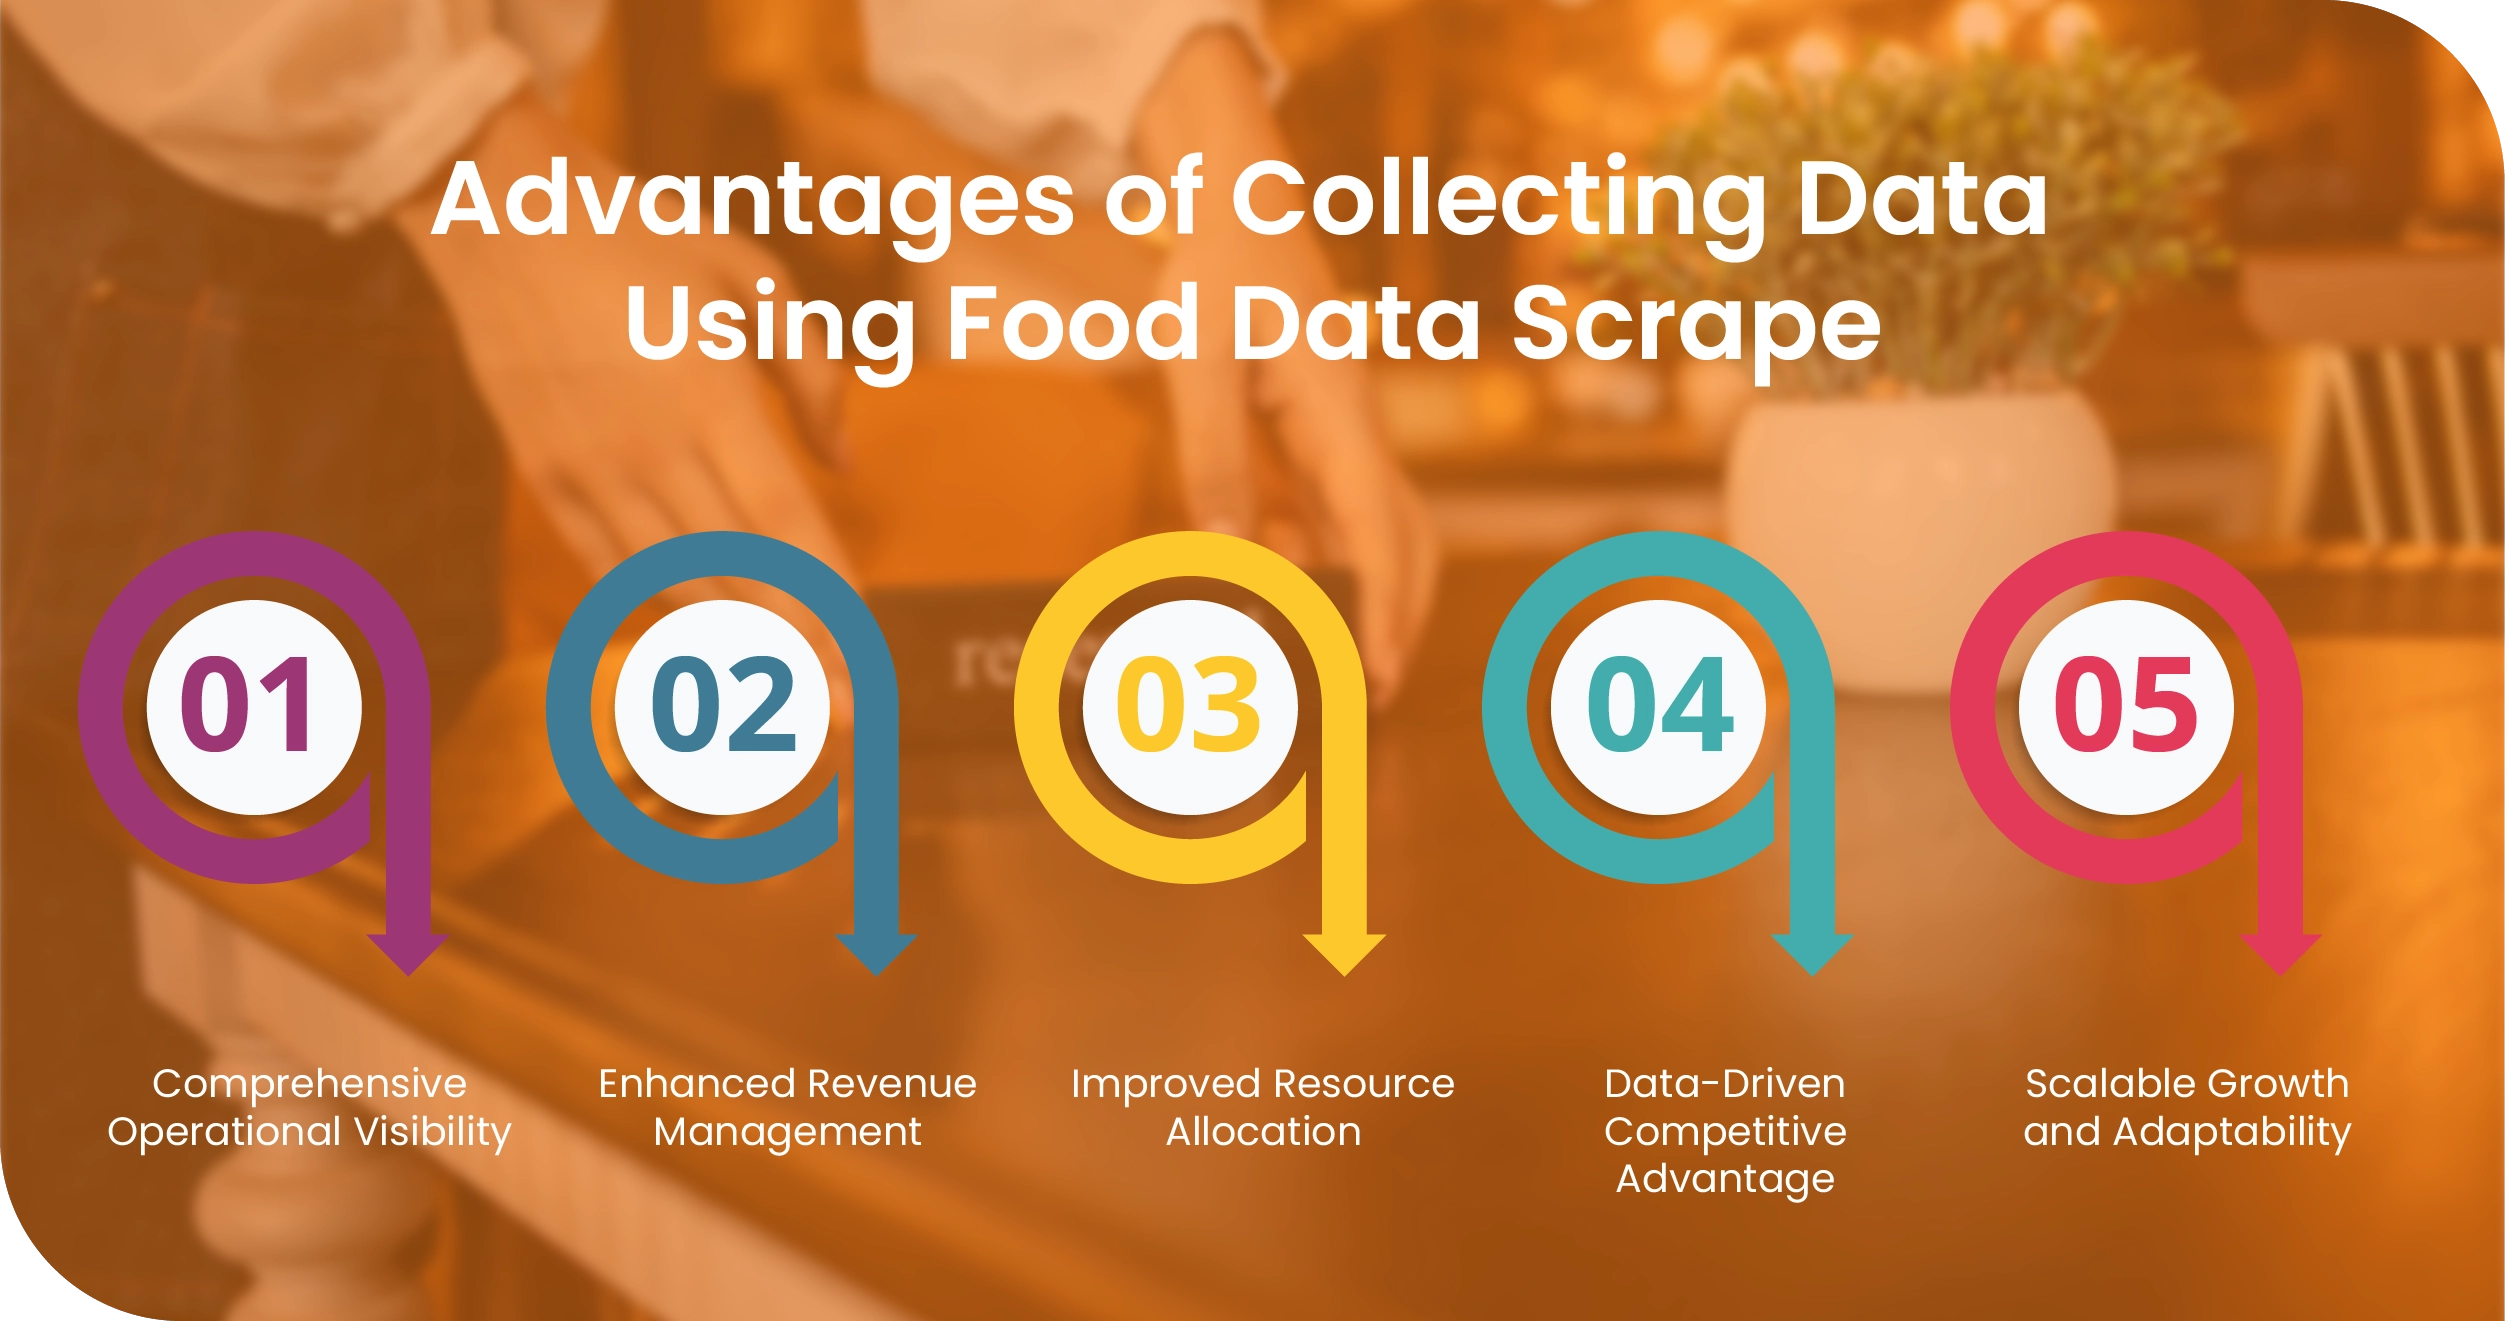
- Comprehensive Operational Visibility: Our services provide a complete view of reservations, dine-in occupancy, and delivery orders. Managers can track trends, monitor performance, and identify high-demand periods, enabling proactive decision-making and reducing reliance on manual reporting or fragmented data sources.
- Enhanced Revenue Management: By analyzing booking patterns, cancellation rates, and peak order timings, restaurants can optimize pricing, promotions, and menu offerings. This leads to increased table utilization, higher average order values, and improved overall revenue across all outlets.
- Improved Resource Allocation: Real-time insights allow businesses to allocate staff efficiently based on demand patterns, reduce service delays, and prevent overstaffing. Optimized scheduling enhances customer experience while keeping operational costs in check.
- Data-Driven Competitive Advantage: Access to structured performance and trend data empowers restaurants to benchmark against competitors, understand customer preferences, and adjust strategies accordingly. This ensures stronger positioning and more effective marketing campaigns.
- Scalable Growth and Adaptability: The system is designed to scale as restaurants expand, adding new outlets or virtual brands. Consistent, structured insights support strategic decision-making, streamlined operations, and growth without compromising data quality or operational efficiency.
Client’s Testimonial
"Working with this team has completely transformed how we manage reservations and delivery orders across our multi-city outlets. Their solution provided real-time insights into bookings, cancellations, and peak hours, making staffing and menu planning far more efficient. The dashboards are intuitive, allowing us to quickly identify high-demand periods and adjust promotions to maximize revenue. With their structured data approach, we could benchmark performance, reduce no-shows, and optimize both dine-in and delivery operations seamlessly. Their expertise and support were exceptional, enabling us to make informed, data-driven decisions that significantly improved overall operational efficiency and customer satisfaction."
Operations Head
Final Outcome
The final outcome of our engagement delivered a fully integrated, data-driven system for the client. Leveraging Restaurant Data Intelligence, management gained a consolidated view of reservations, delivery orders, cancellations, and peak-hour trends, enabling smarter operational decisions. Through advanced Food delivery Intelligence, the client could analyze delivery demand alongside dine-in patterns, optimize staffing, and plan promotional campaigns more effectively. A dynamic Food Price Dashboard provided real-time insights into pricing trends, competitor offerings, and menu performance, allowing data-backed adjustments to maximize revenue. Additionally, structured Food Datasets capturing historical and live order patterns, customer preferences, and booking behaviors enabled predictive forecasting and strategic menu planning. Within three months, table occupancy increased by 21%, cancellations decreased, and overall revenue improved significantly, demonstrating the tangible impact of integrated, intelligent analytics.

