
Introduction
Short answer: Liquor price monitoring in Australia means tracking the public shelf price, member price, promotion and stock status of the same products across retailers such as Dan Murphy's, BWS, Liquorland and ALDI. Done well, it matches each product exactly, records prices by state or store, and runs on a fixed schedule.
The market is concentrated and competitive. A few large chains set the tone, while promotions, member deals and price-match policies change the real price week to week.
This guide explains why liquor price monitoring matters, which retailers to cover, the data fields to collect, how to match wines and spirits, how often to check, and what to keep in mind on compliance.
Why liquor price monitoring matters in Australia
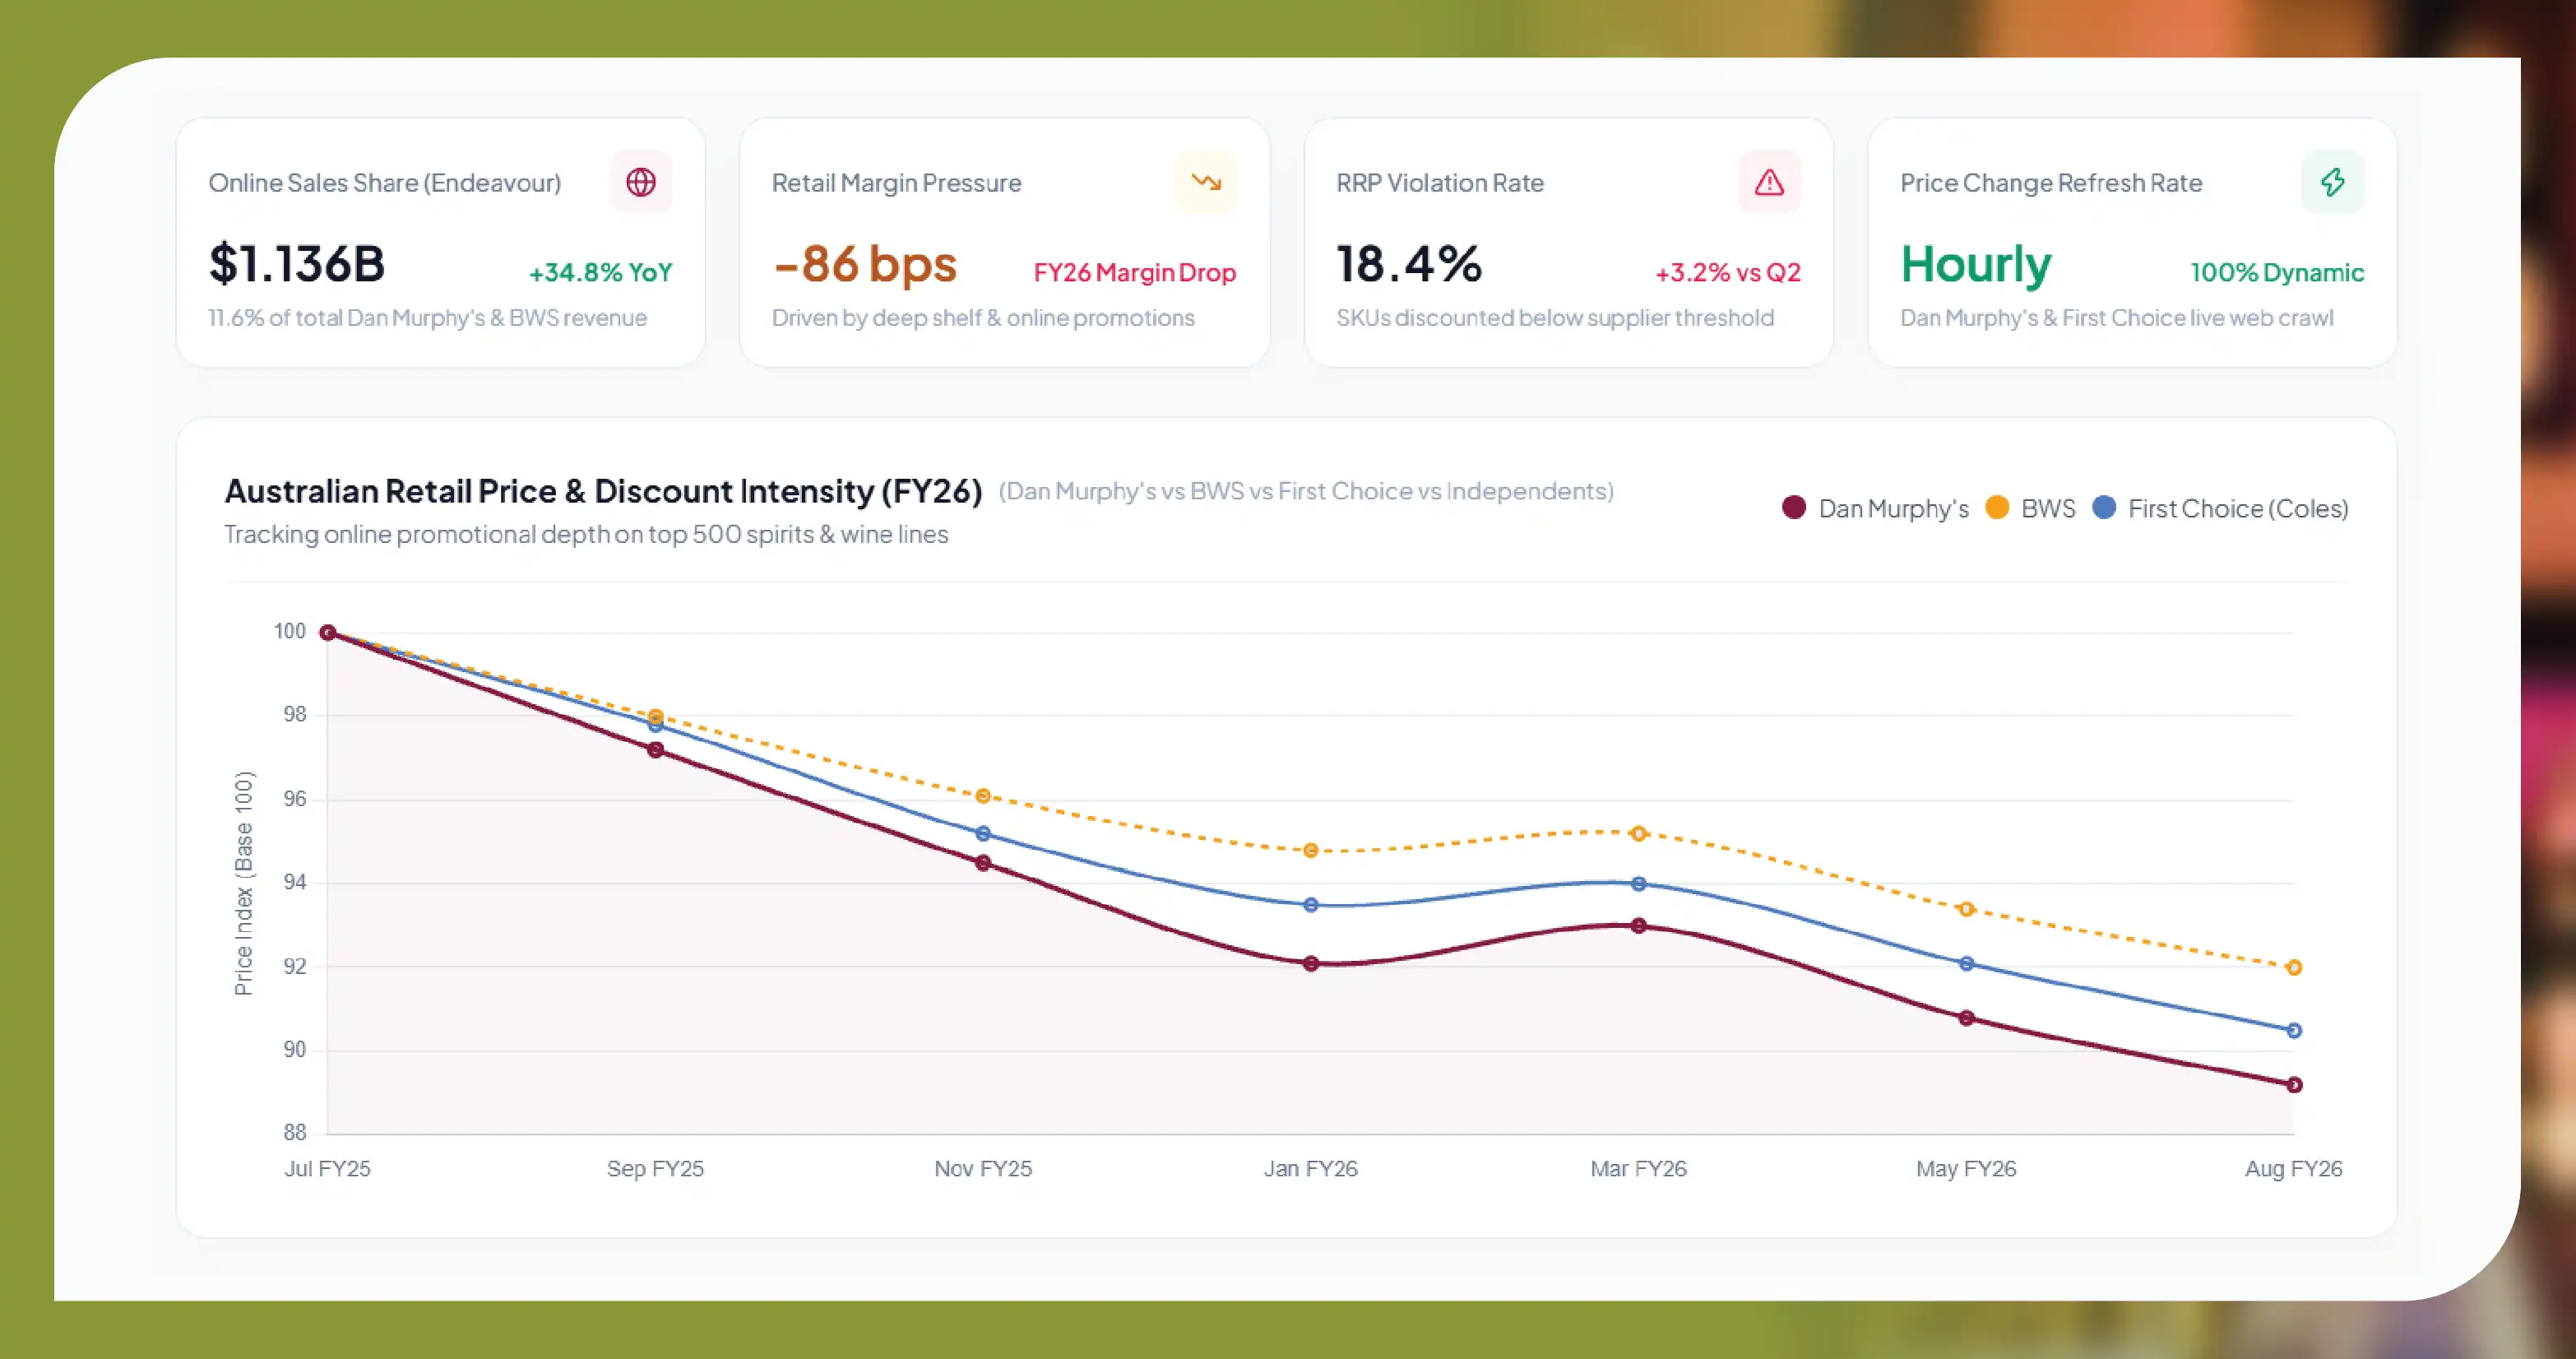
Price competition is intense right now. Endeavour Group, which runs Dan Murphy's and BWS, reported FY26 retail sales of about $10.0 billion, up 0.7%. Its retail gross margin fell 86 basis points, which it put down to lower shelf prices and higher promotional activity. Management said promotional activity "remains elevated, particularly in the online channel".
Online matters more each year for liquor price monitoring. Dan Murphy's and BWS online sales reached $1,136 million in FY26, up 34.8%, or 11.6% of their combined sales. That means more prices are visible, and more change, on public websites.
Who uses liquor price monitoring?
- Wine and spirits brands: check whether retailers follow recommended retail prices (RRP) and how deep promotions go.
- Distributors and importers: compare shelf prices for their range against rival brands, by state and channel.
- Retailers and independent bottle shops: see where they sit against the chains on key lines.
- Analysts and category teams: follow promotion intensity and price moves over time.
The retailers that matter and how they differ
Each retailer prices in its own way, so a liquor price monitoring plan should record more than one price per product. The table summarises what we found on official pages today.
| Retailer | Group | Scale (official figure) | Pricing features to capture |
|---|---|---|---|
| Dan Murphy's | Endeavour Group | 288 stores at end of FY26; 5.6 million active My Dan's members | Shelf price, member offers, multi-buy and case price, Lowest Liquor Price Guarantee context |
| BWS | Endeavour Group | 1,451 stores at end of FY26 | Shelf price, local specials, pack and case price, stock by store |
| Liquorland (incl. former First Choice and Vintage Cellars) | Coles Liquor | 984 stores being unified under Liquorland, Liquorland Cellars and Liquorland Warehouse | Shelf price, Flybuys-linked offers, Price Match Promise, one website for all formats |
| ALDI | ALDI Australia | No official liquor store count published; sells liquor in NSW, Victoria, the ACT and WA, not Queensland or SA (reported April 2024) | Mostly exclusive labels; weekly special-buy liquor; state availability |
| Independent and banner bottle shops | Various banner groups and IGA Liquor | No single official count; varies by banner group and state | Catalogue specials, store-level prices, click-and-collect stock |
Sources: Endeavour FY26 profit announcement and the Coles media release of 26 March 2025, which set out the move of Vintage Cellars and First Choice Liquor Market stores to the Liquorland brand with one website and aligned Flybuys.
Why price-match and price-beat policies affect your data
Dan Murphy's Lowest Liquor Price Guarantee says it will beat a competitor's current price on an identical, in-stock item. It excludes overseas, member-only, duty-free and wholesale-direct sellers, clearance prices, and any price where beating it would breach responsible-alcohol rules.
Coles announced a Liquorland Price Match Promise for identical items from a competitor in the same state, subject to terms such as a 10km distance limit. For liquor price monitoring, this means two things. You need exact product matches, and you need prices by state and location, not just one national price.
The 12 data fields to track
- Product name and retailer ID: the listing name and the retailer's product code, so records join over time.
- Brand and producer: the brand on the label and the producer or distillery.
- Category and style: wine, beer, spirits, RTD or cider, plus style such as shiraz, IPA or single malt.
- Varietal and region: grape variety and region for wine, such as Barossa Valley shiraz.
- Vintage: the year on the label, which changes the product for wine.
- ABV: alcohol by volume, which also lets you work out price per standard drink.
- Volume and pack: bottle or can size and pack count, such as 750ml, 700ml, 6 x 375ml or a 24-can case.
- Shelf price and case price: single-unit price and any case or multi-buy price.
- Unit price: price per litre or per standard drink, calculated the same way for every retailer.
- Member price and promotion: member-only price shown publicly, promo type, promo price and end date.
- Stock by store or postcode: in-stock status for a fixed set of stores or postcodes.
- Ratings and timestamp: public rating and review count, plus capture date, state and store.
How to collect, clean and match the data
1. Set your product list and locations
Liquor price monitoring starts with a list of products that matter to you, such as your range plus key rivals. Then choose a fixed set of stores or postcodes in each state. Prices and stock can differ by location, so keep these locations the same every run.
2. Capture every price shown
For each product, capture the shelf price, any case or multi-buy price, any publicly displayed member price and the promotion. Keep each price in its own column. Mixing them is the most common reason liquor price monitoring reports disagree.
3. Match products exactly
In liquor price monitoring, matching is harder for wine than for most grocery items. The same label can appear in several vintages, sizes and pack types. Retailer exclusives may have no equal at all.
| Matching key | Why it matters | Example check |
|---|---|---|
| Producer + brand | Different producers use similar names | Same producer name on both listings |
| Varietal or style | One brand can sell several varietals | Shiraz vs cabernet sauvignon |
| Region | Regional tiers are priced differently | Regional vs multi-region blend |
| Vintage | Older or newer vintages can sell at different prices | Same year on both listings, or flag as near match |
| Volume and pack | Price per bottle changes with pack size | 750ml single vs 6-bottle case |
| ABV | Confirms the variant and supports unit price | Same ABV within a small tolerance |
| Retailer exclusive flag | Exclusive labels cannot be matched like for like | Compare by style and price band instead |
Use barcodes where they are shown publicly, then confirm uncertain matches by hand. Where no exact match exists, compare within a style and price band instead of forcing a pair.
4. Choose a cadence
Most liquor price monitoring runs weekly, aligned with catalogue cycles, with extra runs at peak trading times. Daily checks suit fast-moving online prices and key lines. Christmas, Easter and major sporting events usually deserve more frequent checks.
Liquor price monitoring by state and category
Liquor licensing is set by each state and territory, so trading rules and promotions can differ. National liquor price monitoring should still be built from state-level data.
The Northern Territory is a clear example. Takeaway trading hours and, in some towns, per-day purchase limits are set by location, and buyers must show photo ID checked against the Banned Drinker Register. The NT's minimum unit price of $1.30 per standard drink, in place since October 2018, was repealed from 1 March 2025. Price histories that span that date need a flag, because some cheaper NT prices after March 2025 reflect the rule change, not a promotion.
| Category | What changes prices | Suggested cadence | Key fields |
|---|---|---|---|
| Wine | Vintage changes, multi-buy deals, case discounts | Weekly; daily for top lines | Varietal, region, vintage, case price |
| Spirits | Bottle size, gift packs, catalogue specials | Weekly; daily before Christmas | ABV, 700ml vs 1L, promo price |
| Beer | Case and pack deals, seasonal events | Weekly | Pack type, case price, unit price |
| RTDs and cider | Multi-buy offers, new flavour launches | Weekly | Pack, ABV, promo type |
| All categories, NT | Local purchase rules; 1 March 2025 removal of the floor price | Weekly, with a pre/post March 2025 flag | State, store, unit price per standard drink |
Use cases
- RRP and promotion checks: brands see how often and how deeply each retailer discounts their range.
- Competitor benchmarking: distributors compare shelf and case prices for their wines against rival labels.
- Range and stock gaps: spot products missing from certain stores or postcodes.
- Price history: use liquor price monitoring to build a time series for pricing reviews and trade negotiations.
- Wine price comparison: compare like-for-like wines by varietal, region and vintage across retailers.
- Price-match exposure: see where a rival's price could trigger a price-beat or price-match claim.
Legal and compliance basics
- Public prices only: liquor price monitoring should collect only prices, promotions and stock status any visitor can see without logging in.
- Respect age gates: use age-confirmation screens as intended and never bypass them or any login, CAPTCHA or paywall.
- Follow site rules: check each retailer's terms of service and robots.txt, and keep request rates low.
- No personal data: never collect customer, member or reviewer personal details.
- Responsible alcohol marketing: if you publish comparisons, keep them factual and in line with responsible alcohol advertising codes and state rules. Do not promote excessive drinking.
Build vs buy: choosing a provider
A small in-house liquor price monitoring tracker can work for a short product list at one retailer. It gets harder with several retailers, state-level prices, member prices and wine matching. Site changes also mean ongoing maintenance.
When comparing providers for liquor price monitoring, ask:
- Coverage: which retailers, states and stores are included?
- Price types: are shelf, case, member and promo prices kept separate?
- Matching: how are vintage, pack and retailer exclusives handled, and who reviews uncertain matches?
- Cadence and history: can runs be weekly and daily, and is history kept?
- Delivery: CSV, JSON, API or dashboard, and how changes are flagged.
- Compliance: a written public-data-only policy that respects age gates.
Food Data Scrape supports this through Liquor Price Data Scraping Services. Coverage is set per project across the Australian retailers and states you need – ask for the current list.
Get a free sample dataset. See a sample of matched wine, beer and spirits prices across Australian retailers for your product list and states. Fields include shelf, case, member and promo price, unit price, vintage, pack and stock by store.
Questions
Frequently Asked Questions
It is the regular tracking of public prices, promotions and stock for the same alcohol products across retailers, so you can compare them over time.
Most programmes start with Dan Murphy's, BWS and Liquorland, which make up a large share of stores, then add ALDI and independent banner groups for their range.
Only where a retailer shows them publicly. Keep member prices in a separate field from shelf prices and never log in or bypass access controls to see them.
Match on producer, varietal, region, volume and vintage. If only the vintage differs, flag the pair as a near match rather than an exact one.
Weekly suits most categories. Use daily checks for key online lines and peak periods such as Christmas.
Get a Free Food Data Sample in 48 Hours.
Tell us your platforms, target markets and required fields — we'll map exactly what's possible with food data scraping, recommend the right approach, and send a working sample so you can verify quality before any commitment.
Request a strategy call
Thanks — our data team will reach out within 48 hours with your sample.



