
The Amazon coffee marketplace in 2026 features over 33,000 products, including beans, pods, machines, syrups, and accessories. Starbucks and Lavazza dominate with thousands of listings and millions of customer reviews. Shoppers show a clear preference for convenience, driving demand for pods, single-serve machines, and syrups. Premium espresso machines command high prices, while affordable beans and small accessories attract frequent repeat purchases. Interestingly, 96% of listings succeed without paid advertising, highlighting the importance of search optimization, reviews, and organic rankings. Pods generate the most engagement, beans lead in total listings, and complementary accessories enhance brand loyalty. Data-driven strategies, targeted discounts, and ecosystem-based approaches allow smaller brands to compete effectively and maintain visibility. Monitoring trends and adapting strategies based on consumer behavior ensures sustained growth and strong performance in this competitive marketplace.
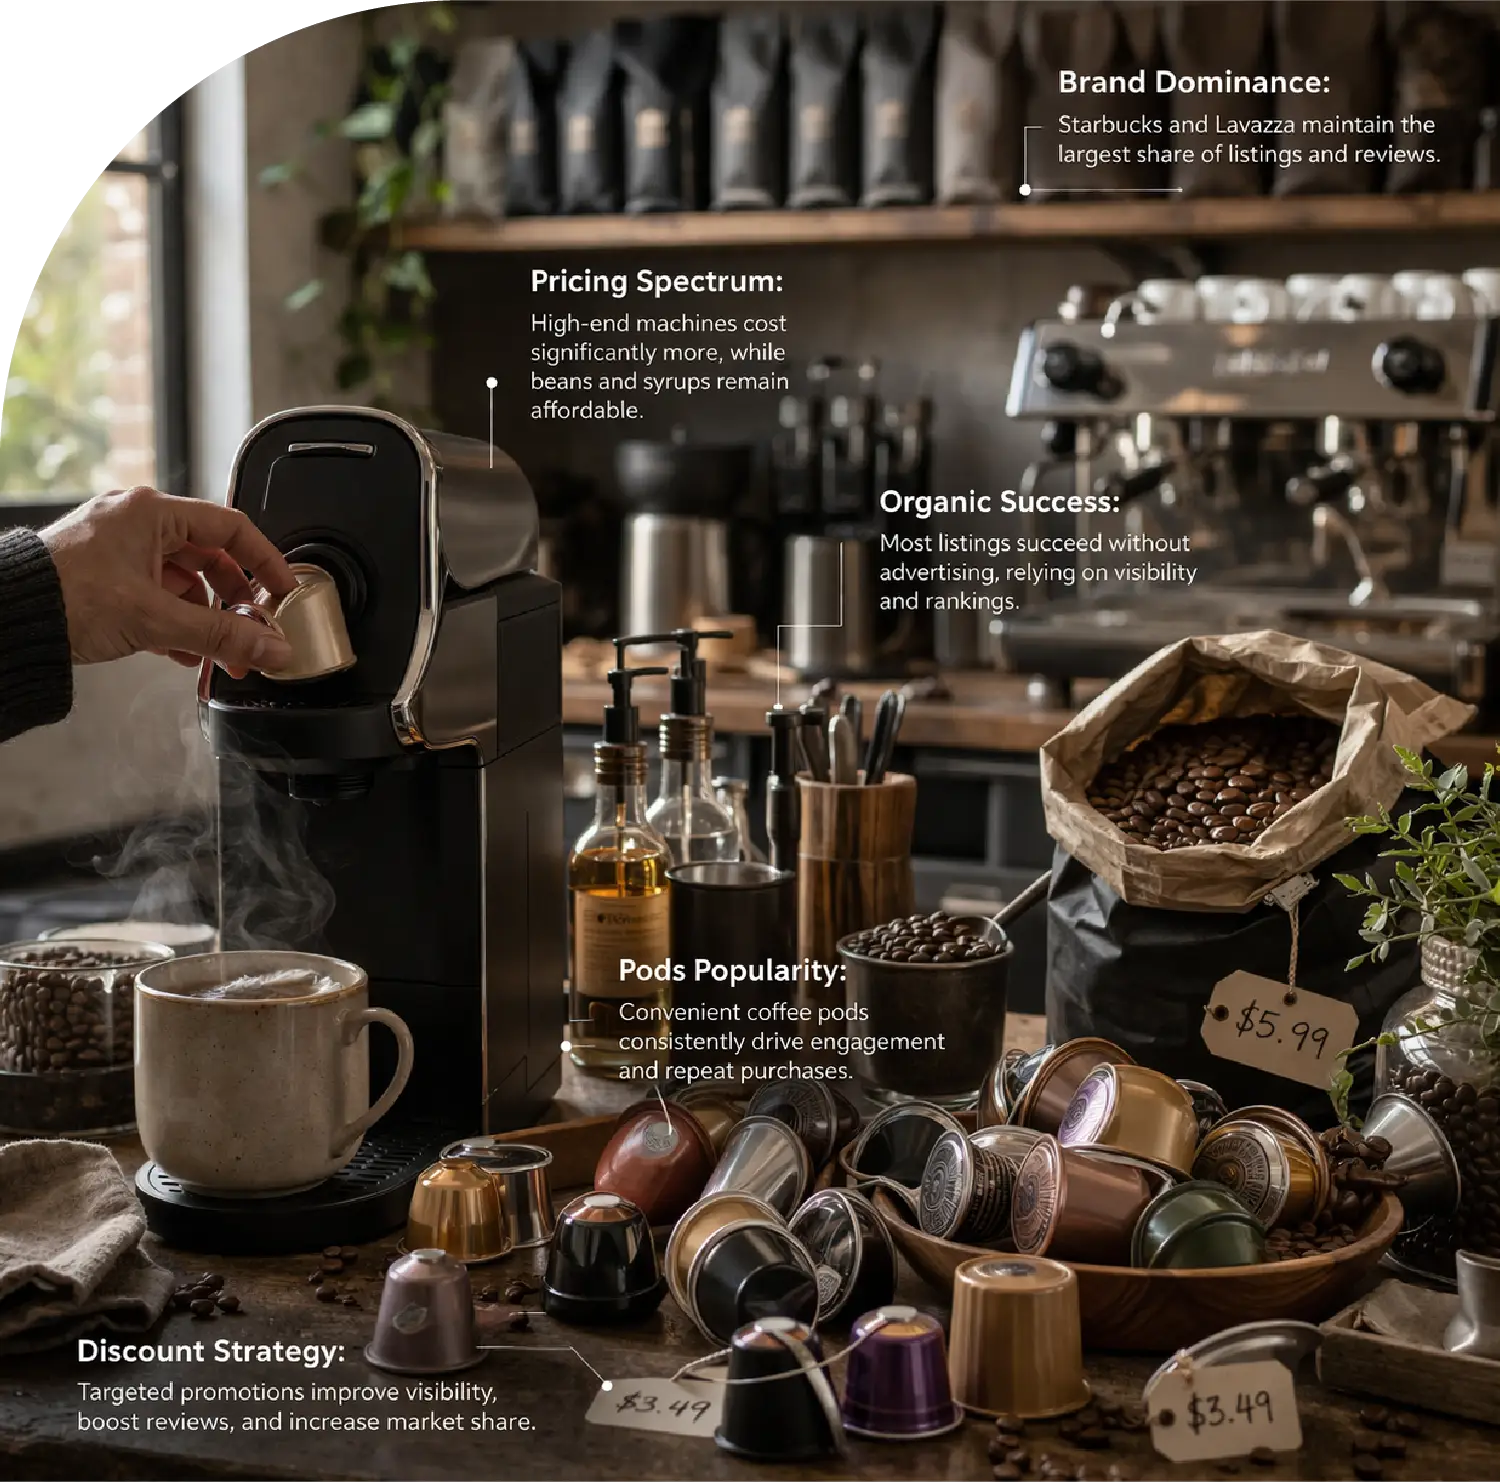
Brand Dominance: Starbucks and Lavazza maintain the largest share of listings and reviews.
Pods Popularity: Convenient coffee pods consistently drive engagement and repeat purchases.
Organic Success: Most listings succeed without advertising, relying on visibility and rankings.
Pricing Spectrum: High-end machines cost significantly more, while beans and syrups remain affordable.
Discount Strategy: Targeted promotions improve visibility, boost reviews, and increase market share.
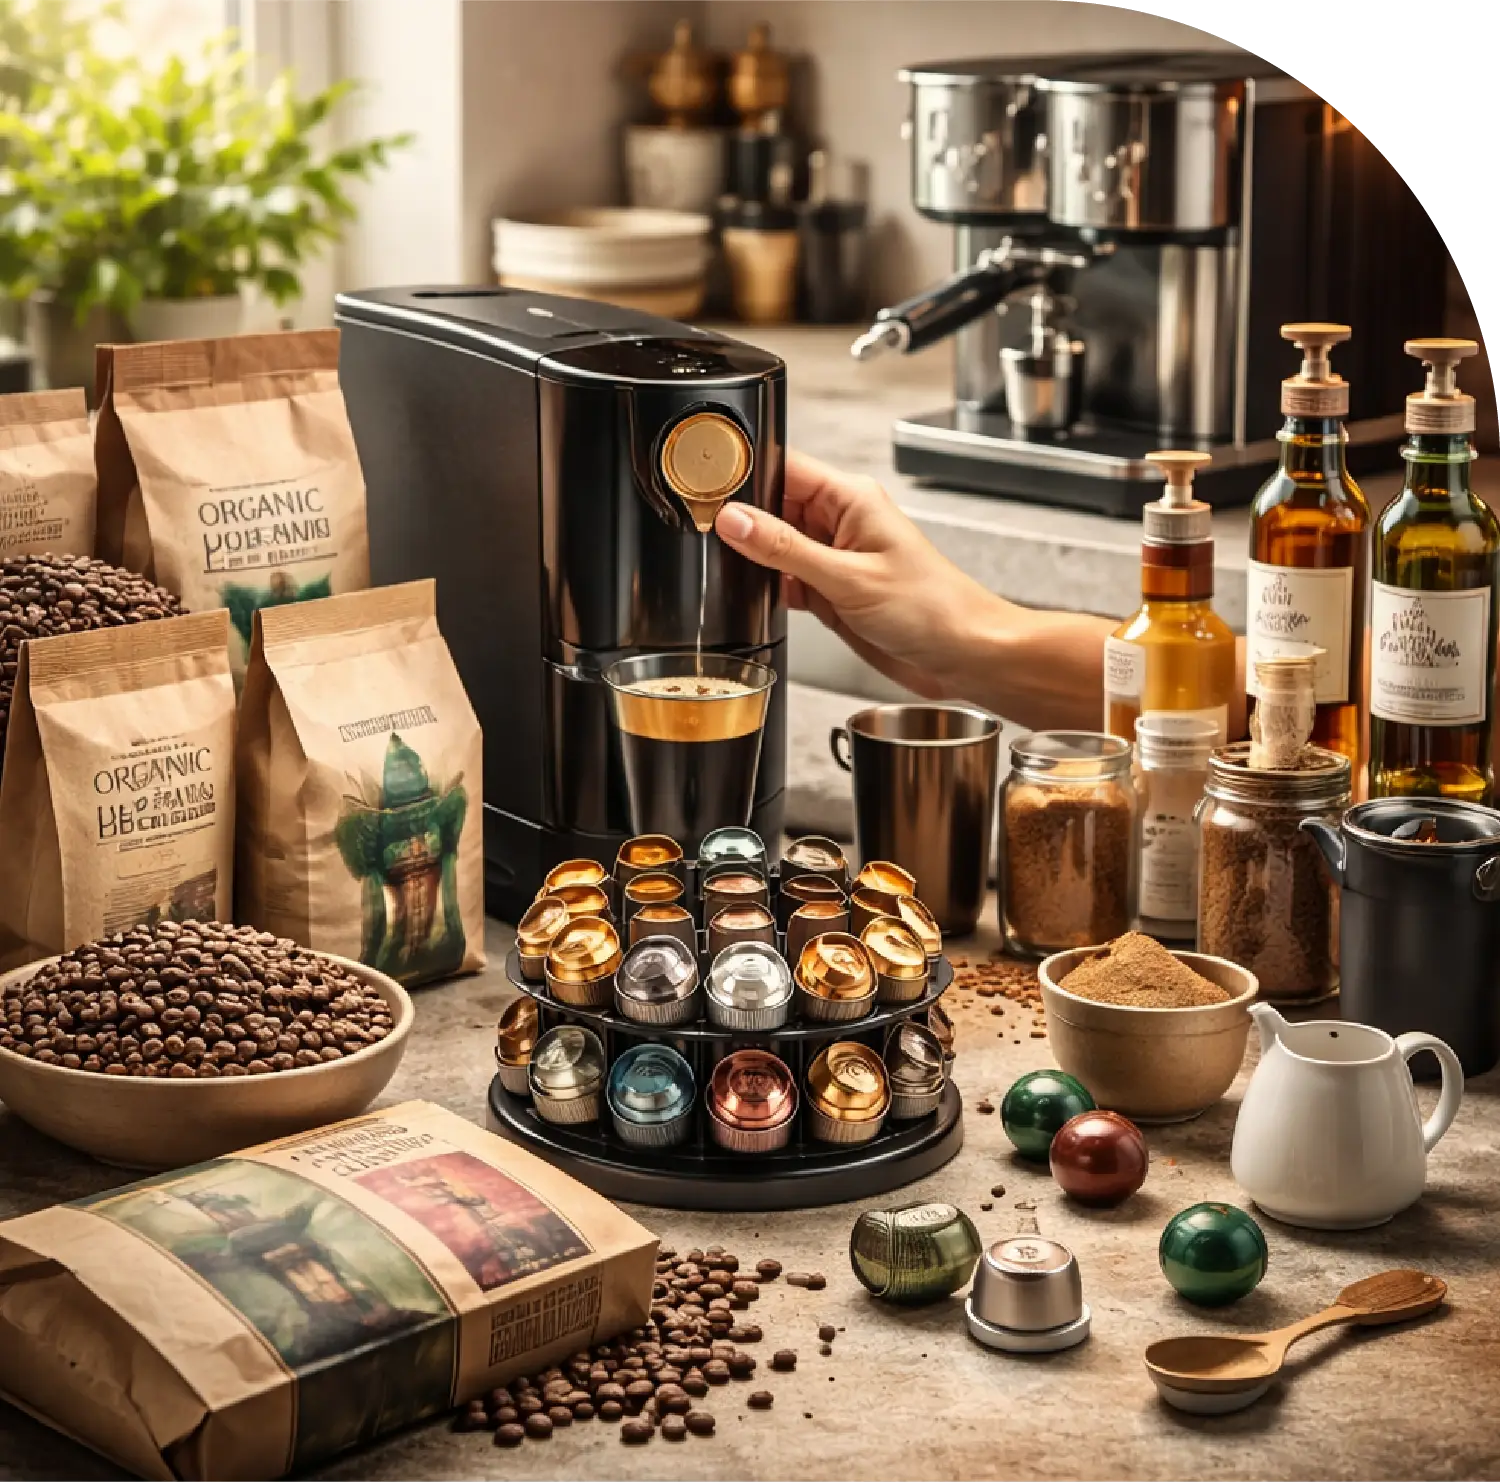
The coffee aisle on Amazon has evolved into a vast, dynamic marketplace. From beans to pods, machines, syrups, and accessories, the number of products is overwhelming. To succeed, brands need more than guesswork—they need actionable data.
By leveraging tools to Scrape Amazon Coffee Marketplace Insights – 2026, sellers and market analysts can understand customer preferences, identify growth opportunities, and benchmark competitors. Using Amazon Coffee Marketplace Insights Data Scraping, we analyzed over 33,000 coffee products to uncover trends in reviews, sales, and pricing.
Continuous Amazon Coffee Marketplace Data Tracking ensures brands can respond to competitors, maintain market share, and make informed decisions.
Two brands dominate Amazon’s coffee shelf: Starbucks and Lavazza. Starbucks leads with 1,789 listings, while Lavazza follows closely at 1,596 listings. Combined, they represent over 10% of total coffee listings.
Other notable brands include Peet’s Coffee, Whole Foods Market, Kicking Horse, Crazy Cups, and Folgers, all maintaining substantial presence.
Monitoring these leaders using method to Extract Amazon Coffee Product Trends and Demand Data helps brands identify patterns in consumer preference, product success, and pricing strategies.
| Rank | Brand | Total Listings | Total Reviews | Avg. Rating | Best-Selling Product Types |
|---|---|---|---|---|---|
| 1 | Starbucks | 1,789 | 20,500,000 | 4.6 | Beans, Pods, Syrups |
| 2 | Lavazza | 1,596 | 14,100,000 | 4.5 | Beans, Capsules, Machines |
| 3 | Peet’s Coffee | 754 | 5,700,000 | 4.4 | Beans, Pods |
| 4 | Whole Foods Market | 617 | 4,200,000 | 4.3 | Organic Beans, Pods |
| 5 | Kicking Horse Coffee | 580 | 3,200,000 | 4.5 | Beans, Cold Brew |
| 6 | Crazy Cups | 510 | 2,800,000 | 4.2 | Pods, Capsules |
| 7 | Folgers | 500 | 3,100,000 | 4.0 | Ground Coffee, Pods |
| 8 | Death Wish Coffee | 468 | 7,300,000 | 4.7 | Beans, Pods |
| 9 | Nespresso | 410 | 6,070,000 | 4.6 | Capsules, Machines |
| 10 | Solimo (Amazon Private Brand) | 385 | 6,500,000 | 4.5 | Pods, Coffee Blends |
Insight: Brand dominance is not just about the number of listings. High review volume and consistent ratings indicate loyal customer bases. Leveraging Amazon Coffee Marketplace Data Extraction can provide structured insights to track these dynamics in real time.
Customer reviews reveal actual consumption patterns. Pods, capsules, and syrups dominate review counts, showing that convenience drives modern coffee habits. Machines complement these consumables, reinforcing ecosystem-based sales.
Top products include:
Tracking such patterns is possible with a Coffee Product Listings Data Scraper Amazon, providing daily visibility into demand, product performance, and review growth.
| Product Name | Brand | Category | Total Reviews | Avg. Rating | Price (USD) | Sponsored |
|---|---|---|---|---|---|---|
| Solimo Coffee Pods | Solimo | Pods | 182,420 | 4.5 | $11.90 | No |
| Nespresso Vertuo Capsules | Nespresso | Capsules | 123,735 | 4.6 | $21.90 | Yes |
| Jordan’s Skinny Syrups | Jordan’s | Syrups | 116,668 | 4.7 | $8.99 | No |
| Keurig K-Classic Single Serve Coffee Maker | Keurig | Brewer | 109,737 | 4.5 | $65.46 | Yes |
| San Francisco Bay Compostable Coffee Pods | San Francisco Bay | Pods | 91,546 | 4.4 | $12.50 | No |
| Starbucks Pike Place Roast | Starbucks | Beans | 65,200 | 4.6 | $16.50 | No |
| Lavazza Qualità Rossa Ground Coffee | Lavazza | Beans | 72,000 | 4.5 | $15.90 | No |
| Peet’s Major Dickason’s Blend | Peet’s Coffee | Beans | 58,450 | 4.5 | $17.20 | No |
| Folgers Classic Roast Ground Coffee | Folgers | Ground Coffee | 52,800 | 4.0 | $12.70 | Yes |
| Kicking Horse Kick Ass Dark Roast | Kicking Horse | Beans | 49,500 | 4.5 | $18.50 | No |
Insight: Pods dominate engagement due to convenience, while beans dominate listings. Brands integrating machines and consumables enjoy higher customer retention.
Surprisingly, only 4% of coffee listings on Amazon are sponsored. The remaining 96% succeed organically. Brands that optimize Amazon Coffee Competitive Market Intelligence through keywords, review accumulation, and ranking improvements gain an advantage without heavy ad spending.
Price premium:
This 40% premium emphasizes that organic visibility is often more cost-effective than sponsored listings for sustained growth.
The Amazon coffee market splits into two extremes: premium appliances and affordable consumables.
Premium segment:
Budget segment:
The Amazon Fresh Grocery Delivery Scraping API helps brands monitor competitor pricing efficiently.
The Amazon Fresh Grocery Delivery Dataset provides real-time insights into promotional strategies.
Smaller brands rely on aggressive discounting (50–70%) to compete with market leaders. Data-driven monitoring ensures these campaigns translate into improved rankings, visibility, and reviews.
Web Scraping Grocery Data can automate tracking of competitors’ promotions efficiently.
Grocery Delivery Extraction API enables rapid response and supports optimal market positioning.
The Amazon coffee marketplace in 2026 is a study in contrasts: premium machines command high prices, while pods, beans, and syrups dominate volume and engagement. Brands succeed by leveraging structured insights, maintaining organic visibility, and monitoring competitor activity.
Using a Grocery Price Tracking Dashboard allows brands to monitor competitor pricing effectively. Leveraging Grocery Data Intelligence helps brands make informed decisions and optimize strategies. Structured Grocery Datasets enable companies to capture growth opportunities efficiently.
Data is no longer optional; it forms the foundation of competitive advantage in Amazon’s coffee ecosystem.
Are you in need of high-class scraping services? Food Data Scrape should be your first point of call. We are undoubtedly the best in Food Data Aggregator and Mobile Grocery App Scraping service and we render impeccable data insights and analytics for strategic decision-making. With a legacy of excellence as our backbone, we help companies become data-driven, fueling their development. Please take advantage of our tailored solutions that will add value to your business. Contact us today to unlock the value of your data.

