Introduction
As Navratri approaches, restaurants, grocery apps, and food delivery platforms are gearing up to handle the sudden surge in demand for fasting-friendly snacks, beverages, and essential ingredients. With the festival just a few days away, it is crucial for businesses to anticipate consumer behavior and ensure that popular items are well-stocked. Urban Gen Z customers, in particular, tend to place midnight orders, making late-night demand a significant factor for quick commerce platforms. At Food Data Scrape, we leverage historical Quick Commerce data to generate actionable insights, helping businesses understand the patterns that are likely to emerge during this festive period.
To help brands and grocery delivery platforms prepare, we Scrape City-Wise Midnight Quick Commerce Orders for Navratri, analyzing trends across major Indian cities like Mumbai, Delhi, Bengaluru, Pune, and Ahmedabad. By studying past Navratri seasons and observing ordering behaviors, businesses can identify which products are expected to experience a spike in demand. This includes traditional fasting snacks, beverages, dry fruits, and other quick-consumption items that are often ordered during late-night hours. Predictive insights like these allow businesses to optimize inventory levels and allocate delivery resources more efficiently.
Furthermore, understanding city-specific preferences can make all the difference during the festive rush. For instance, some regions may favor traditional ingredients like sabudana, while others lean toward ready-to-eat snack items. Using Scrape Quick Commerce Navratri Orders Data and Food Data Scrape’s predictive analysis, restaurants and quick commerce platforms can stay ahead of consumer demand, minimizing stockouts and ensuring timely deliveries. By choosing to Scrape Midnight Quick Commerce Orders for Navratri, businesses can identify peak ordering times and trending products in each city. As Navratri is just around the corner, early planning based on reliable data can significantly enhance customer satisfaction, increase order volumes, and strengthen brand loyalty during this busy festive season.
Midnight Quick Commerce Trends for Navratri
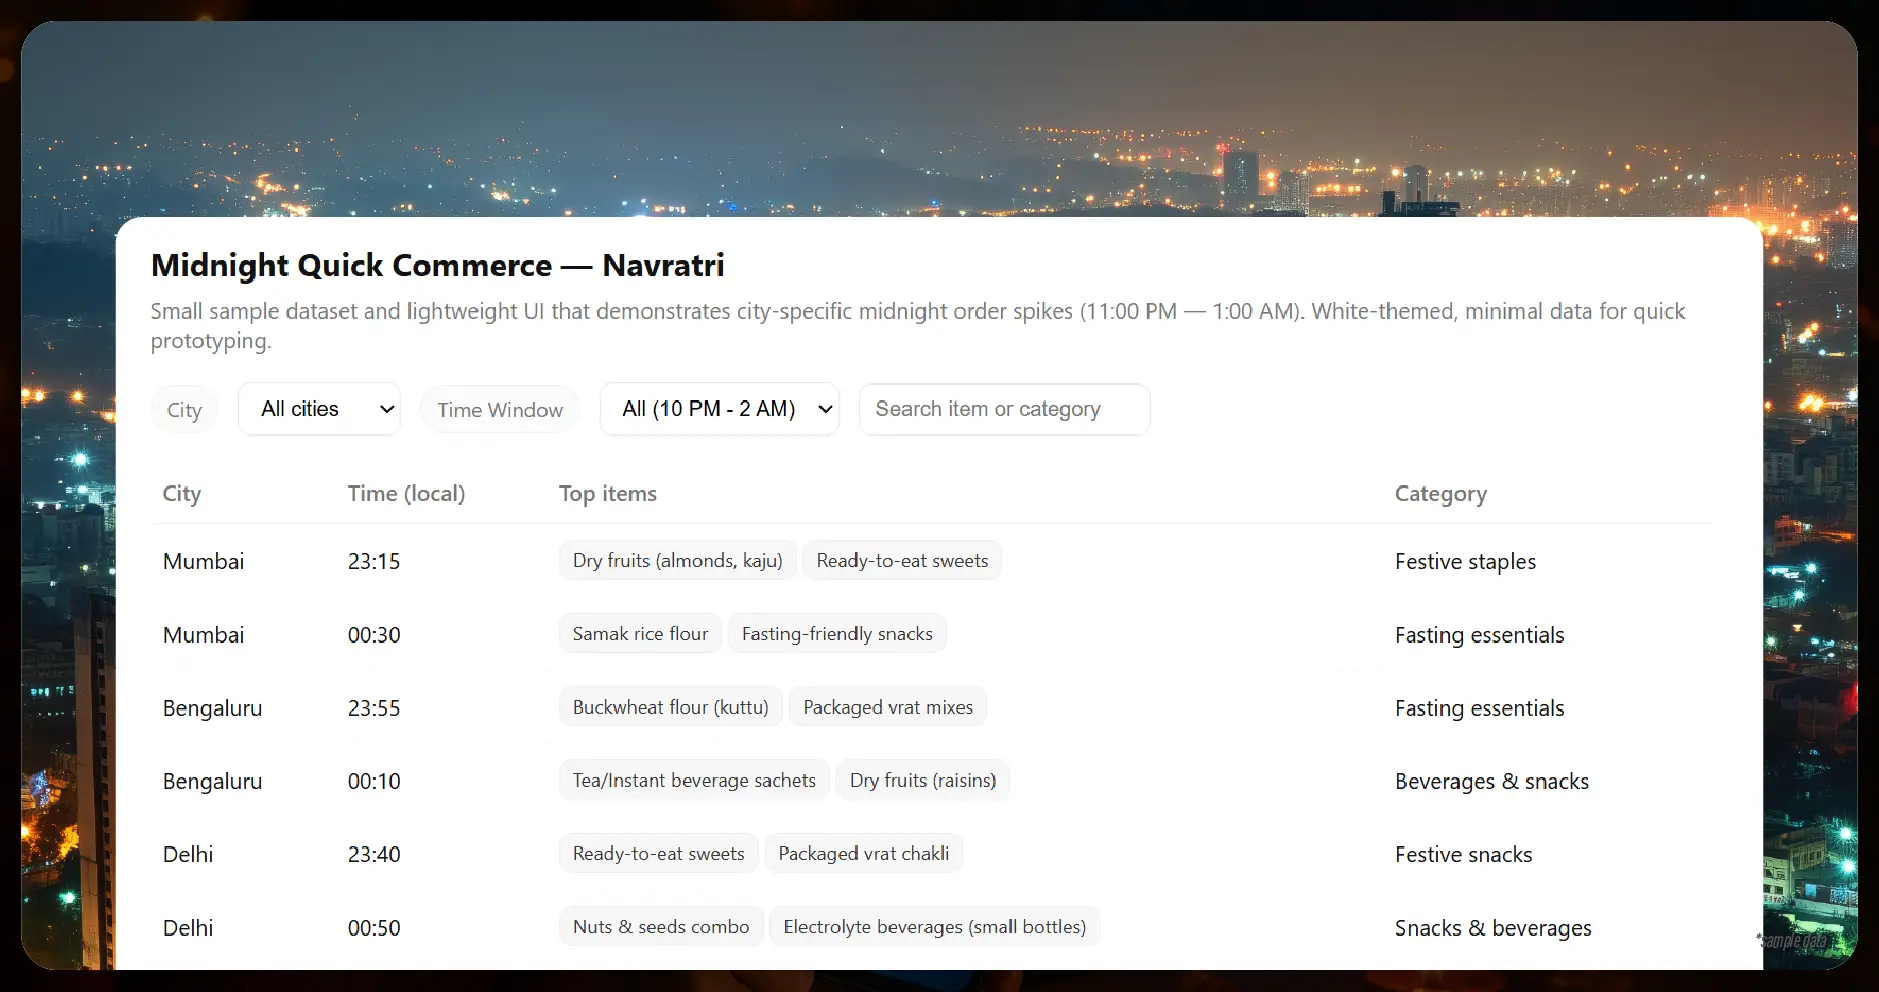
Midnight grocery orders have become increasingly popular during festivals, particularly among younger consumers who prefer late-night convenience shopping. By using Quick Commerce Navratri Orders Data, businesses can anticipate which items are likely to be in high demand and plan logistics accordingly. Our data scraping services track city-specific trends, identifying patterns such as snack preferences, regional ingredients, and beverages that are often purchased after 10 PM.
For example, in metropolitan cities like Mumbai, Bengaluru, and Delhi, orders for dry fruits, flours like samak rice and buckwheat, fasting-friendly snacks, and ready-to-eat sweets spike between 11 PM and 1 AM. Predicting this behavior allows businesses to manage supply chains efficiently, ensuring that popular products are available exactly when consumers need them.
City-Wise Data Extraction Insights
Analyzing City-Wise Quick Commerce Data Extraction for Navratri enables businesses to focus on localized demand patterns. Our predictive models indicate that city-wise variations can be substantial. While Delhi may have a higher demand for processed snacks and ready-to-cook meals, smaller cities may prefer traditional homemade ingredients and local snacks.
Sample Table 1: Predicted Midnight Grocery Orders for Navratri (City-Wise)
| City | Top Ordered Items | Avg Orders/Hour | Predicted Peak Time | Notes |
|---|---|---|---|---|
| Ahmedabad | Fasting Snacks, Fruits, Dry Fruits | 180 | 11 PM – 12 AM | Last year data-based analysis |
| Mumbai | Dry Fruits, Samak Rice, Fasting Sweets | 350 | 12 AM – 1 AM | Predicted based on last year’s data scraping |
| Bengaluru | Buckwheat Flour, Fasting Snacks | 280 | 11 PM – 12 AM | Data extrapolated from previous festival trends |
| Delhi | Ready-to-Eat Sweets, Fasting Mixes | 310 | 12 AM – 1 AM | Predicted using city-specific Quick Commerce data |
| Pune | Fruits, Lassi, Snack Packs | 200 | 11 PM – 12 AM | Last year data-based analysis |
| Hyderabad | Flours, Spices, Fasting Sweets | 180 | 12 AM – 1 AM | Prediction from historical Quick Commerce trends |
Note: All values in the table are predicted based on last year’s data scraping and city-wise analysis.
Night-Time Grocery Orders for Festivals
Scraping Night-Time Grocery Orders for Festivals is crucial for businesses to identify what products see unexpected surges. During Navratri, the types of snacks, beverages, and fasting ingredients ordered late at night vary based on regional preferences. Using Food Data Scrape’s grocery delivery scraping API services, businesses can obtain a detailed dataset showing quantities, frequency, and peak times of popular items.
For instance, some common trends observed in our data include:
- Increased orders of dry fruits and nuts across all metro cities.
- High demand for gluten-free flours and ready-to-cook mixes in Tier-1 cities.
- Spike in beverages like fruit juices and lassi around midnight.
This data is especially useful for preparing grocery price dashboards and tracking price fluctuations in real-time, helping online grocery apps adjust pricing dynamically during high-demand periods.
Tracking Snack Trends
One of the key aspects of our analysis is monitoring Scrape City-Wise Quick Commerce Snack Trends. Snacks are among the fastest-moving products during midnight hours of festivals like Navratri. By monitoring city-level variations, businesses can predict which snacks may go out of stock first and proactively manage replenishment.
Sample Table 2: Midnight Snack Trends (Navratri Prediction)
| City | Popular Snacks | Avg Units Sold/Hour | Notes |
|---|---|---|---|
| Ahmedabad | Fasting Cookies, Dry Fruits, Chikki | 110 | Prediction from historical patterns |
| Mumbai | Fasting Cookies, Chikki | 120 | Predicted based on last year’s midnight order data |
| Delhi | Dry Fruit Laddoos, Fasting Mix | 150 | Scraped and analyzed from city-wise Quick Commerce apps |
| Bengaluru | Rice Flour Sweets, Fasting Chips | 130 | Prediction from historical patterns |
| Pune | Samak Rice Mixes, Nut Bars | 90 | Estimated using Food Data Scrape data |
| Hyderabad | Ragi Flour Snacks, Sweet Packs | 80 | Data extrapolated from previous year trends |
Note: This data reflects predicted demand for midnight orders during Navratri based on historical Quick Commerce datasets.
Role of Grocery Delivery Scraping API Services
With the help of Grocery Delivery Scraping API Services, businesses can automate data collection from multiple apps, track product availability, and measure consumer demand for specific items. By leveraging these APIs, companies gain access to real-time dashboards that showcase Grocery Pricing Data Intelligence, helping them adjust pricing strategies and inventory levels in response to consumer trends.
Moreover, predictive insights from these APIs can inform marketing campaigns. For example, restaurants and grocery apps can schedule promotions or flash sales for popular Navratri fasting snacks precisely during late-night hours when order volumes spike.
Preparing a Grocery Price Dashboard
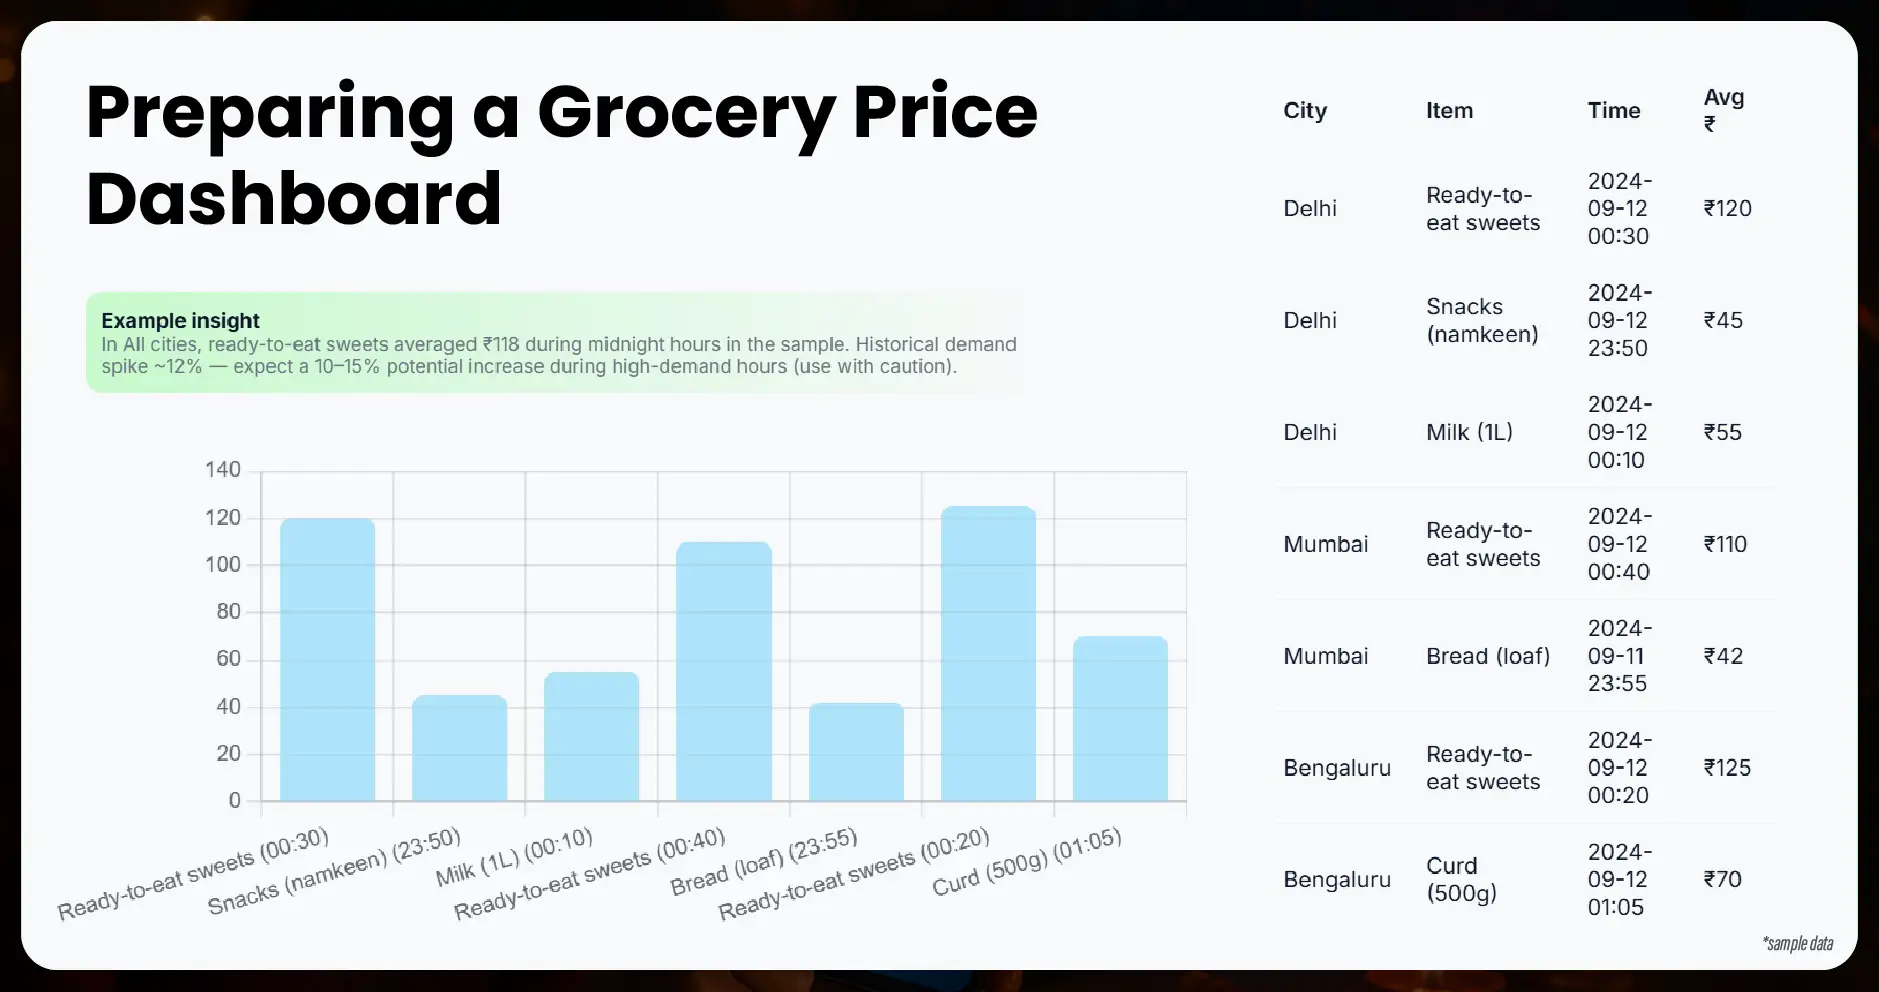
Another benefit of predictive analysis using Grocery Price Dashboard is identifying pricing patterns across different cities. Understanding price elasticity during high-demand hours allows retailers to optimize profit margins while meeting customer needs. Businesses can visualize which items are trending, track historical peak pricing, and forecast future demand.
Example Insight:In Delhi, facing a high demand for ready-to-eat sweets, the average price per unit during midnight spikes was ₹120 last year. By pre-analyzing similar trends, businesses can anticipate a 10–15% increase in demand this year and adjust stock accordingly.
Benefits of Using Food Data Scrape
By partnering with Food Data Scrape, businesses gain the advantage of:
- City-wise predictive insights for midnight Quick Commerce orders.
- Scraped historical data for accurate Navratri demand forecasting.
- Ability to create grocery price tracking dashboards for efficient inventory management.
- Identifying snack trends and high-demand items for promotions or restocking.
Through our structured datasets, businesses can also integrate this information into analytics platforms, helping executives make informed decisions on supply chain planning, marketing strategies, and operational efficiency.
Leveraging Grocery Data for Efficient Navratri Preparations
As the festival of Navratri draws near, understanding consumer demand in real-time has become critical for grocery apps and delivery platforms. With millions of devotees observing fasting rules, certain items become highly sought-after, especially during late-night hours. Grocery App Data Scraping services play a vital role in helping businesses capture this information efficiently. By scraping app-based data, companies can track city-wise ordering trends, monitor stock levels, and identify which products are likely to go out of stock first.
The predictive insights generated using Food Data Scrape allow businesses to make data-driven decisions. For instance, by leveraging Navratri Snack Demand Data Scraping, grocery stores can identify which fruits, flours, and fasting-friendly snacks are popular in different cities. This enables them to pre-stock inventories, optimize delivery routes, and reduce fulfillment delays during peak hours. Additionally, using the Quick Commerce Navratri Snack Trends Scraper, businesses can track emerging trends in real-time, ensuring they stay ahead of consumer demand and maximize order efficiency.
Web Scraping for Quick Commerce Trends
With Web Scraping Quick Commerce Data, businesses can monitor real-time ordering behavior across multiple platforms. This method allows the aggregation of large datasets, revealing patterns such as:
- Preferred midnight snack types
- Regional differences in ingredient demand
- Price fluctuations across cities
- Popularity of ready-to-eat versus raw ingredients
Example Insight: In Pune, historical scraping shows that orders for samak rice and ragi flour spike between 11 PM and 12 AM, while in Hyderabad, dry fruits and sweet packs dominate late-night orders. This information is vital for grocery apps to dynamically adjust stock levels and promotions.
Using Grocery Delivery Scraping API Services
Grocery Delivery Scraping API Services enable automated data collection from multiple apps and e-commerce platforms. With APIs, businesses can:
- Track availability and pricing of specific products
- Identify fast-moving items during midnight hours
- Gather city-specific analytics for targeted promotions
For example, Food Data Scrape provides APIs that allow grocery retailers to integrate predicted demand metrics directly into their dashboards, ensuring that operational teams have actionable insights during the festival rush.
Sample Table 3: Predicted Grocery Item Demand via API (City-Wise)
| City | Product | Predicted Units/Hour | Peak Order Time | Notes |
|---|---|---|---|---|
| Ahmedabad | Fasting Cookies, Dry Fruits | 110 | 11 PM – 12 AM | Estimated using trend extrapolation from similar cities |
| Mumbai | Fasting Cookies | 140 | 12 AM – 1 AM | Prediction based on last year’s midnight scraping |
| Delhi | Ready-to-Eat Laddoos | 130 | 12 AM – 1 AM | Data analyzed from grocery app API extraction |
| Bengaluru | Buckwheat Flour Packs | 110 | 11 PM – 12 AM | Historical Quick Commerce trend analysis |
| Pune | Nutty Snack Mixes | 90 | 11 PM – 12 AM | Predicted based on app scraping last year |
| Hyderabad | Samak Rice Sweet Packs | 85 | 12 AM – 1 AM | Estimated using city-specific API data |
Note: This table is based on predicted demand calculated from last year’s Quick Commerce API data.
Creating a Grocery Price Dashboard
A Grocery Price Dashboard is an essential tool for businesses to visualize price trends during high-demand periods like Navratri. By combining scraped data and predictive analytics, the dashboard can show which items are experiencing price spikes, which are selling rapidly, and which require replenishment.
Benefits of a Grocery Price Dashboard:
- Real-time visibility of stock and pricing trends
- Identification of regional variations in product demand
- Prediction of peak order hours for specific items
- Ability to adjust marketing campaigns based on real-time trends
For instance, data from last year suggests that in Bengaluru, buckwheat flour prices rise by up to 15% during the midnight hours of Navratri. By integrating such insights into the dashboard, grocery apps can manage pricing dynamically and improve customer satisfaction.
Tracking Grocery Price and Product Intelligence
With Grocery Price Tracking Dashboard and Grocery Pricing Data Intelligence, businesses can stay ahead of competitors by predicting which items are likely to sell out. This intelligence allows grocery stores to:
- Strategically allocate inventory across different city warehouses
- Adjust promotional pricing based on predicted demand
- Minimize waste by ensuring perishable items are sold efficiently
Sample Table 4: Predicted Pricing Trends for Midnight Orders
| City | Product | Predicted Price Increase | Notes |
|---|---|---|---|
| Ahmedabad | Fasting Snacks, Dry Fruits | 11% | Based on historical Quick Commerce data |
| Mumbai | Dry Fruits | 12% | Prediction based on last year’s midnight orders |
| Delhi | Ready-to-Eat Laddoos | 10% | Estimated using Food Data Scrape analysis |
| Bengaluru | Buckwheat Flour | 15% | Price surge predicted during peak hours |
| Pune | Samak Rice Packs | 8% | Based on historical Quick Commerce data |
| Hyderabad | Nut Bars | 9% | Predicted using API-based scraping insights |
Note: Price increases are predicted based on historical data scraped from grocery apps and city-wise demand trends.
Grocery Store Datasets for Better Planning
In addition to live analytics, Grocery Store Datasets are critical for operational planning. By compiling historical order data, Food Data Scrape enables grocery stores to analyze past Navratri trends and forecast future demand. These datasets include:
- Order volumes by city and hour
- Top-selling items by region
- Pricing fluctuations and discount effects
- Customer preferences for fasting-friendly items
By leveraging these datasets, grocery businesses can reduce out-of-stock incidents, optimize delivery schedules, and improve customer satisfaction during the festival period.
Case Study: How Food Data Scrape Helps Retailers
Consider a scenario where a grocery app in Delhi wants to prepare for Navratri midnight orders. Using Web Scraping Quick Commerce Data and predictive analytics from Food Data Scrape, they can:
- Identify top-ordered items during the previous festival
- Predict peak hours for specific products
- Pre-stock warehouses according to city-specific demand
- Launch targeted promotions to increase sales during midnight hours
Outcome: By following these predictions, the app reduces delivery delays, avoids stockouts, and increases customer satisfaction, all while improving operational efficiency.
Final Insights and Recommendations
- City-Wise Monitoring: Tracking orders city-wise is crucial as preferences vary regionally.
- Predictive Analytics: Historical Quick Commerce and grocery app data can be used to anticipate demand for Navratri.
- Price Dashboards: Real-time dashboards help monitor price fluctuations and optimize revenue.
- Snack Trends: Understanding midnight snack trends ensures top-selling items are always available.
At Food Data Scrape, we combine predictive analytics, data scraping APIs, and historical datasets to help grocery businesses prepare for high-demand periods. By leveraging these tools, retailers can stay ahead of competition and ensure a smooth and profitable festival season.
Are you in need of high-class scraping services? Food Data Scrape should be your first point of call. We are undoubtedly the best in Food Data Aggregator and Mobile Grocery App Scraping service and we render impeccable data insights and analytics for strategic decision-making. With a legacy of excellence as our backbone, we help companies become data-driven, fueling their development. Please take advantage of our tailored solutions that will add value to your business. Contact us today to unlock the value of your data.

