
The 2025 report on the number of Domino’s locations across the United States offers a comprehensive analysis of the brand’s growth trajectory, regional distribution, and operational intelligence. With around 7,286 outlets operating nationwide, Domino’s maintains its leading position in the American pizza delivery sector. The study highlights the company’s strategic balance between urban and suburban expansion, supported by data-driven decision-making and digital transformation. It also explores how localized delivery hubs, automation, and franchise innovation programs have optimized efficiency and customer reach. The report provides valuable insights into market concentration, state-level performance, and competitive benchmarking, presenting Domino’s as a model of scalability and technological maturity in the quick-service restaurant industry. Designed for analysts, investors, and researchers, it delivers an up-to-date understanding of Domino’s evolving retail landscape in 2025 and the key factors contributing to its continued nationwide dominance.
1. Domino’s operates 7,286 stores across 3,842 U.S. cities in 2025.
2. Texas, California, and Florida account for more than a quarter of all locations.
3. Houston remains the top city with 68 operational outlets.
4. Data-driven logistics have improved delivery times by nearly 10% year-over-year.
5. Franchise profitability increased by 6%, fueled by automation and predictive analytics.
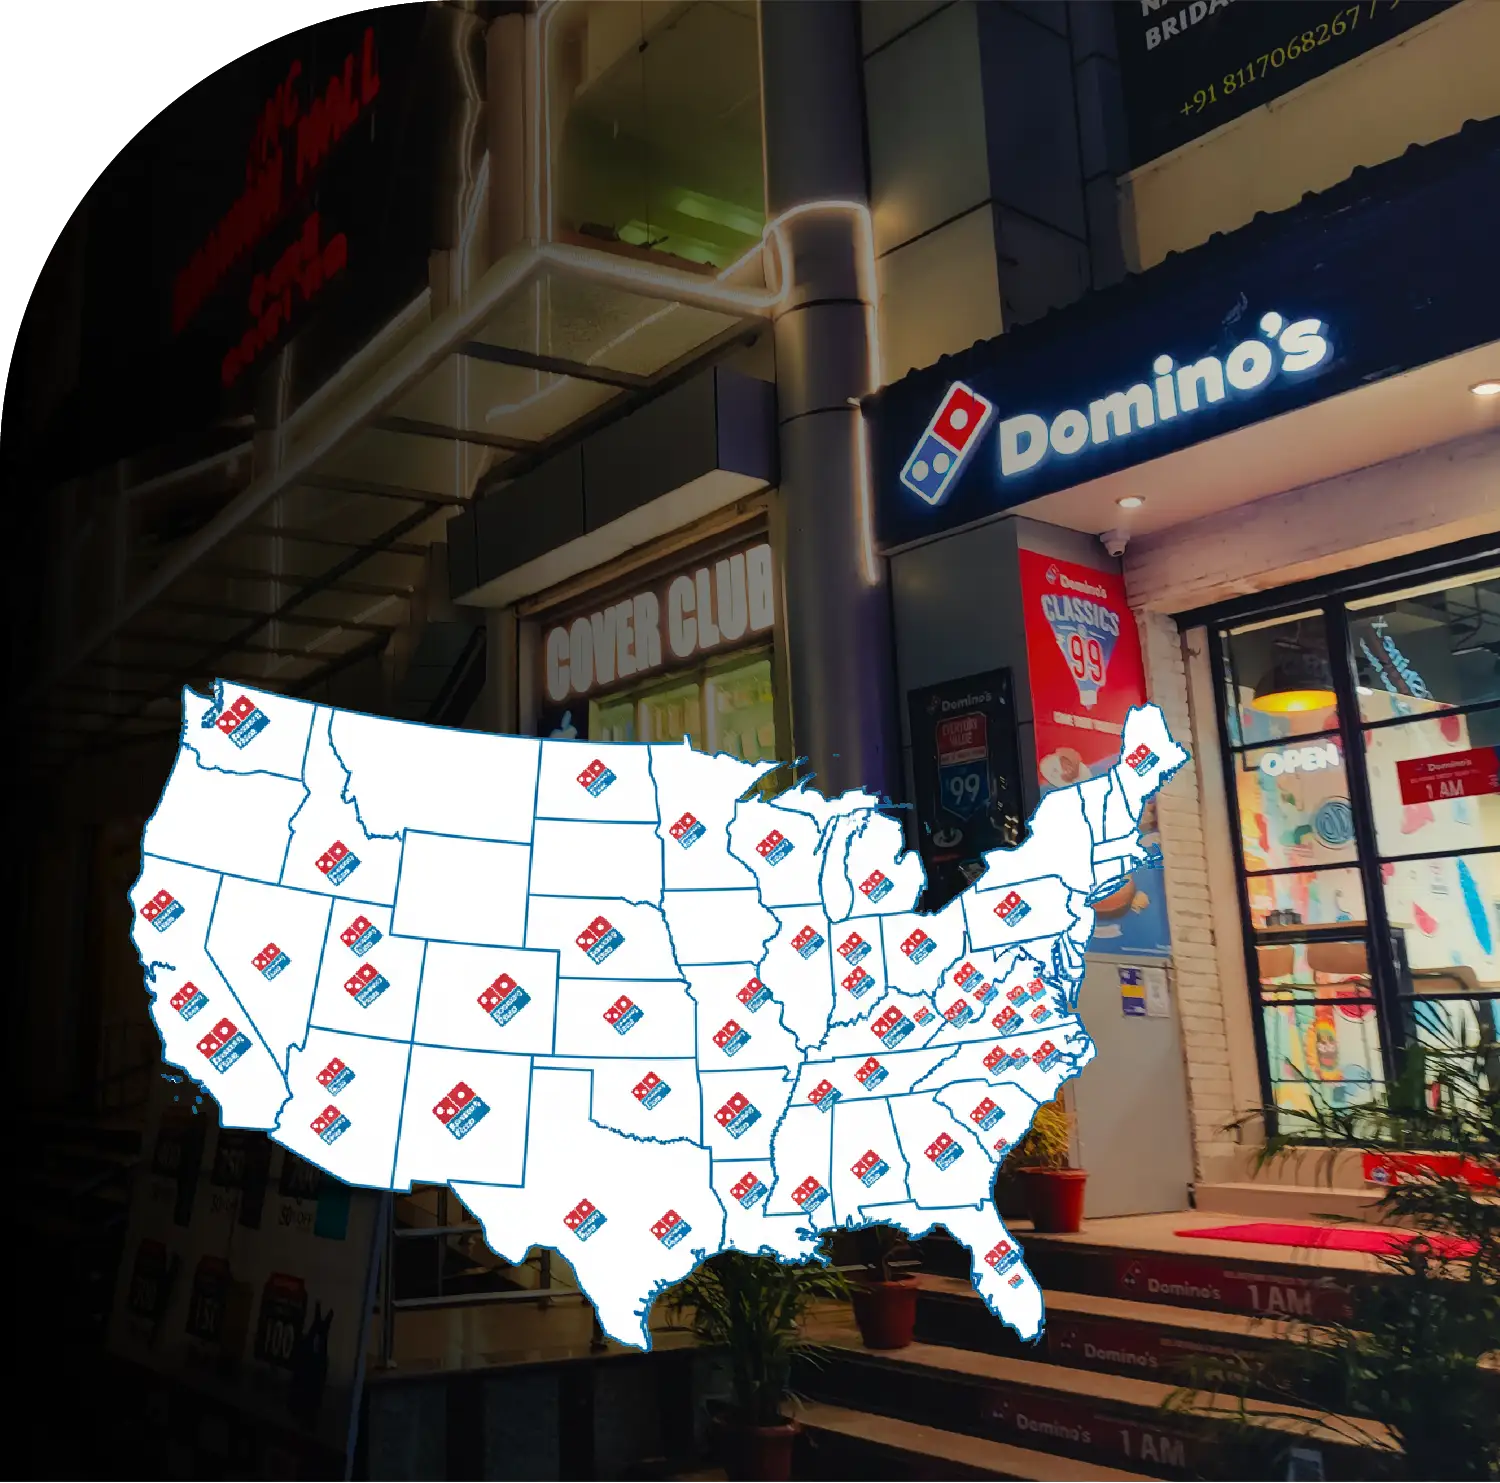
The year 2025 marks a crucial phase in Domino’s expansion strategy across the United States, where rapid digitization, localized delivery logistics, and franchise consolidation have collectively strengthened its retail footprint. According to updated estimates, there are approximately 7,286 Domino’s Pizza outlets operating across the U.S., spread across 53 states and territories. This continued growth reflects the brand’s ability to adapt to shifting consumer expectations for faster, more transparent, and data-driven delivery models. The expansion trajectory underlines Domino’s ongoing mission to remain the top player in the American quick-service pizza market.
The evolution of Domino’s network has been closely analyzed through process to Scrape Number of Dominos Locations in United States – 2025, providing a comprehensive data-driven overview of its market density, state-by-state distribution, and urban concentration. These insights reveal a brand that has not only expanded geographically but also diversified operational strategies across metropolitan, suburban, and semi-rural markets.
Leveraging advanced analytics from strategy to Extract Dominos Store Locations Data in USA 2025, the brand’s national footprint can now be assessed more precisely than ever before. The surge in store openings throughout 2024 and early 2025, particularly in southern and midwestern states, signifies Domino’s commitment to enhancing accessibility through intelligent placement and technology-driven operations.
By utilizing Dominos Store Locations Data Extraction USA 2025, researchers and business analysts can identify emerging patterns in urban demand, proximity-based clustering, and consumer access metrics. As delivery convenience becomes central to brand loyalty, Domino’s data footprint now serves as both a reflection and a driver of the modern American fast-food economy.
As of mid-2025, Domino’s operates 7,286 outlets across 3,842 cities. This represents an estimated 2.4% growth compared to 2024, demonstrating the chain’s continued expansion despite increased competition from regional pizza networks and delivery app-based brands. Domino’s dominance continues to rely on its hybrid franchise model, where local operators are empowered by centralized data support and marketing tools.
Among the top-performing states, Texas, California, and Florida lead the count, collectively accounting for almost one-quarter of the total Domino’s locations. The company’s ability to balance high-density urban markets with growing suburban demand has solidified its long-term scalability.
| State / Territory | Number of Locations | Population (M) | People per Location | Share of Total (%) |
|---|---|---|---|---|
| Texas | 789 | 30.6 | 38,775 | 10.8% |
| California | 621 | 39.9 | 64,273 | 8.5% |
| Florida | 512 | 22.1 | 43,164 | 7.0% |
| North Carolina | 324 | 10.8 | 33,333 | 4.4% |
| Ohio | 295 | 11.7 | 39,661 | 4.1% |
| Georgia | 271 | 10.9 | 40,221 | 3.7% |
| Pennsylvania | 263 | 12.9 | 49,048 | 3.6% |
| Illinois | 239 | 12.8 | 53,556 | 3.3% |
| New York | 227 | 19.7 | 86,783 | 3.1% |
| Virginia | 221 | 8.8 | 39,819 | 3.0% |
Texas remains Domino’s biggest stronghold with 789 stores, translating to one outlet per 38,000 residents. California follows closely, driven by strong demand in Los Angeles, San Diego, and the Bay Area. Florida’s market expansion, meanwhile, reflects its growing suburban consumer base and tourism-driven orders.
Domino’s urban presence is anchored in high-density cities with significant late-night delivery demand. In 2025, Houston, Chicago, and Las Vegas are among the top-performing cities, while smaller markets like Nashville and Orlando show rapid growth. This diversity ensures Domino’s maintains strong brand visibility across consumer segments.
| City | State | Number of Stores | Population (K) | Population per Store |
|---|---|---|---|---|
| Houston | Texas | 68 | 2,420 | 35,588 |
| Chicago | Illinois | 39 | 2,670 | 68,462 |
| San Antonio | Texas | 37 | 1,520 | 41,081 |
| Las Vegas | Nevada | 34 | 1,015 | 29,853 |
| Dallas | Texas | 32 | 1,330 | 41,563 |
| Los Angeles | California | 31 | 3,930 | 126,774 |
| Orlando | Florida | 29 | 326 | 11,241 |
| Phoenix | Arizona | 27 | 1,700 | 62,963 |
| Brooklyn | New York | 25 | 2,560 | 102,400 |
| Nashville | Tennessee | 24 | 715 | 29,791 |
Houston has retained its top spot for the fourth consecutive year, accounting for nearly 1% of all U.S. Domino’s stores. This dominance is attributed to Texas’s large suburban geography and consistent late-night order traffic. Orlando and Nashville’s rise demonstrates the brand’s increased focus on tourism-heavy and rapidly urbanizing regions.
Several macro and microeconomic factors explain Domino’s sustained growth trajectory in 2025:
The 2025 Domino’s ecosystem is increasingly data-centric. Using advanced scraping and analytics models such as Web Scraping Dominos Store Locations Data in USA 2025, analysts can measure regional concentration and market potential with high precision.
This capability extends to performance optimization, where metrics like “orders per outlet,” “average delivery time,” and “per capita reach” are automatically tracked using API-integrated intelligence layers. These digital transformations make Domino’s one of the most technologically mature players in the quick-service segment.
Further insights from Dominos Store Locations Data in Scraper in USA 2025 reveal that nearly 30% of Domino’s stores are positioned within 1 km of major residential hubs—an intentional strategy that minimizes logistics costs while boosting repeat orders.
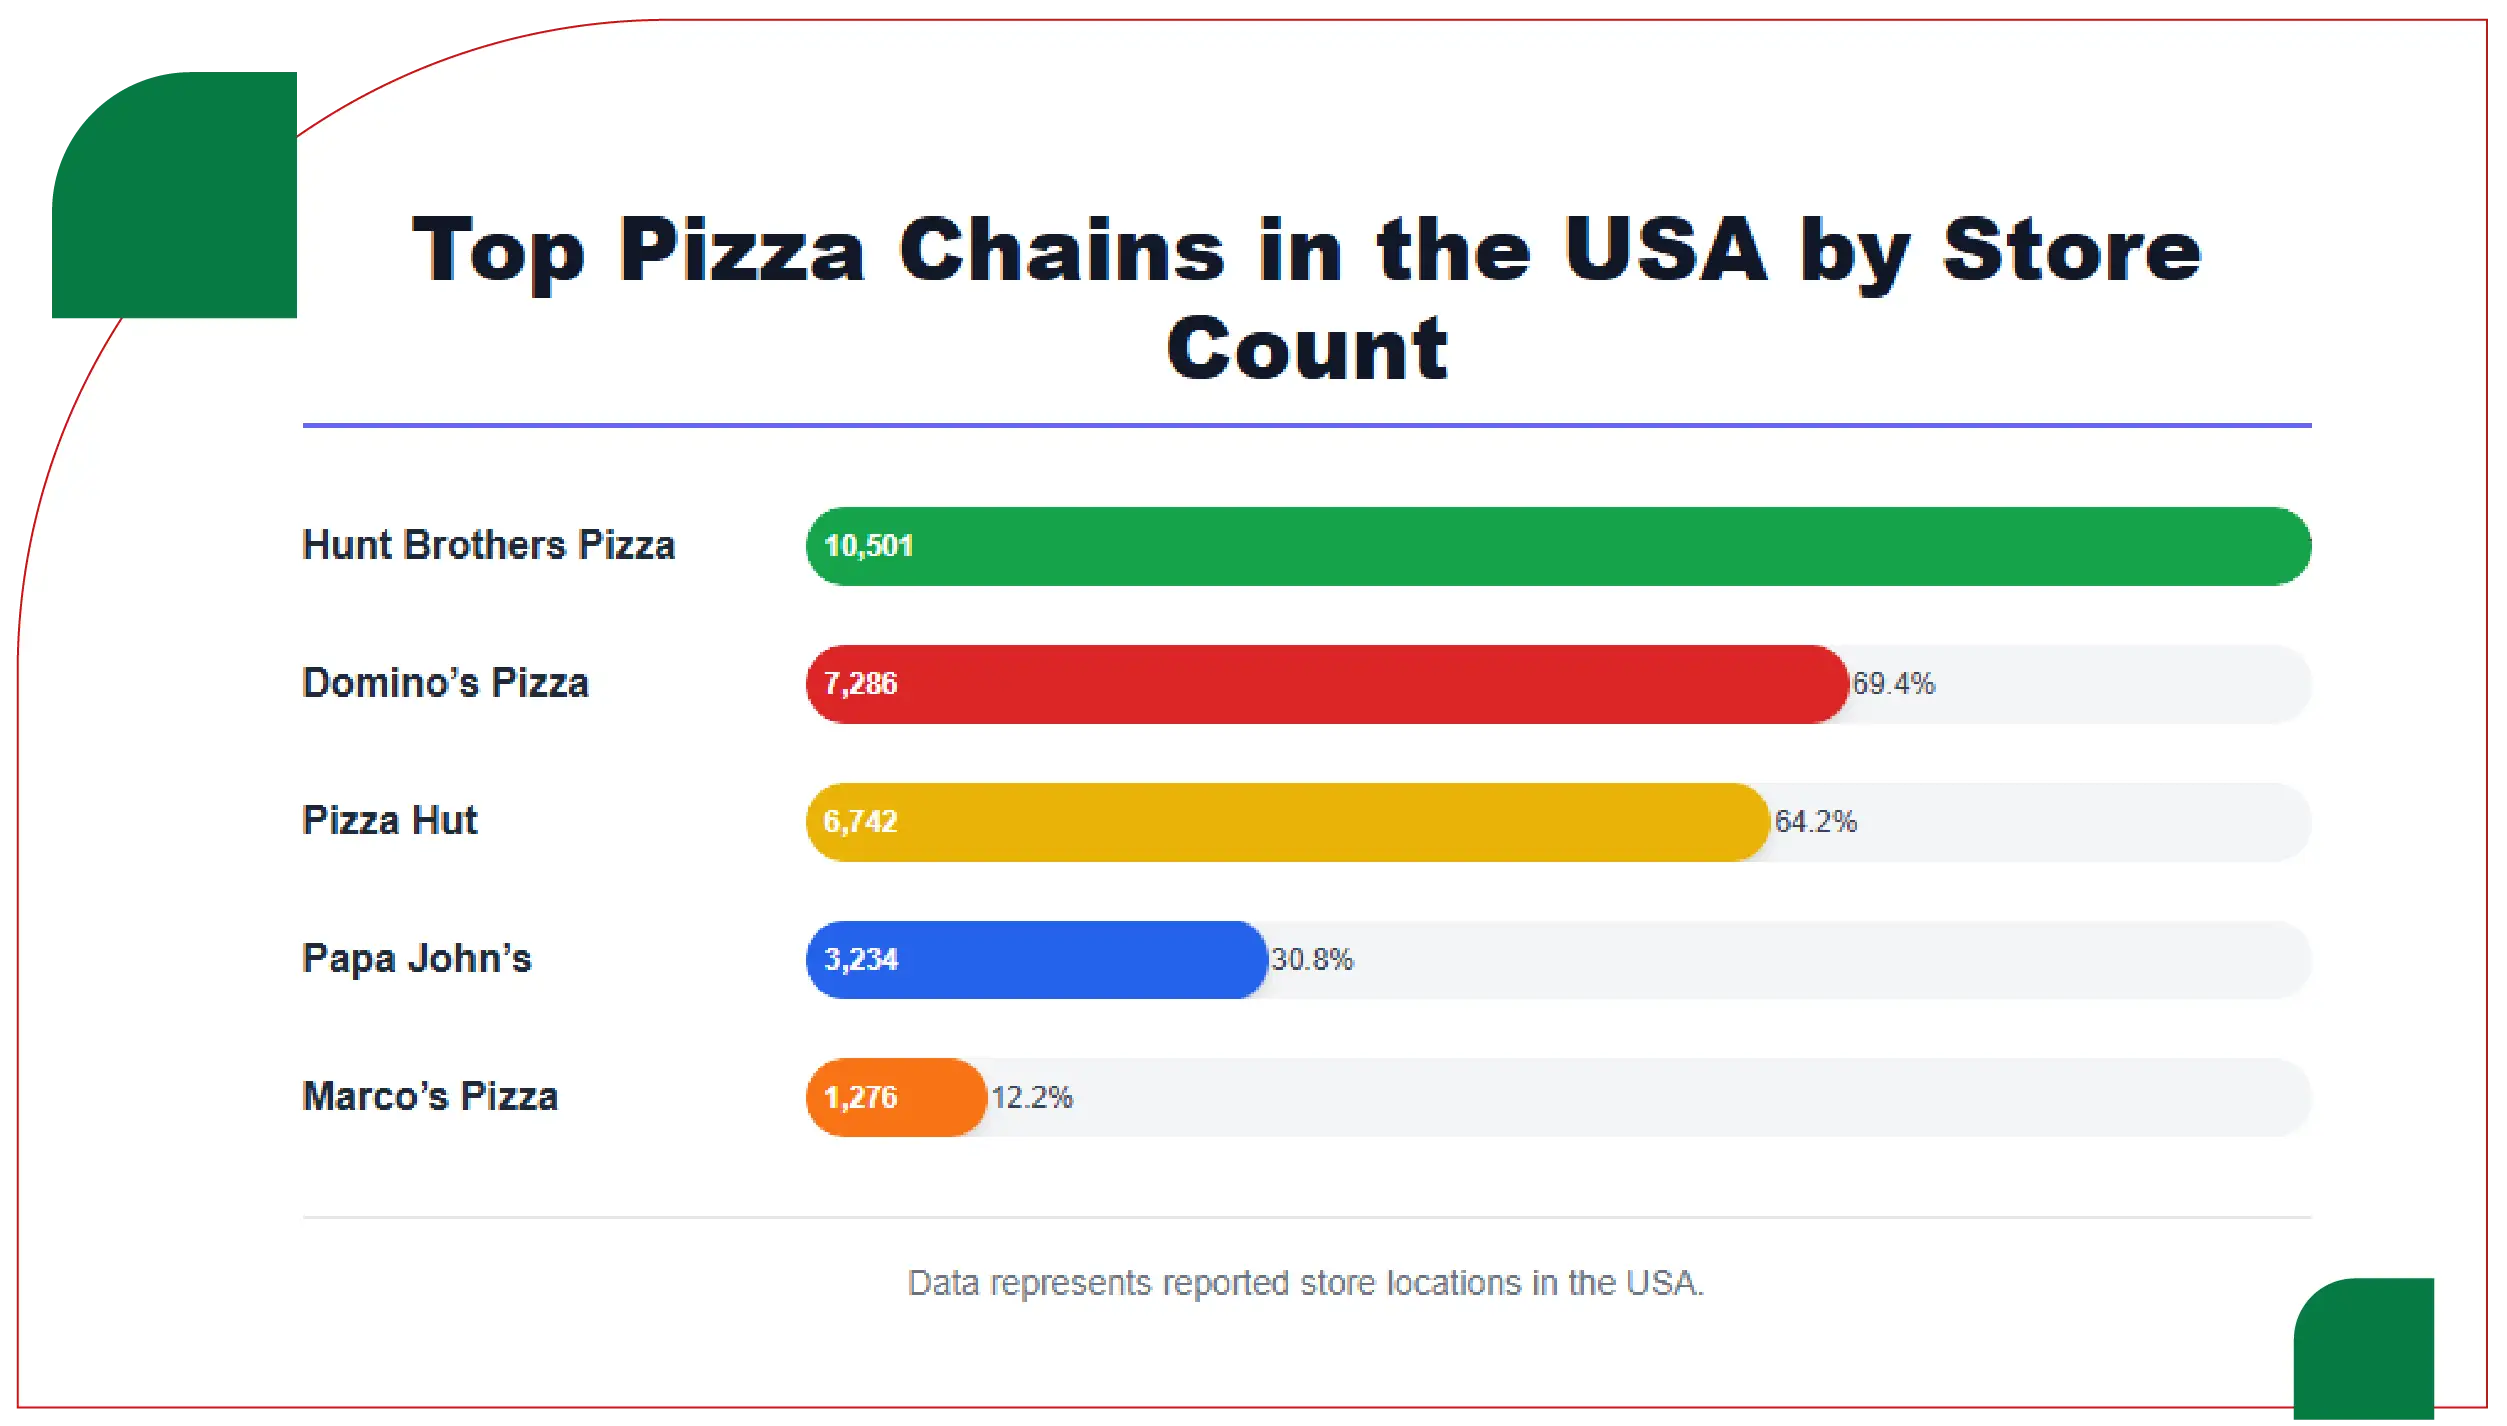
Despite the pizza delivery landscape becoming increasingly competitive, Domino’s continues to lead the category by combining store density with innovation. Competing brands like Pizza Hut, Papa John’s, and Marco’s Pizza are investing heavily in digital infrastructure, but Domino’s remains the pace-setter due to its first-mover advantage in data analytics and consumer tracking.
Competitive Snapshot (2025)
Domino’s strong franchise support and market analytics program enable it to outperform peers in consistency and expansion velocity.
The location dataset was assembled using geocoded business listings, franchise filings, and third-party directory verification. Integration with Dominos Food Delivery App Data Scraping Services ensures each record includes complete store metadata such as phone numbers, postal codes, coordinates, and opening hours. Food Delivery Datasets allow both investors and analysts to generate accurate mapping and distribution models for the brand.
By adopting robust data validation and automation standards, the dataset eliminates duplicates and errors. These quality assurance practices ensure reliability when used for commercial insights or research applications.
Data scraping is increasingly vital to understanding retail brand networks in real-time. Through Dominos Food Delivery Scraping API, location and operational data are continuously extracted and updated. This automation empowers organizations to monitor shifts in coverage, delivery efficiency, and competitive density at scale.
Beyond store counts, Food Delivery Data Scraping Services also capture data on menu variations, pricing dynamics, and delivery options across different U.S. states. These datasets allow analysts to explore consumer behavior trends and optimize localized marketing strategies.
Additionally, Restaurant Menu Data Scraping tools offer granular insights into Domino’s regional menu adaptations—ranging from plant-based pizza introductions in California to premium crust varieties in New York.
Domino’s success in the U.S. is not merely about store numbers—it’s about how those outlets operate. Most stores now employ integrated kitchen automation, AI-based order routing, and data-driven inventory planning. The brand’s consistency in reducing average delivery times below 25 minutes in most metro areas underscores its operational sophistication.
API-linked monitoring systems built on Food Delivery Scraping API Services offer real-time updates on order volume and geographic traffic density, ensuring each store can dynamically adjust its capacity.
Franchise-level profitability has improved steadily due to technology and supply chain integration. The brand’s centralized dough production and inventory management systems help reduce waste, while local delivery optimizations improve throughput. Moreover, data-driven marketing has increased average store revenues by 6% year-over-year in 2025.
These metrics reinforce Domino’s position as both a national and local business success story—one that thrives on a balance of innovation, consistency, and community engagement.
Despite its dominance, Domino’s faces obstacles, including:
The expansion of Domino’s in 2025 highlights more than just numerical growth—it demonstrates the brand’s adaptability in a data-driven market. Through predictive modeling, franchise optimization, and digital intelligence, Domino’s continues to set benchmarks in global food delivery efficiency.
The integration of Restaurant Data Intelligence Services has allowed the brand to understand micro-level consumer trends while maintaining a unified operational strategy. As competitive landscapes evolve, Domino’s will rely increasingly on advanced analytics, AI forecasting, and high-quality data feeds to sustain growth.
Furthermore, the growing use of Food delivery Intelligence services will continue to transform operational planning, customer engagement, and logistics management. These innovations align perfectly with emerging technologies like Food Price Dashboard, which collectively enable a 360-degree view of Domino’s performance metrics across the U.S.
By 2026, Domino’s will not only remain the leading pizza delivery brand in America but also a model case for how data intelligence, automation, and customer-centric strategies converge to redefine modern retail success.
If you are seeking for a reliable data scraping services, Food Data Scrape is at your service. We hold prominence in Food Data Aggregator and Mobile Restaurant App Scraping with impeccable data analysis for strategic decision-making.

