Introduction
The fast food landscape in the United States is marked by numerous brands vying for consumer attention, but few comparisons are as interesting as the one between Five Guys and Shake Shack. Both brands occupy the premium burger niche, yet the difference in scale and efficiency between them is striking. For analysts, marketers, and investors, understanding these differences requires structured data. This is where the need to Scrape Fast Food Chain Data - Five Guys vs Shake Shack becomes invaluable. Using reliable datasets, one can evaluate location spread, revenue performance, menu pricing, and delivery coverage, providing insights that go far beyond surface-level observations.
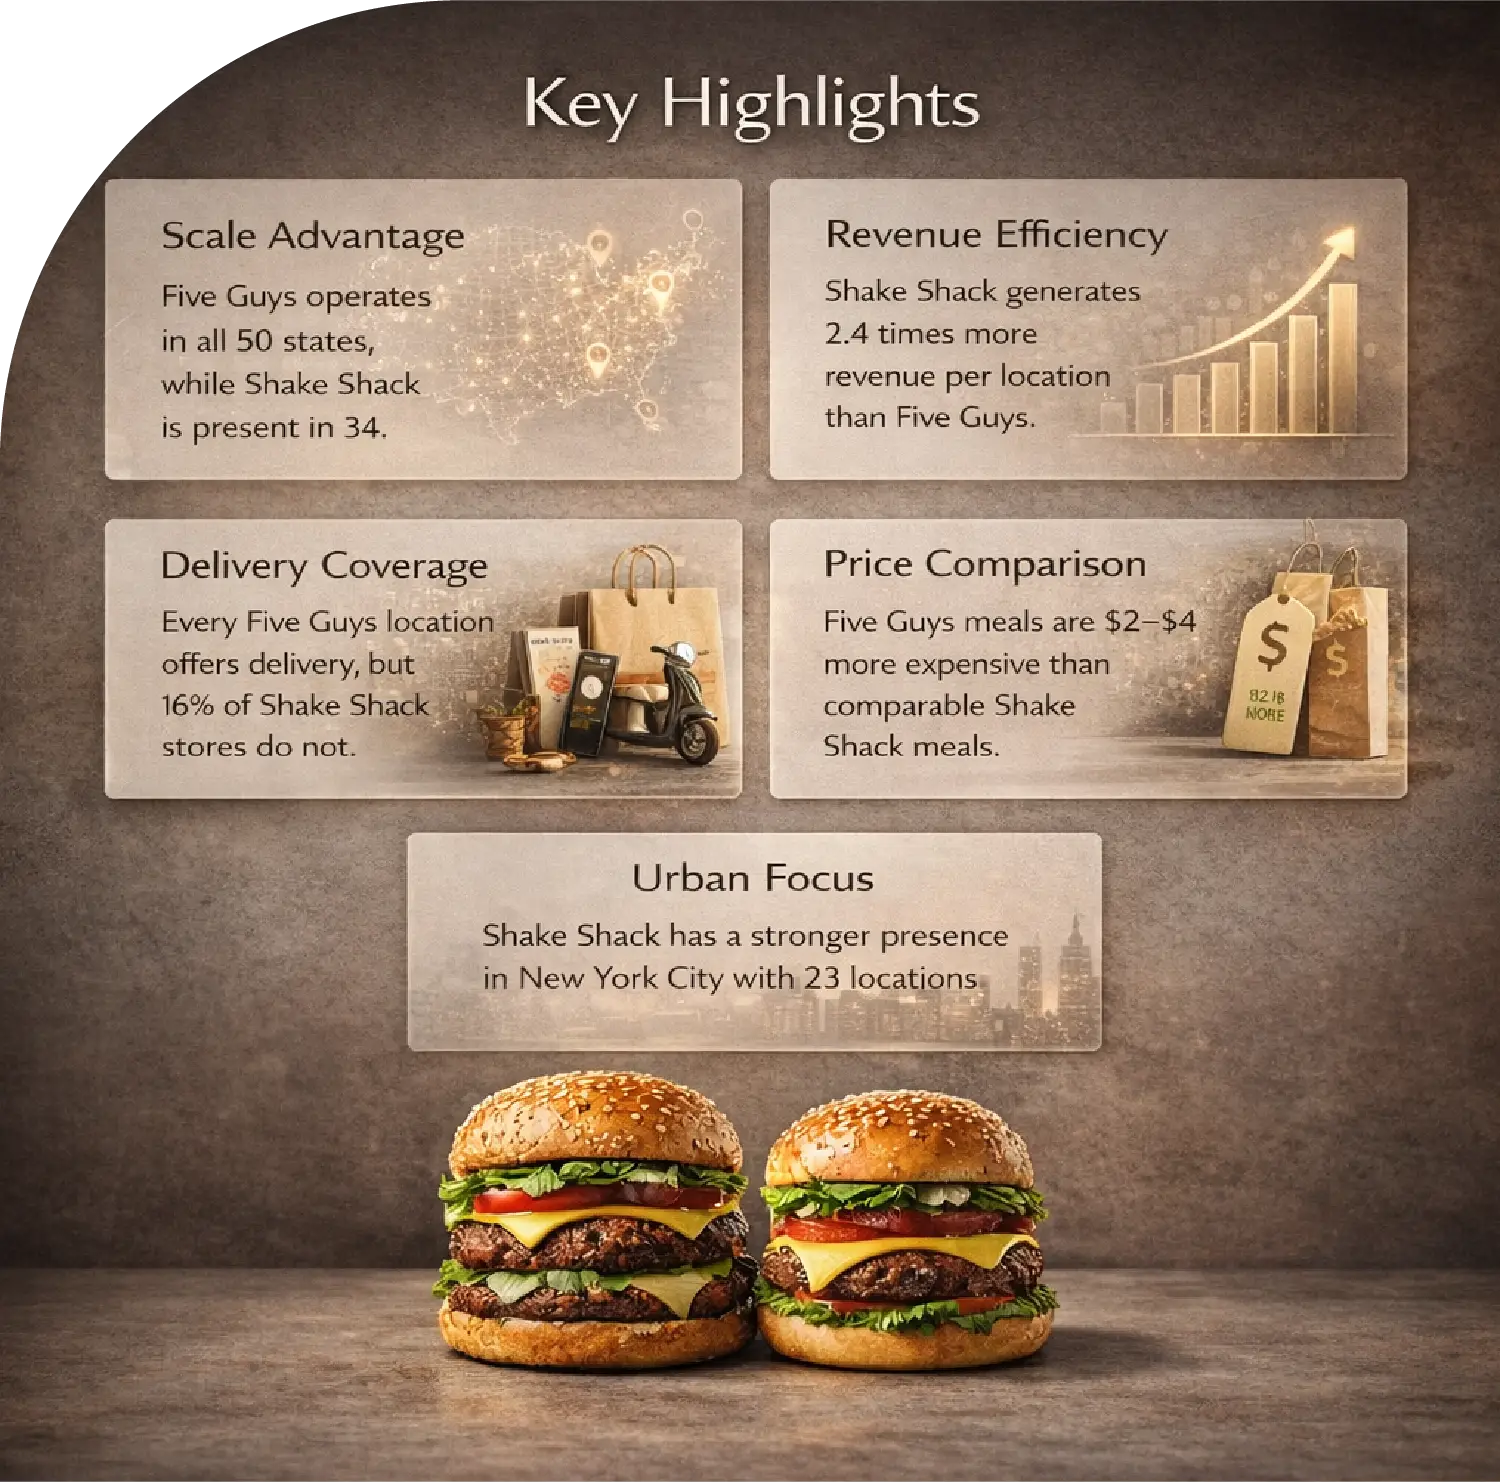
To start, Five Guys vs Shake Shack Fast Food Data Scraping allows us to explore the true size of each brand’s footprint. Five Guys operates in all 50 states with 1,508 locations across 1,085 cities. Shake Shack, in contrast, is present in 34 states with 371 locations across 244 cities. While Five Guys has a significantly larger network, Shake Shack demonstrates a far higher revenue per location. These insights can be verified by datasets obtained from competitive scraping exercises, which reveal the dynamics of the fast food market at both the national and city levels.
For analysts looking to perform a detailed market comparison, the strategy to Scrape Five Guys vs Shake Shack Food Market Data provides an opportunity to examine revenue patterns in relation to geographic distribution. Despite having over four times more locations, Five Guys generates only $2.4 billion in revenue compared to Shake Shack’s $1.4 billion. The difference in per-location revenue is telling: Shake Shack earns approximately $3.8 million per store, while Five Guys averages around $1.6 million. Understanding these figures is critical for evaluating operational efficiency, pricing strategy, and growth potential.
Location Analysis: Where Scale Meets Strategy
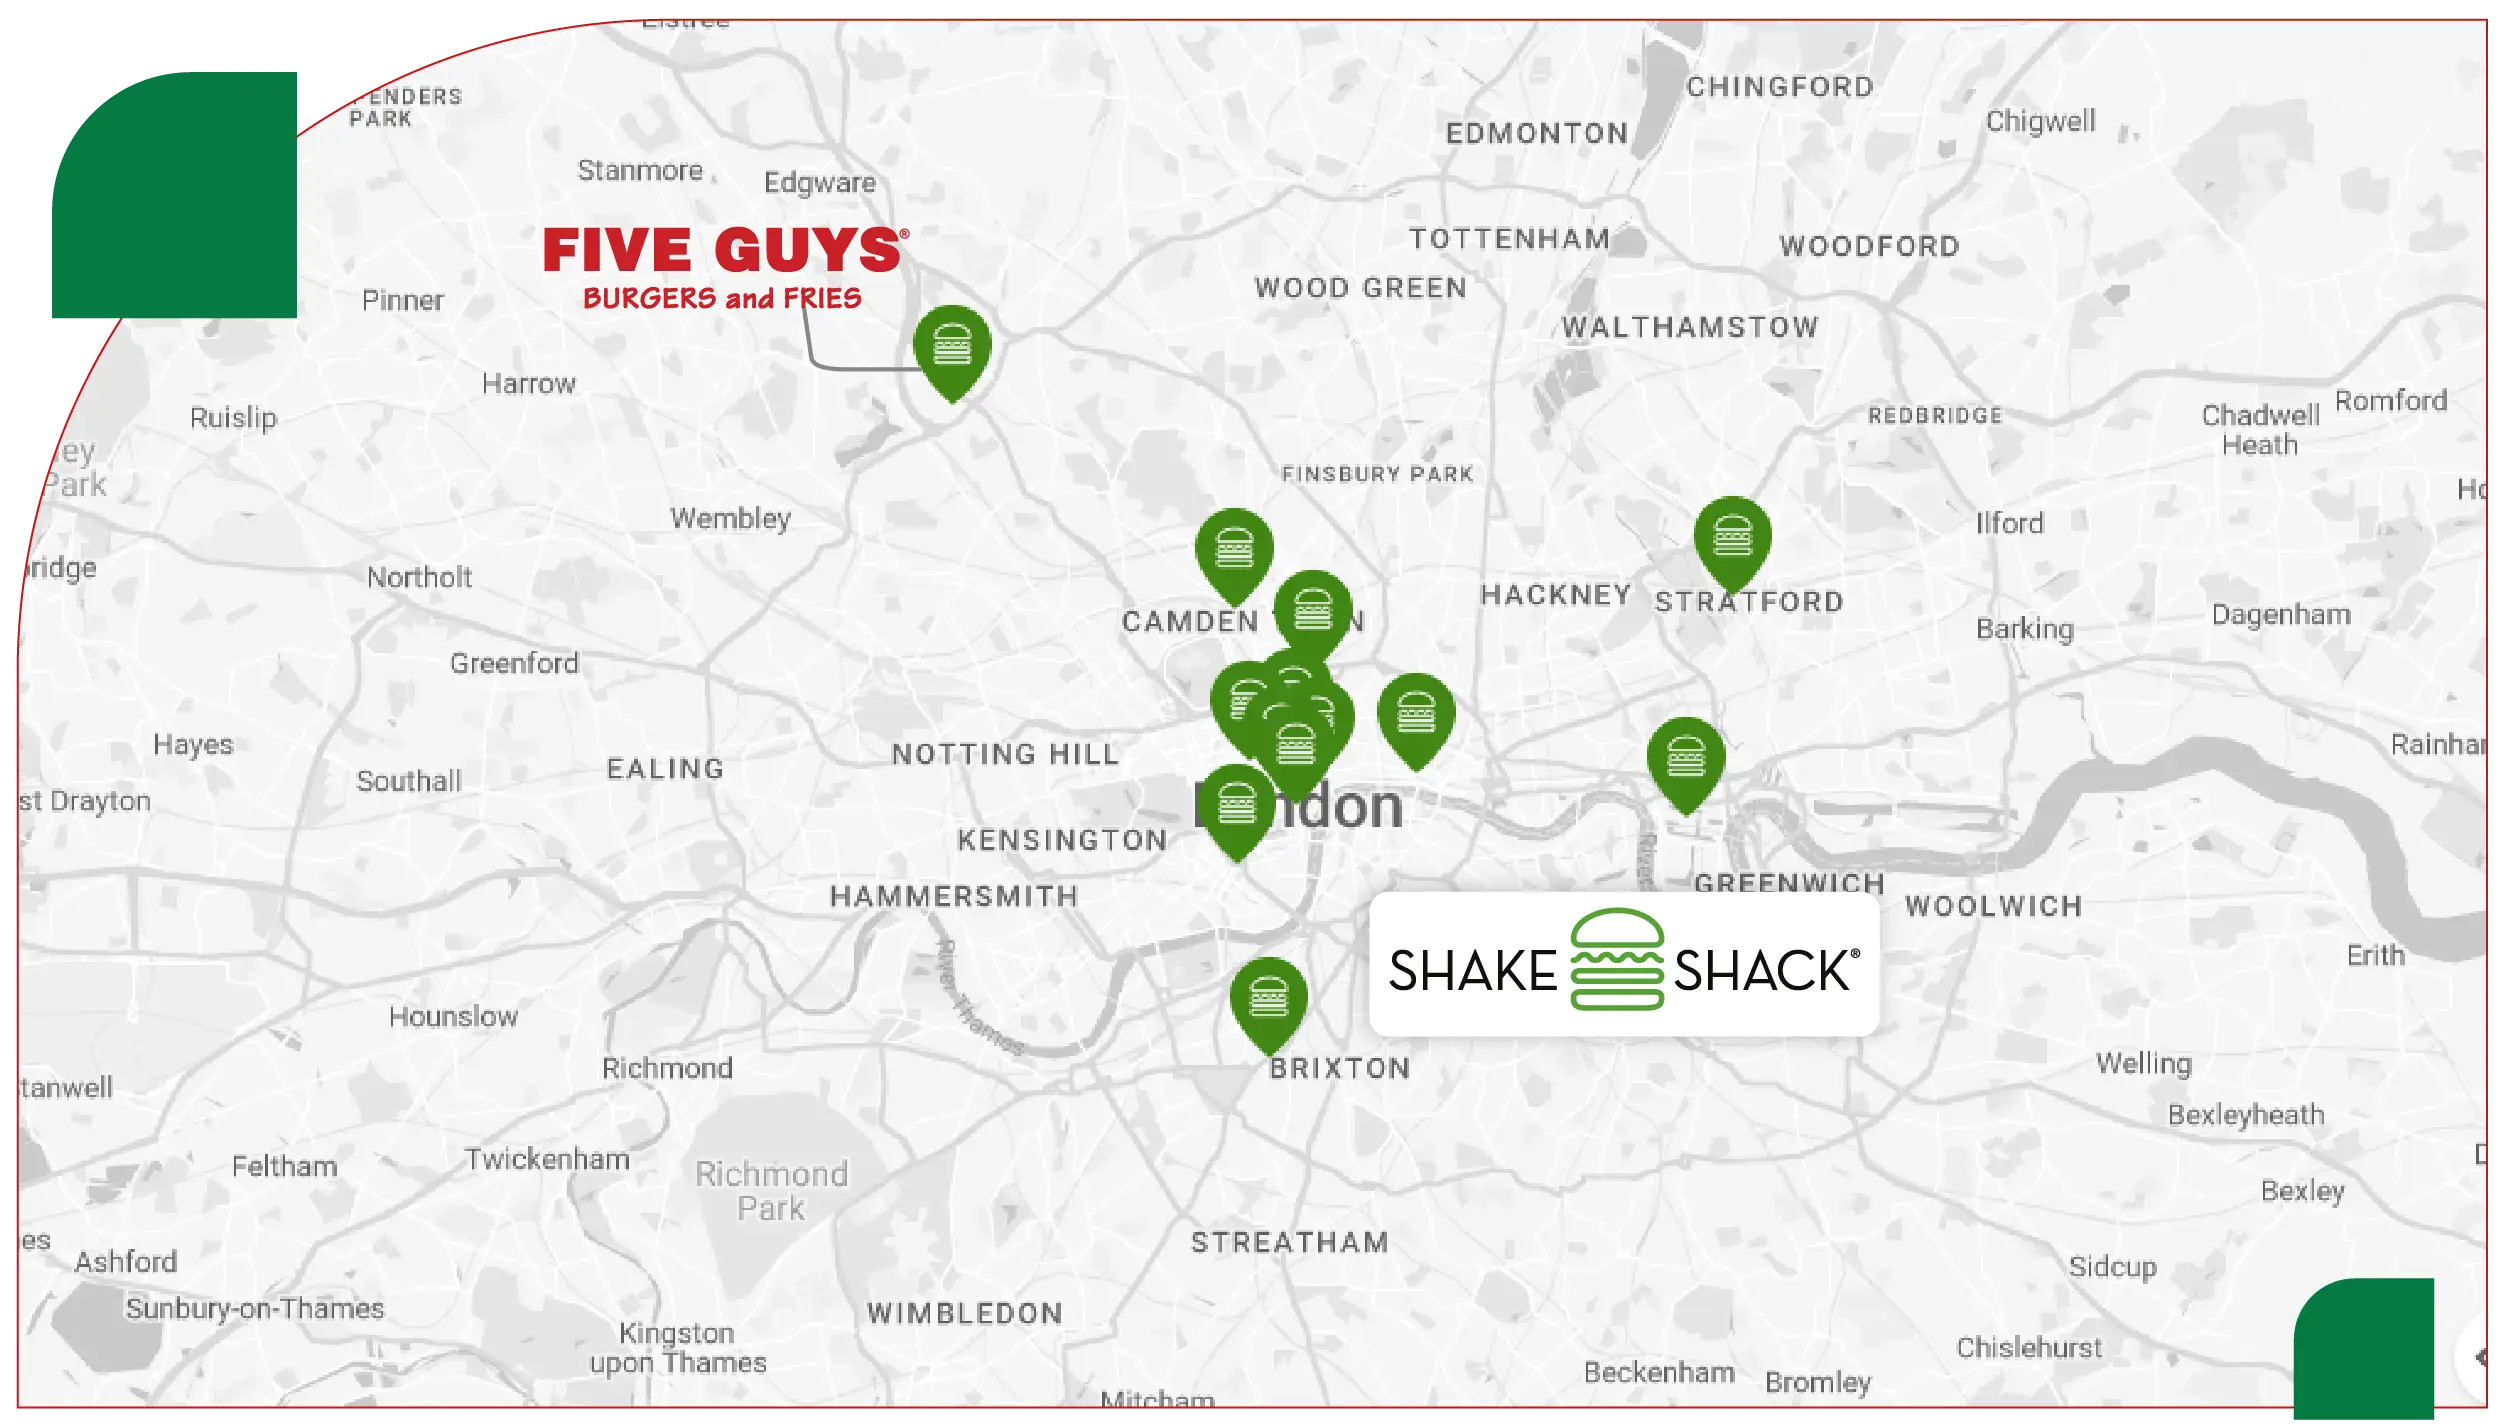
Using methods to Extract Five Guys vs Shake Shack Fast Food Data, it becomes clear that Five Guys’ strategy emphasizes scale. Their presence in all 50 states ensures that almost any U.S. consumer has access to their stores. In comparison, Shake Shack is absent from 16 states, creating pockets of opportunity for expansion. City-level data further highlights the gap: Five Guys is present in 1,085 cities, whereas Shake Shack operates in 244.
Interestingly, there is only one city where Shake Shack surpasses Five Guys in store count: New York City. With 23 locations compared to Five Guys’ 14, Shake Shack dominates in its original home market. This indicates a strategic focus on high-traffic, urban locations where brand presence translates directly into revenue per store. Utilizing a Burger Data Scraper from Five Guys vs Shake Shack allows analysts to map this presence accurately, identifying regions of under-penetration and high opportunity for both chains.
Revenue and Pricing Insights
One of the most revealing aspects of the comparison is revenue per location. The disparity between Five Guys and Shake Shack illustrates that a larger network does not always equate to greater efficiency. Despite its higher meal prices — $15-$17 for a cheeseburger meal compared to Shake Shack’s $13-$15 ShackBurger combo — Five Guys’ revenue per store remains lower. Structured data obtained through Restaurant Pricing Data Scraper for Five Guys & Shake Shack helps quantify this difference and evaluate the impact of pricing on customer behavior.
Both brands offer comparable meals including a burger, fries, and a drink, yet Shake Shack generates higher revenue per location. The Five Guys Menu and Price Dataset provides detailed insights into menu composition and pricing across different states. Similarly, the Shake Shack Menu and Price Dataset allows analysts to understand pricing variations and consumer preferences. These datasets together enable a deeper understanding of value perception and purchasing behavior at each brand’s locations.
Table 1: US Locations, States, and Revenue
| State |
Five Guys Locations |
Shake Shack Locations |
Five Guys Cities |
Shake Shack Cities |
Revenue Per Location ($M) |
| California |
119 |
49 |
90 |
40 |
1.6 / 3.8 |
| Florida |
127 |
24 |
90 |
20 |
1.6 / 3.8 |
| New York |
92 |
56 |
70 |
50 |
1.6 / 3.8 |
| Texas |
78 |
28 |
60 |
25 |
1.6 / 3.8 |
| New Jersey |
70 |
26 |
55 |
22 |
1.6 / 3.8 |
| Illinois |
80 |
18 |
65 |
15 |
1.6 / 3.8 |
| Pennsylvania |
80 |
22 |
65 |
20 |
1.6 / 3.8 |
| Georgia |
60 |
22 |
45 |
20 |
1.6 / 3.8 |
| Massachusetts |
55 |
30 |
45 |
25 |
1.6 / 3.8 |
| Ohio |
75 |
12 |
60 |
10 |
1.6 / 3.8 |
Delivery Footprint: The Invisible Metric
In the modern fast food industry, delivery coverage plays a critical role in market reach and revenue potential. Using the Five Guys Food Delivery Scraping API, analysts can track delivery availability at all 1,508 locations. Similarly, the Shake Shack Food Delivery Scraping API shows that 16.4% of Shake Shack stores do not offer delivery.
This gap in coverage may affect online ordering behavior, customer convenience, and overall revenue per location. Analyzing delivery data helps businesses identify operational strengths, optimize service areas, and plan targeted expansion strategies.
Combining delivery data with Web Scraping Food Delivery Data provides actionable insights for analysts who want to track how delivery affects regional sales performance. Additionally, examining delivery availability across major metropolitan areas can inform expansion strategies, pricing decisions, and marketing campaigns.
Table 2: Delivery Coverage and Menu Pricing
| Brand |
Total Locations |
Delivery Coverage |
Avg. Meal Price ($) |
Top City |
Locations in Top City |
| Five Guys |
1,508 |
100% |
15–17 |
New York |
14 |
| Shake Shack |
371 |
83.6% |
13–15 |
New York |
23 |
Digital Engagement: A Secondary Frontier
Beyond physical presence and delivery, online performance is an increasingly important metric. Using tools to Extract Restaurant Menu Data from official websites and third-party platforms, analysts can assess web traffic, visitor engagement, and demographic distribution. Both Five Guys and Shake Shack attract predominantly younger audiences, with the 25–34 age group representing the largest share of visitors. Shake Shack slightly edges out in U.S. web traffic share at 86.85% compared to Five Guys’ 84.65%, though visitors spend more time per session on Five Guys’ website.
These findings, extracted via a Food Delivery Scraping API, highlight the importance of digital engagement in complementing physical presence. Understanding which age groups engage more with each brand online allows for targeted campaigns, menu personalization, and tailored promotions, adding another layer to competitive strategy.
How Data Scraping Informs Strategic Decisions?
For businesses, the value of structured data cannot be overstated. Using Restaurant Data Intelligence, analysts can evaluate expansion opportunities, optimize pricing strategies, and monitor competitor performance. Whether through mapping location density, tracking menu offerings, or assessing delivery coverage, insights derived from scraping operations provide actionable intelligence for decision-makers.
For example, comparing Five Guys’ and Shake Shack’s top states and cities using scraped datasets helps highlight patterns in urban versus suburban penetration, population density influence, and revenue concentration. A data-driven approach to Extract Five Guys vs Shake Shack Fast Food Data ensures strategic decisions are grounded in accurate, up-to-date information.
Operational Efficiency vs. Market Presence
The analysis highlights a classic business trade-off. Five Guys has built a vast network, with 4x more locations and coverage in every U.S. state. Shake Shack, by contrast, has fewer locations but higher revenue per store. Datasets obtained through Food Delivery Scraping API and Extract Restaurant Menu Data enable analysts to evaluate both efficiency and scale, offering a clearer picture of the operational dynamics at play.
By studying Five Guys’ menu datasets alongside Shake Shack’s, analysts can also examine which items contribute most to revenue per location. Insights from a Restaurant Pricing Data Scraper for Five Guys & Shake Shack can inform menu optimization, pricing adjustments, and promotional planning.
Conclusion: Two Paths, One Category
The Five Guys vs Shake Shack comparison illustrates two viable growth strategies within the same category. Five Guys focuses on scale — more locations, wider delivery, and broader state presence. Shake Shack focuses on per-location productivity — generating higher revenue per store while concentrating on urban strongholds.
Using advanced data tools like Food delivery Intelligence, analysts can monitor pricing, location growth, and online engagement to understand which strategy aligns with long-term business goals. Additionally, integrating insights into a Food Price Dashboard allows for real-time monitoring of competitive performance, while comprehensive Food Datasets ensure decisions are supported by reliable, structured data.
In summary, competitive analysis powered by data scraping provides the clarity needed to navigate the fast food market. Whether evaluating physical footprint, menu pricing, delivery reach, or digital engagement, the tools and datasets available for Five Guys vs Shake Shack Fast Food Data Scraping unlock actionable insights that can drive smarter growth, higher efficiency, and sustained market relevance.
If you are seeking for a reliable data scraping services, Food Data Scrape is at your service. We hold prominence in Food Data Aggregator and Mobile Restaurant App Scraping with impeccable data analysis for strategic decision-making.