
The Diwali 2025 grocery study highlighted notable differences in consumer demand across Tier-1 and Tier-2 cities in India. Metro cities such as Delhi, Mumbai, Bangalore, and Hyderabad recorded early festive stocking, high-volume purchases, and strong preference for premium sweets and snacks. In contrast, emerging urban centers like Jaipur, Lucknow, Kochi, and Surat showed increased focus on staples and promotional items, reflecting a mix of necessity and celebration. Real-time insights allowed retailers and suppliers to make informed decisions on inventory allocation, pricing adjustments, and delivery planning. Monitoring sales patterns and replenishment trends across tiers enabled timely operational adjustments, reducing stock-outs and optimizing product availability. This analysis emphasizes the importance of understanding city-specific demand variations and leveraging structured data to enhance efficiency, meet consumer expectations, and ensure competitiveness during peak festive periods.

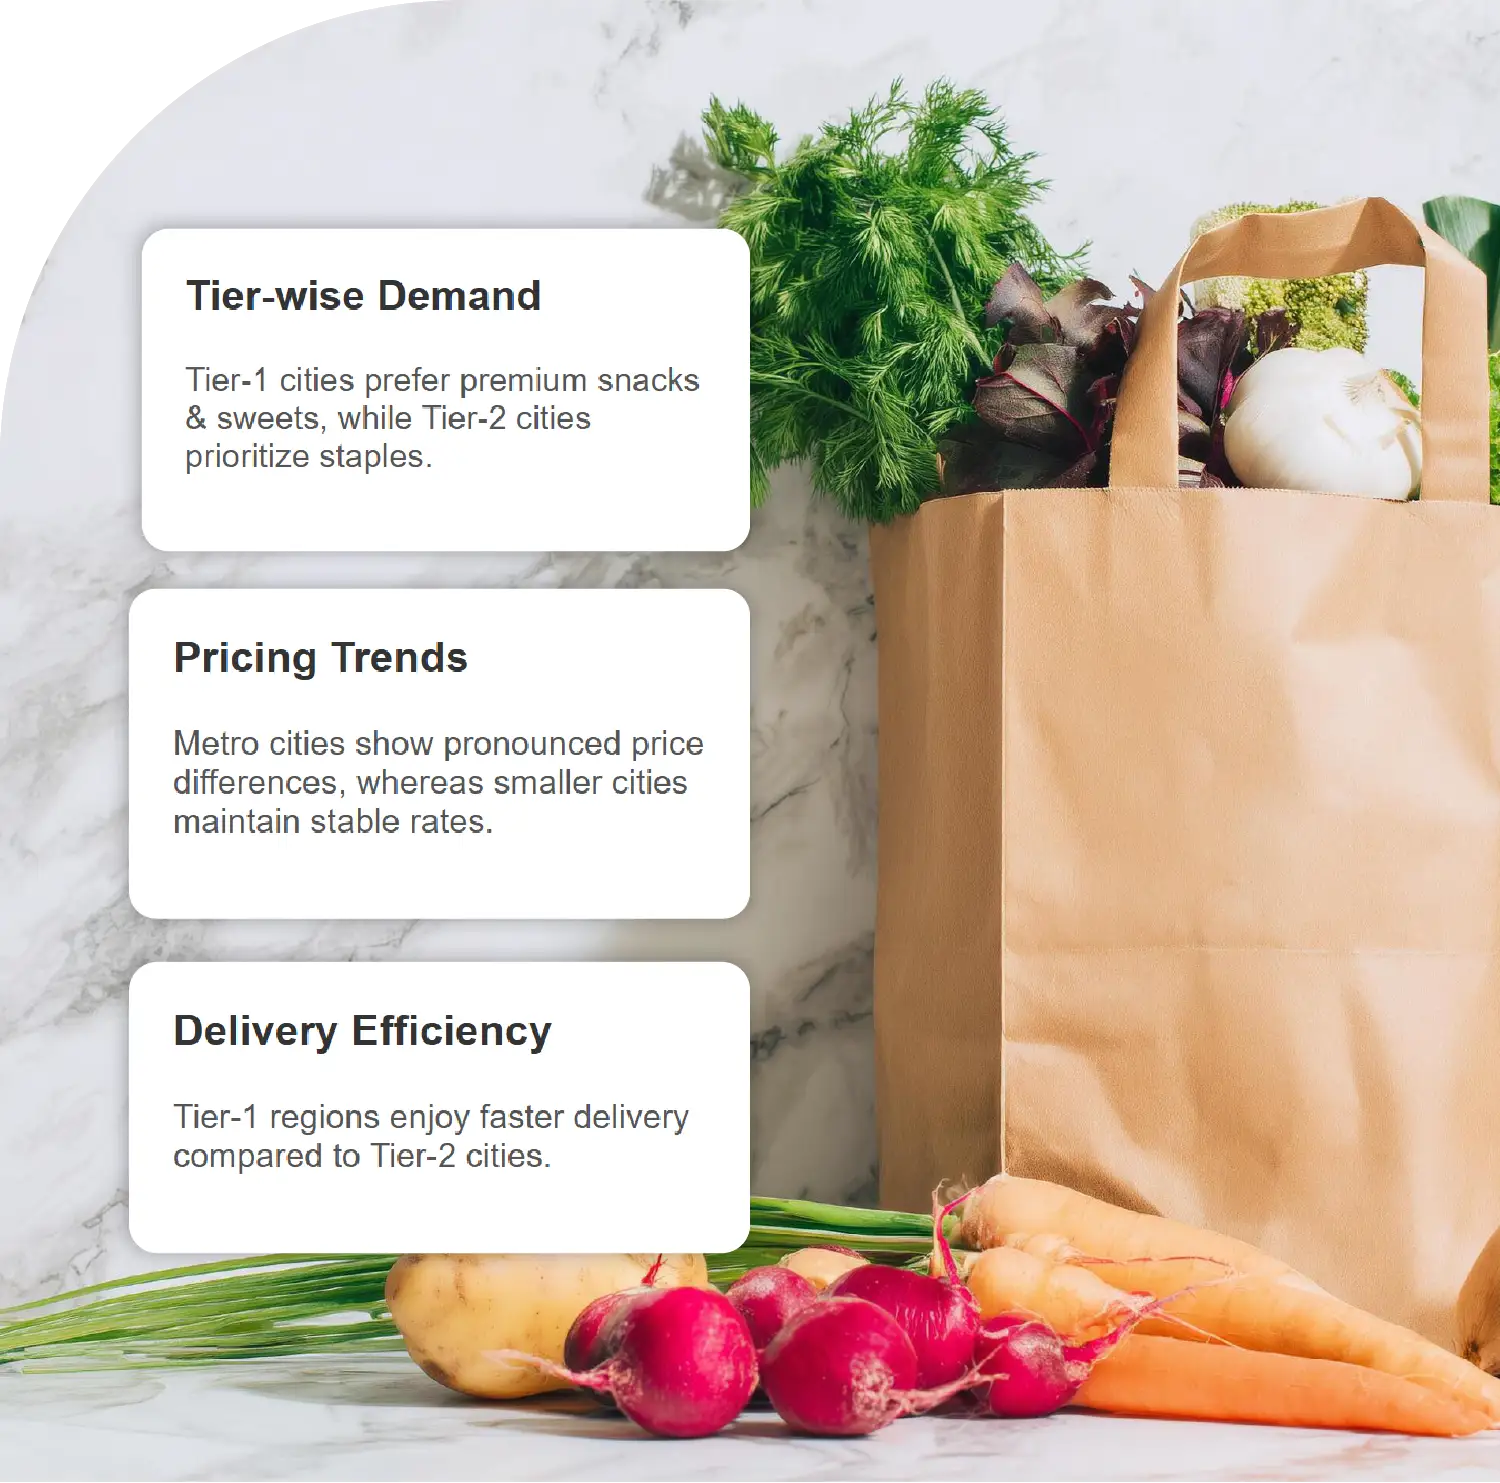
1. Tier-1 cities showed higher demand for premium snacks and sweets, while Tier-2 prioritized staples.
2. Price differences were more pronounced in metro cities, with smaller cities maintaining stable rates.
3. Delivery efficiency was higher in Tier-1 regions compared to Tier-2 cities.
4. High-demand items such as Kaju Katli, Atta, and soft drinks required frequent replenishment.
5. Tier-wise analysis helped optimize inventory distribution, pricing strategies, and customer satisfaction.
The Diwali festival of 2025 witnessed a remarkable surge in online grocery demand as consumers sought convenience, festive essentials, and competitive pricing. To analyze these shifts, we conducted an extensive study leveraging tools to Scrape Grocery Sales Data During Diwali Festival in India, focusing on product-level data across both Tier-1 and Tier-2 cities.
By employing Web Scraping Grocery Purchase Trends in Tier-1 & Tier-2 Cities India, we extracted granular insights on consumer behavior, purchase frequency, and high-demand product categories. Additionally, Tier-Wise Grocery Data Extraction During Diwali in India enabled tracking of stock levels, pricing trends, and replenishment patterns, providing actionable insights for retailers, suppliers, and e-commerce analysts.
This research provides a Web Scraping Grocery Trends During Diwali-based framework to understand how festive demand varies geographically, helping stakeholders make data-driven decisions for inventory allocation, promotional campaigns, and pricing optimization. Scrape Festive Demand Surge During Diwali in India to analyze consumer preferences, peak ordering trends, and promotional impact.
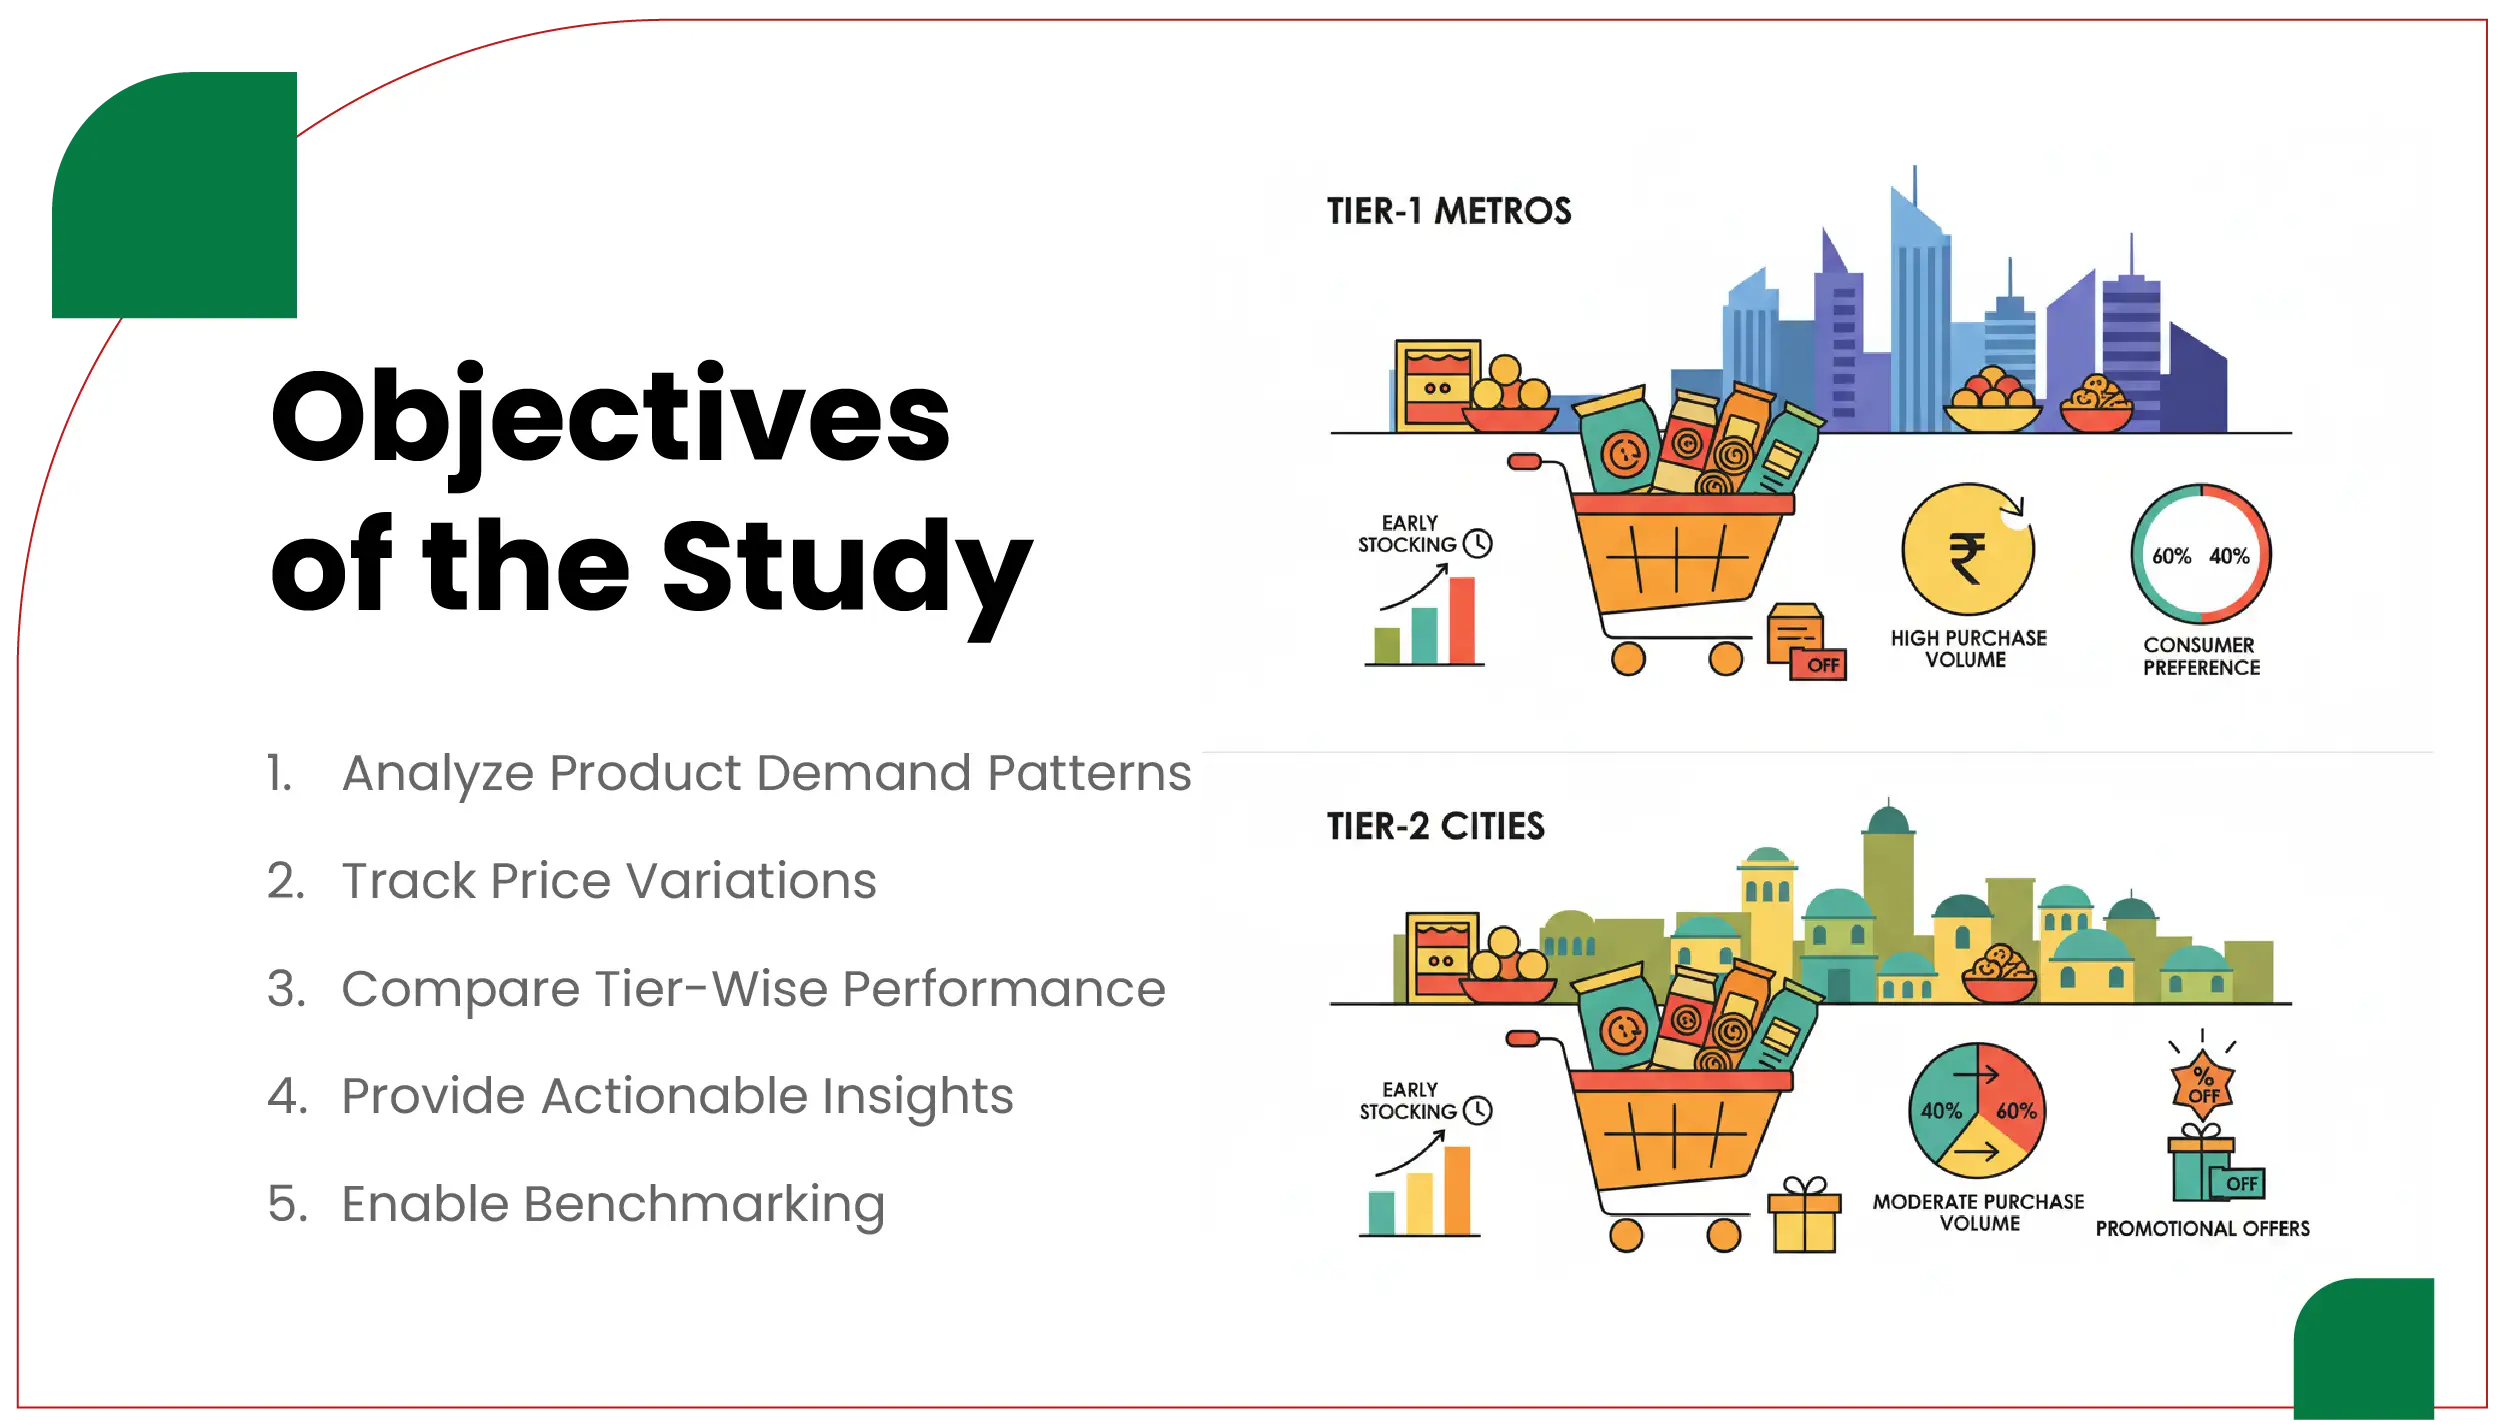
The primary objectives of this report were:
This study leveraged India Grocery Market Data Extraction Tier-wise to ensure comprehensive tier-level insights and accurate market representation.
We employed advanced web scraping techniques and APIs to extract structured datasets across Tier-1 and Tier-2 cities.
We employed Web Scraping for Diwali Grocery Sales Insights to extract, process, and visualize the data for actionable decision-making.
The study focused on high-demand grocery categories during Diwali:
Each category was analyzed for purchase frequency, stock levels, pricing, and city-wise demand patterns, providing a comprehensive picture of Diwali shopping behavior.

We tracked product-level sales in Tier-1 cities (metros like Delhi, Mumbai, Bangalore, Hyderabad) and Tier-2 cities (emerging urban markets like Jaipur, Lucknow, Kochi, Surat).
| Product Category | Tier-1 Cities Sales (Units) | Tier-2 Cities Sales (Units) |
|---|---|---|
| Snacks & Sweets | 1,25,000 | 85,000 |
| Staples | 2,10,000 | 1,75,000 |
| Beverages | 90,000 | 60,000 |
| Dairy & Bakery | 1,10,000 | 75,000 |
| Packaged Foods | 80,000 | 55,000 |
Insights:
Price monitoring revealed dynamic pricing behavior during the Diwali period.
The use of tools to Scrape Tier-1 & Tier-2 Grocery Trends India enabled real-time monitoring of these fluctuations, providing actionable insights for pricing optimization.
Delivery coverage and speed were critical during Diwali, as high demand often caused delays.
| Platform | Tier-1 Avg Delivery Time (Minutes) | Tier-2 Avg Delivery Time (Minutes) |
|---|---|---|
| Blinkit | 35 | 50 |
| Zepto | 40 | 55 |
| BigBasket | 45 | 60 | Dunzo | 30 | 55 |
Insights:
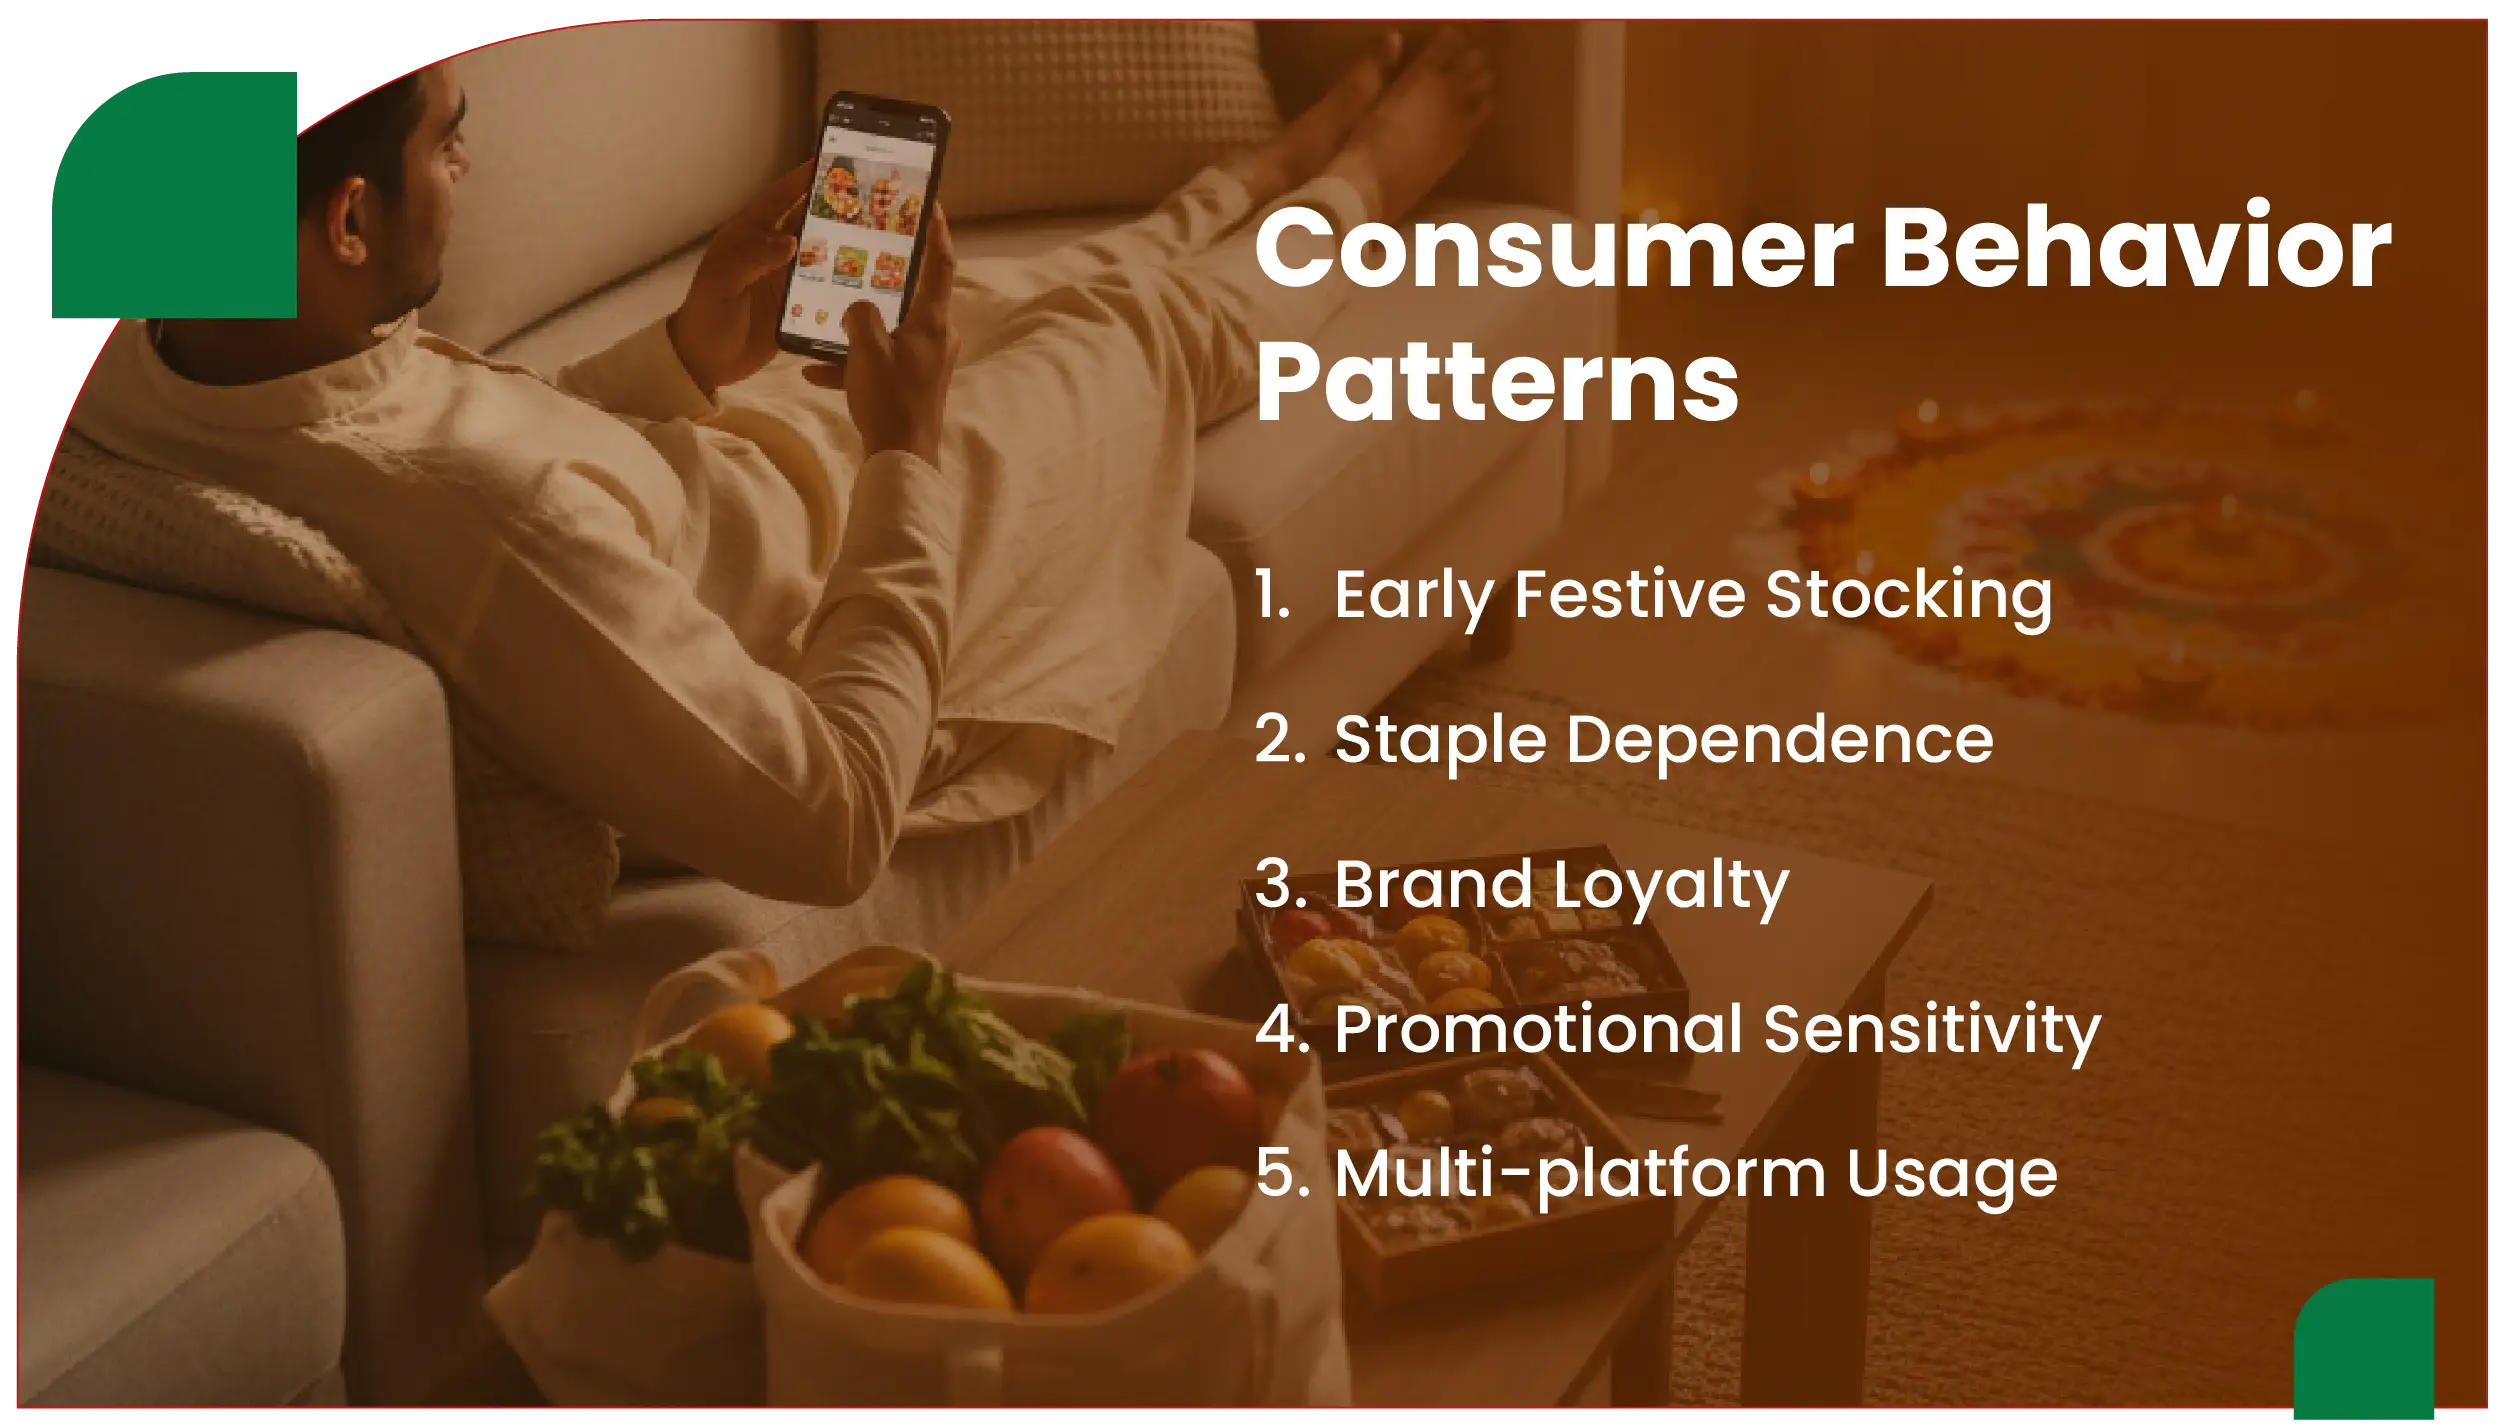
Web Scraping Quick Commerce Data revealed several key behavioral patterns:
Leveraging Grocery App Data Scraping services can automate inventory tracking and demand monitoring for better operational efficiency. Using Grocery Delivery Scraping API Services enables real-time updates on stock levels, delivery slots, and order fulfillment metrics.
Snacks & Sweets: Kaju Katli, Laddoos, and premium namkeen mixes sold out rapidly.
Staples: Rice and Atta experienced consistent replenishment due to sustained demand.
Beverages: Soft drinks and juices saw spikes in pre-festive orders.
Dairy & Bakery: Milk, paneer, and butter were restocked multiple times during peak periods.
Packaged Foods: Ready-to-eat items experienced last-minute surges, particularly in Tier-1 cities.
The Diwali 2025 analysis demonstrates that Tier-1 and Tier-2 cities exhibit distinct grocery demand patterns. Tier-1 cities drive high-volume sales with early festive stocking, while Tier-2 cities show strong demand for staples and promotional items.
By leveraging Grocery Price Tracking Dashboard, retailers can monitor price fluctuations and adjust strategies in real time.
Using Grocery Pricing Data Intelligence, suppliers can make informed decisions on dynamic pricing and promotional planning.
Structured Grocery Store Datasets enable efficient inventory allocation and delivery planning across different city tiers.
These insights provide actionable guidance to improve operational efficiency, enhance customer satisfaction, and maintain competitiveness during peak festive periods in India’s rapidly growing online grocery market.
Are you in need of high-class scraping services? Food Data Scrape should be your first point of call. We are undoubtedly the best in Food Data Aggregator and Mobile Grocery App Scraping service and we render impeccable data insights and analytics for strategic decision-making. With a legacy of excellence as our backbone, we help companies become data-driven, fueling their development. Please take advantage of our tailored solutions that will add value to your business. Contact us today to unlock the value of your data.

