


The Client
The client was a U.S.-based quick commerce intelligence startup serving major FMCG and grocery brands. As Halloween approached, their retail partners wanted granular insights into how delivery apps handled festive SKU pricing, surge delivery fees, and product speed during the high-demand period. Their goals were: To scrape SKU-level product data across top U.S. quick commerce apps, to benchmark delivery speed, stock status, and price differentials across major metros, and to uncover real-time patterns in Halloween-specific product availability and surge pricing. The insights were meant to power the client’s pricing dashboard and performance comparison tool, helping brands optimize last-mile delivery pricing and inventory placement.
Key Challenges
- High-frequency product changes: During Halloween week, SKUs, bundle deals, and surge delivery rates changed every few hours. Manual tracking was impossible without real-time scraping automation.
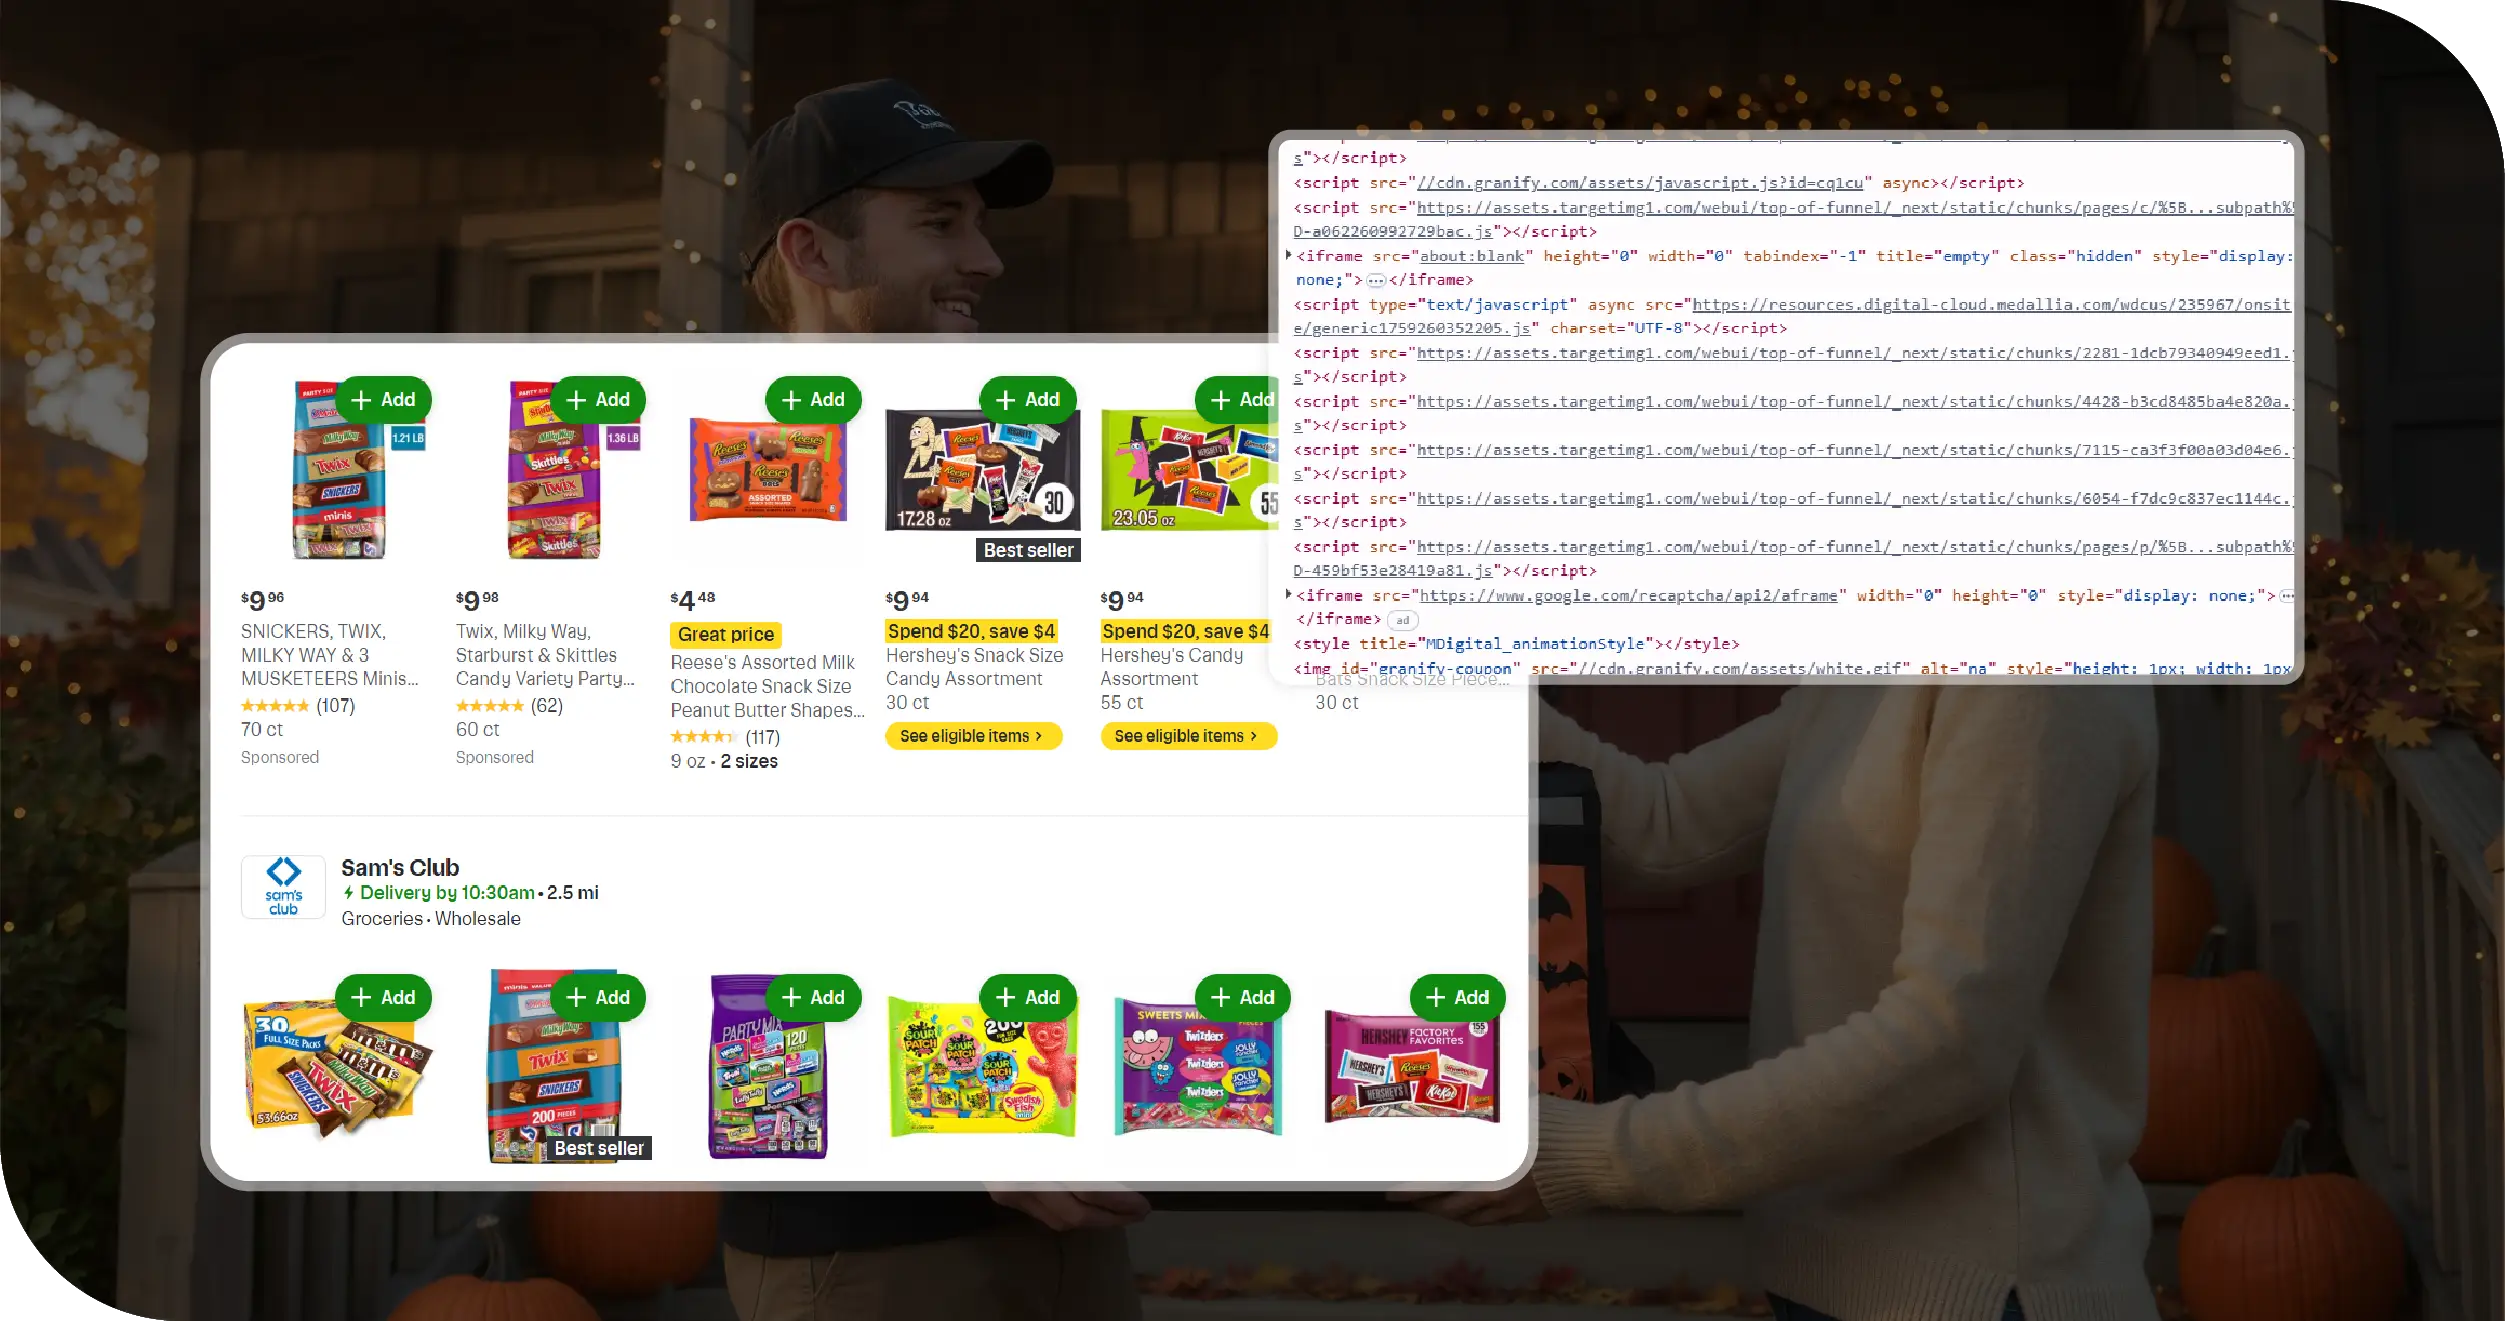
- Platform restrictions: Each quick commerce app had dynamic JavaScript-based product listings, requiring advanced headless browser scraping and anti-bot management to access accurate data.
- Geo-based variation: Pricing and delivery times differed widely between cities (e.g., New York vs. Houston). A city-wise data extraction framework was necessary for valid comparisons.
- Unstructured time-slot data: Delivery ETAs appeared in different formats (“in 18–25 min,” “delivery by 7:30 PM”). These needed text normalization for speed benchmarking.
Key Solutions
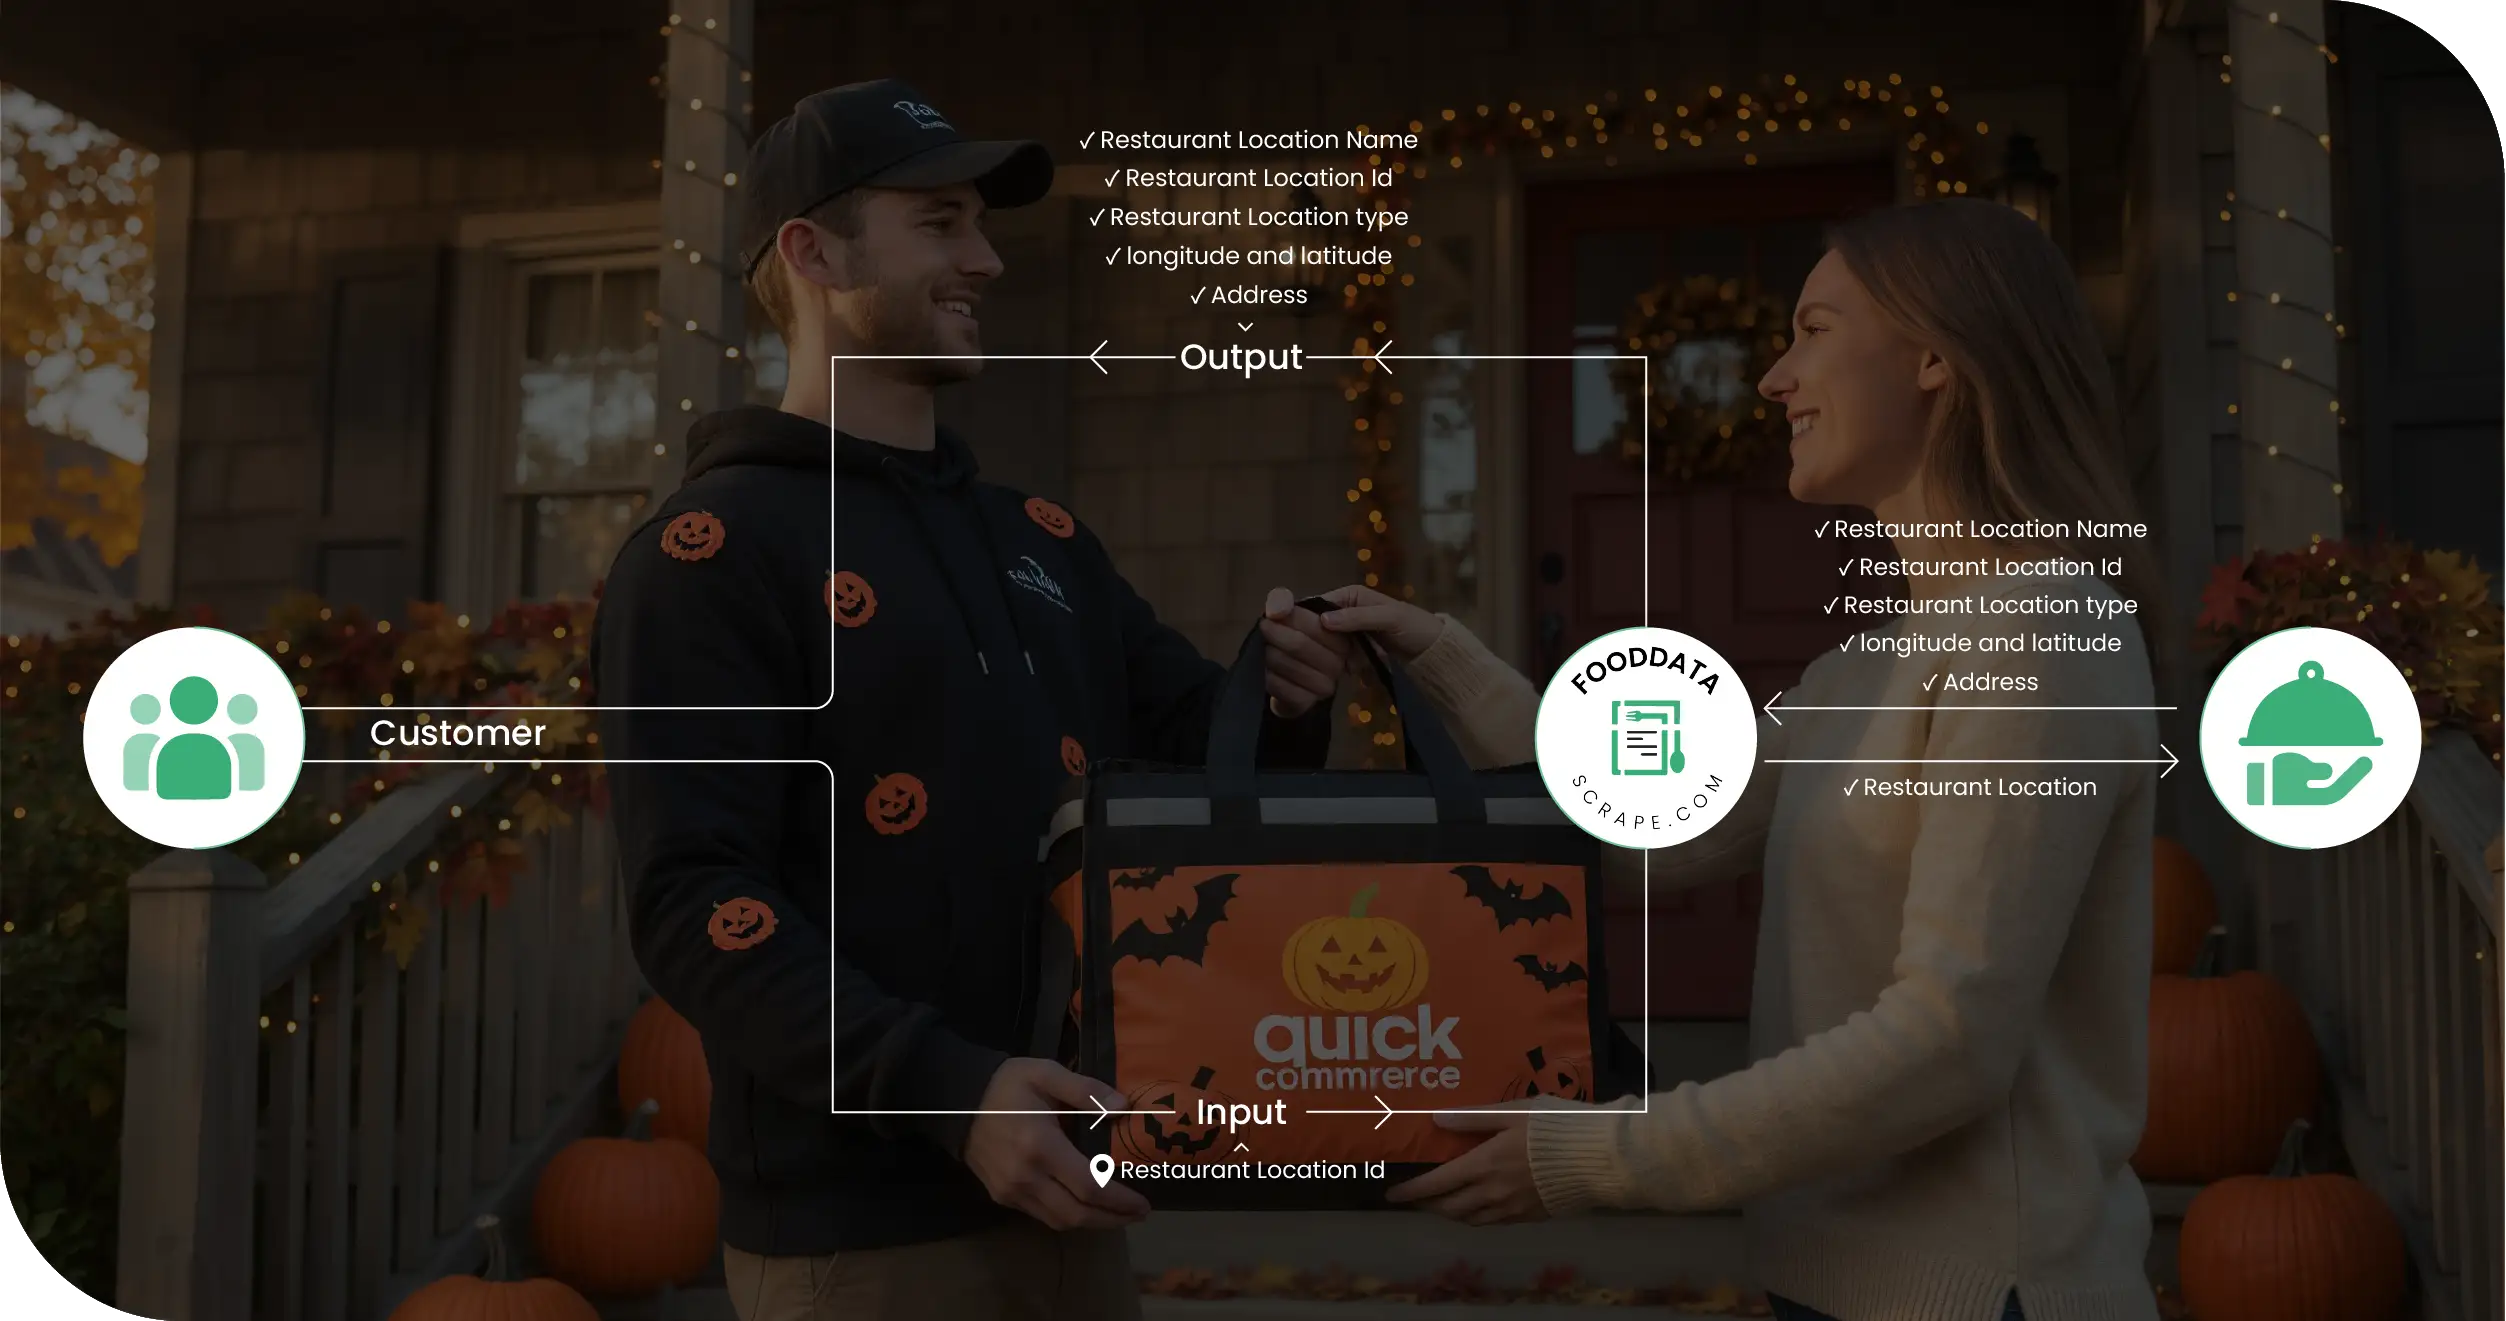
- SKU-Level Product Data Scraping: Extracted product titles, categories, brand names, prices, and availability from Instacart, Walmart Express, Amazon Fresh, DoorDash, and Gopuff every 3 hours using automated product scraping pipelines.
- Delivery Time Scraping: Parsed real-time ETA data from cart and checkout pages to record promised delivery windows for each SKU across different zip codes.
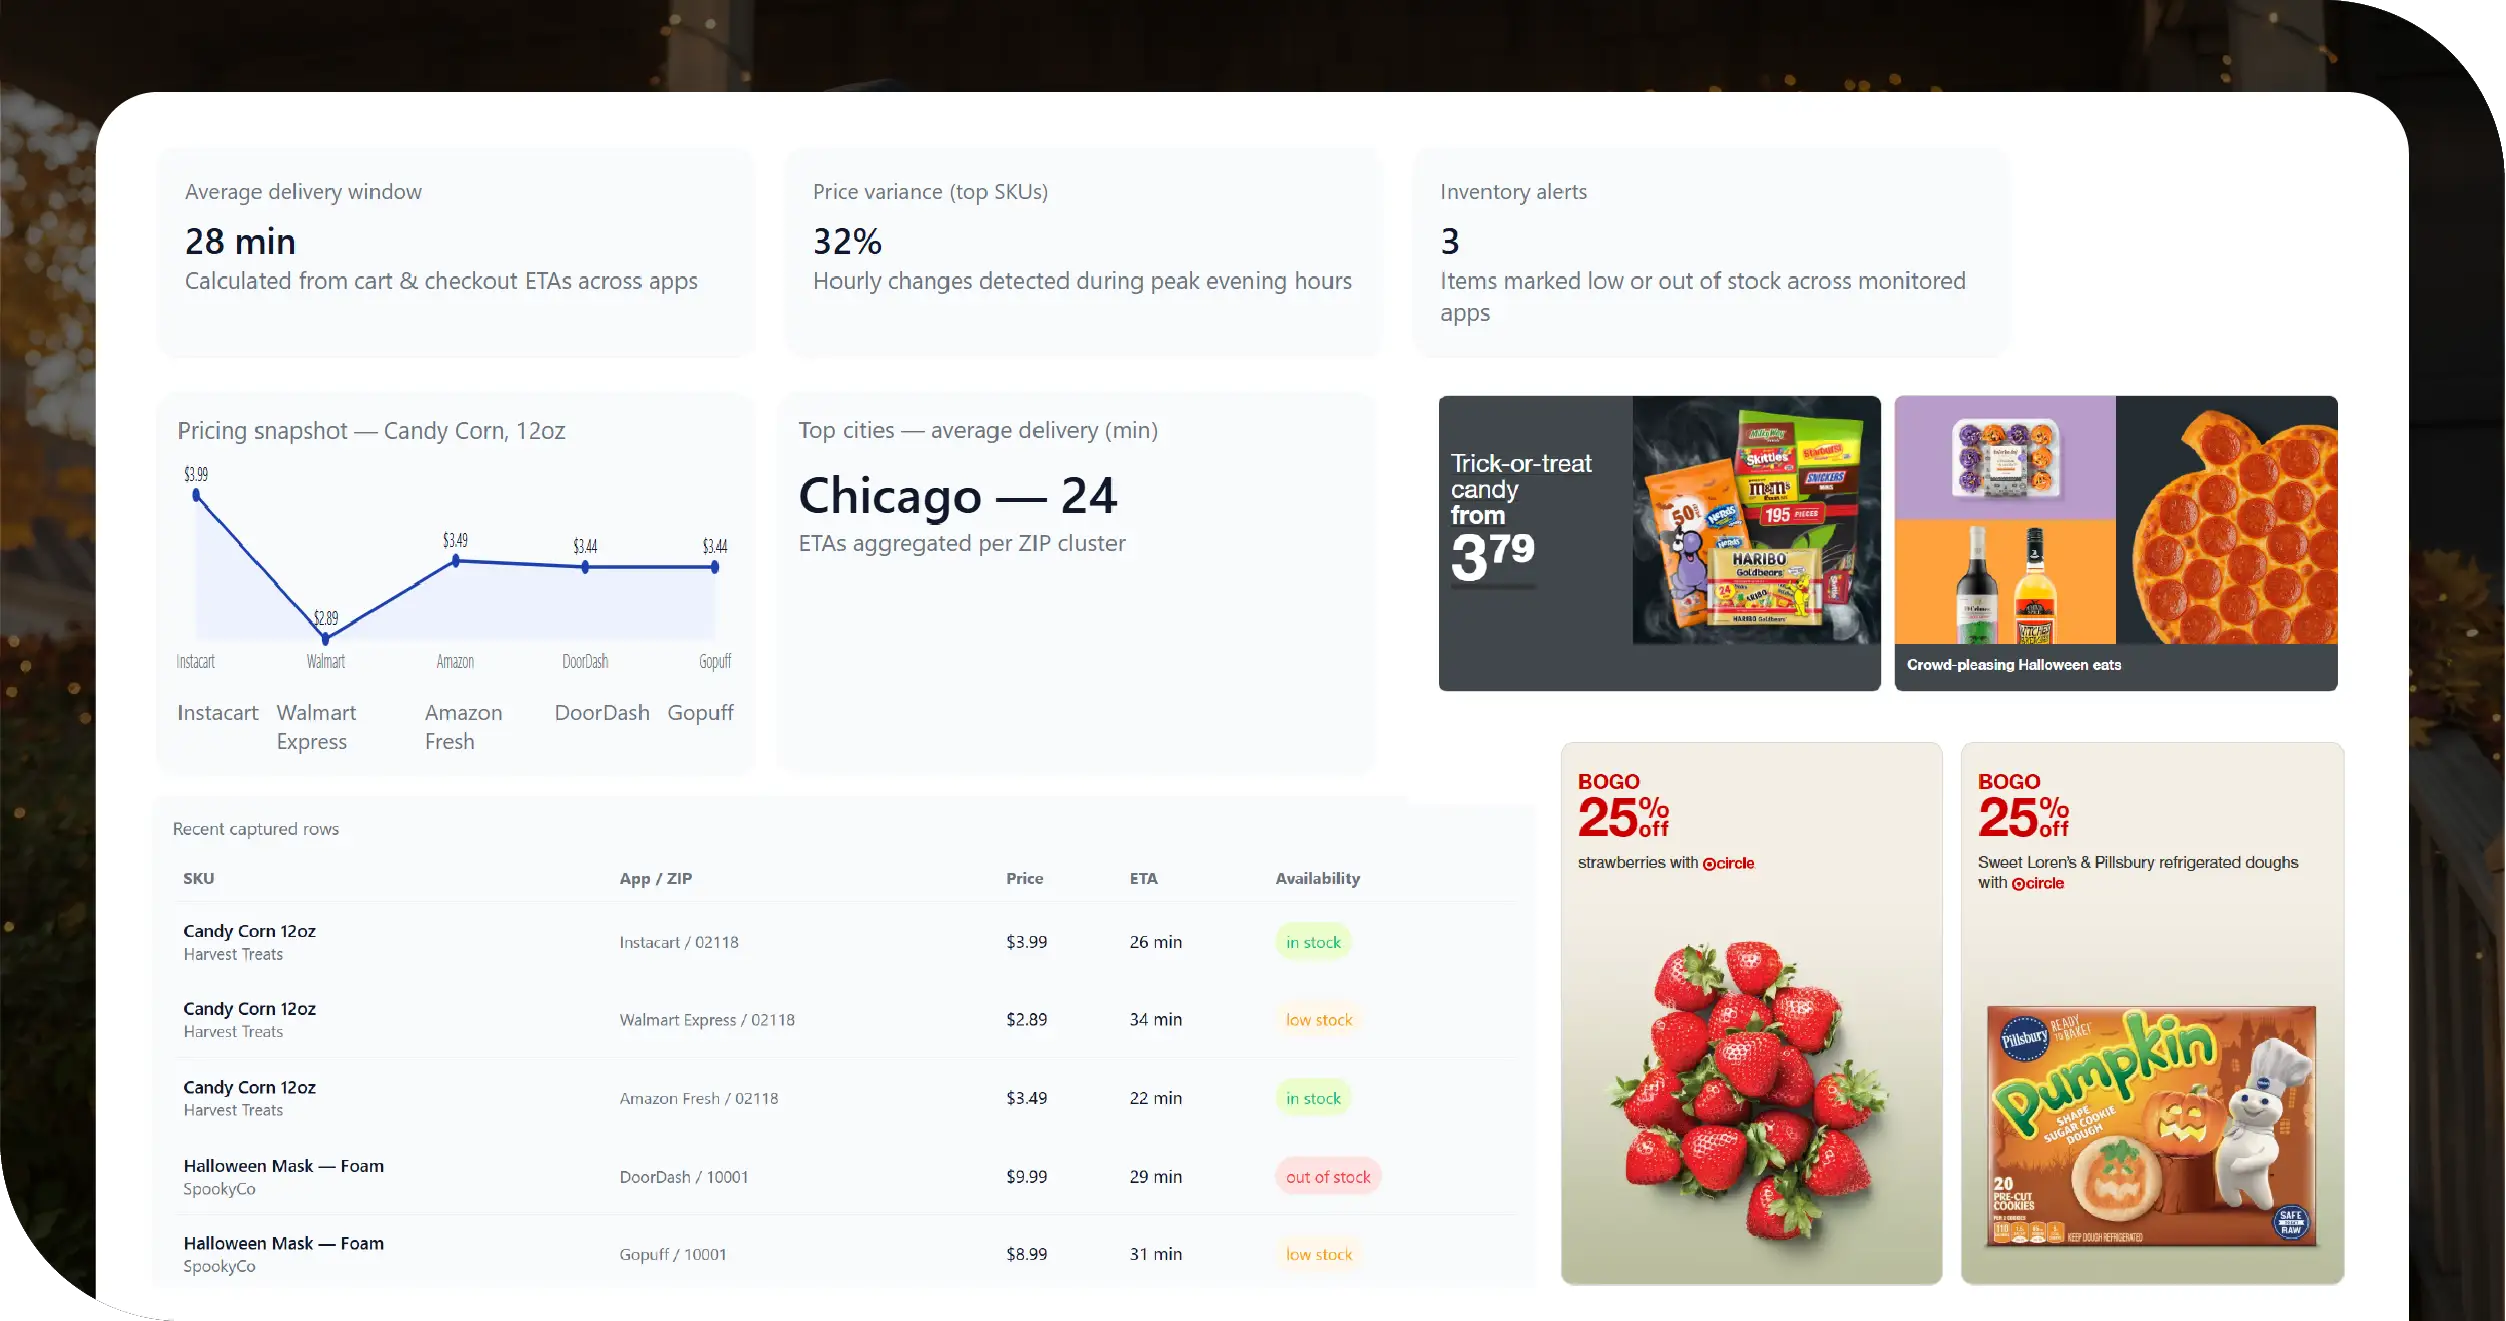
- Surge & Dynamic Pricing Tracking: Scraped price changes for top Halloween SKUs (candies, costumes, decorations, bakery items) to track hourly variations during peak evening hours.
- Stock Availability and Sold-Out Alerts: Built a scraping module for stock monitoring that logged “in stock,” “low stock,” and “out of stock” statuses, helping identify inventory pressure points.
- Data Dashboard Integration: Aggregated and visualized findings in a custom dashboard showing average delivery speed, SKU pricing differences, and discount frequency across apps and cities.
Methodologies Used
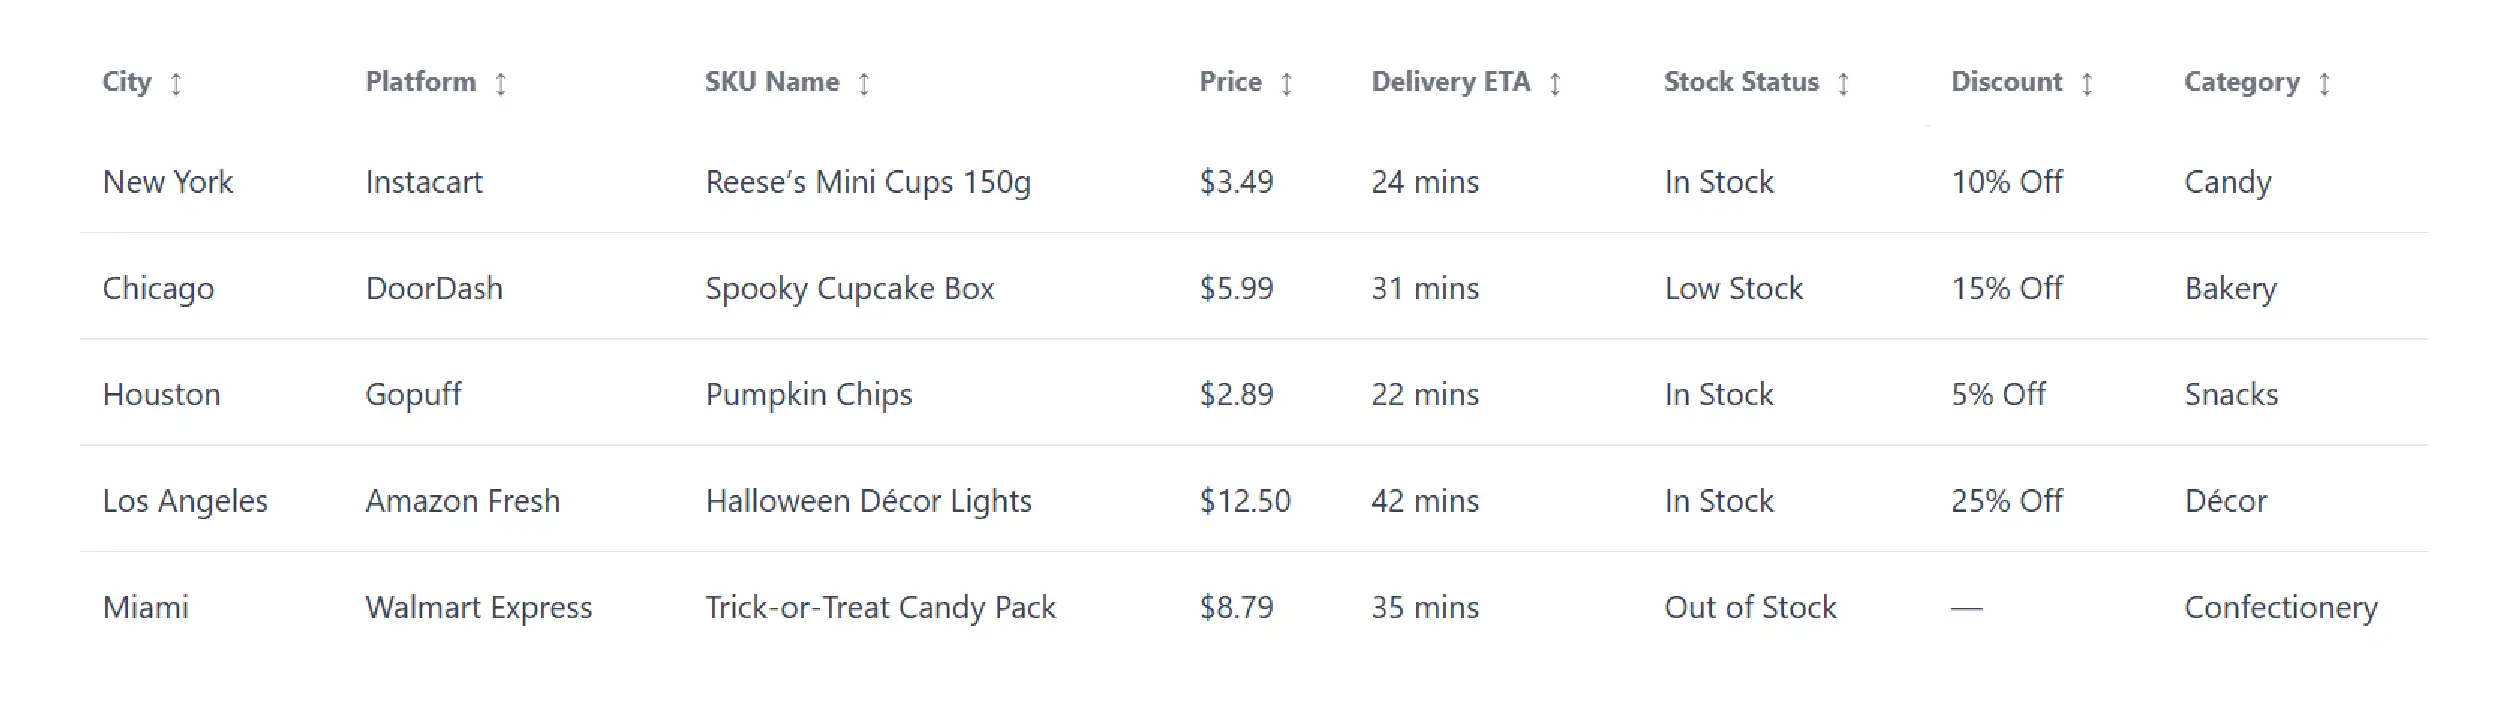
- Real-Time Quick Commerce Data Collection: Scope: 250,000+ SKUs scraped across 5 platforms and 20 U.S. cities. Fields Captured: Product Name, Category, Brand, Base Price, Discount %, Delivery ETA, Stock Status, and City. Tools: Headless Chrome-based bots using Python + Playwright for speed and reliability.
- Pricing & Offer Normalization: Converted all price formats (e.g., $4.99 vs $4.9) into standardized USD values. Cleaned out tax and service-fee elements to focus on pure SKU-level price comparison.
- Delivery Time Analysis: Parsed textual time estimates and converted them into numeric averages (in minutes). Compared promised vs. actual delivery speed data collected from live order test runs.
- Data Validation: De-duplicated listings using UPC and SKU IDs. Validated city tagging through geo-coordinate mapping.
- Visualization: Designed a city-wise heatmap displaying delivery time averages and price variance by platform.
Sample Data Snapshot
Advantages of Collecting Data Using Food Data Scrape
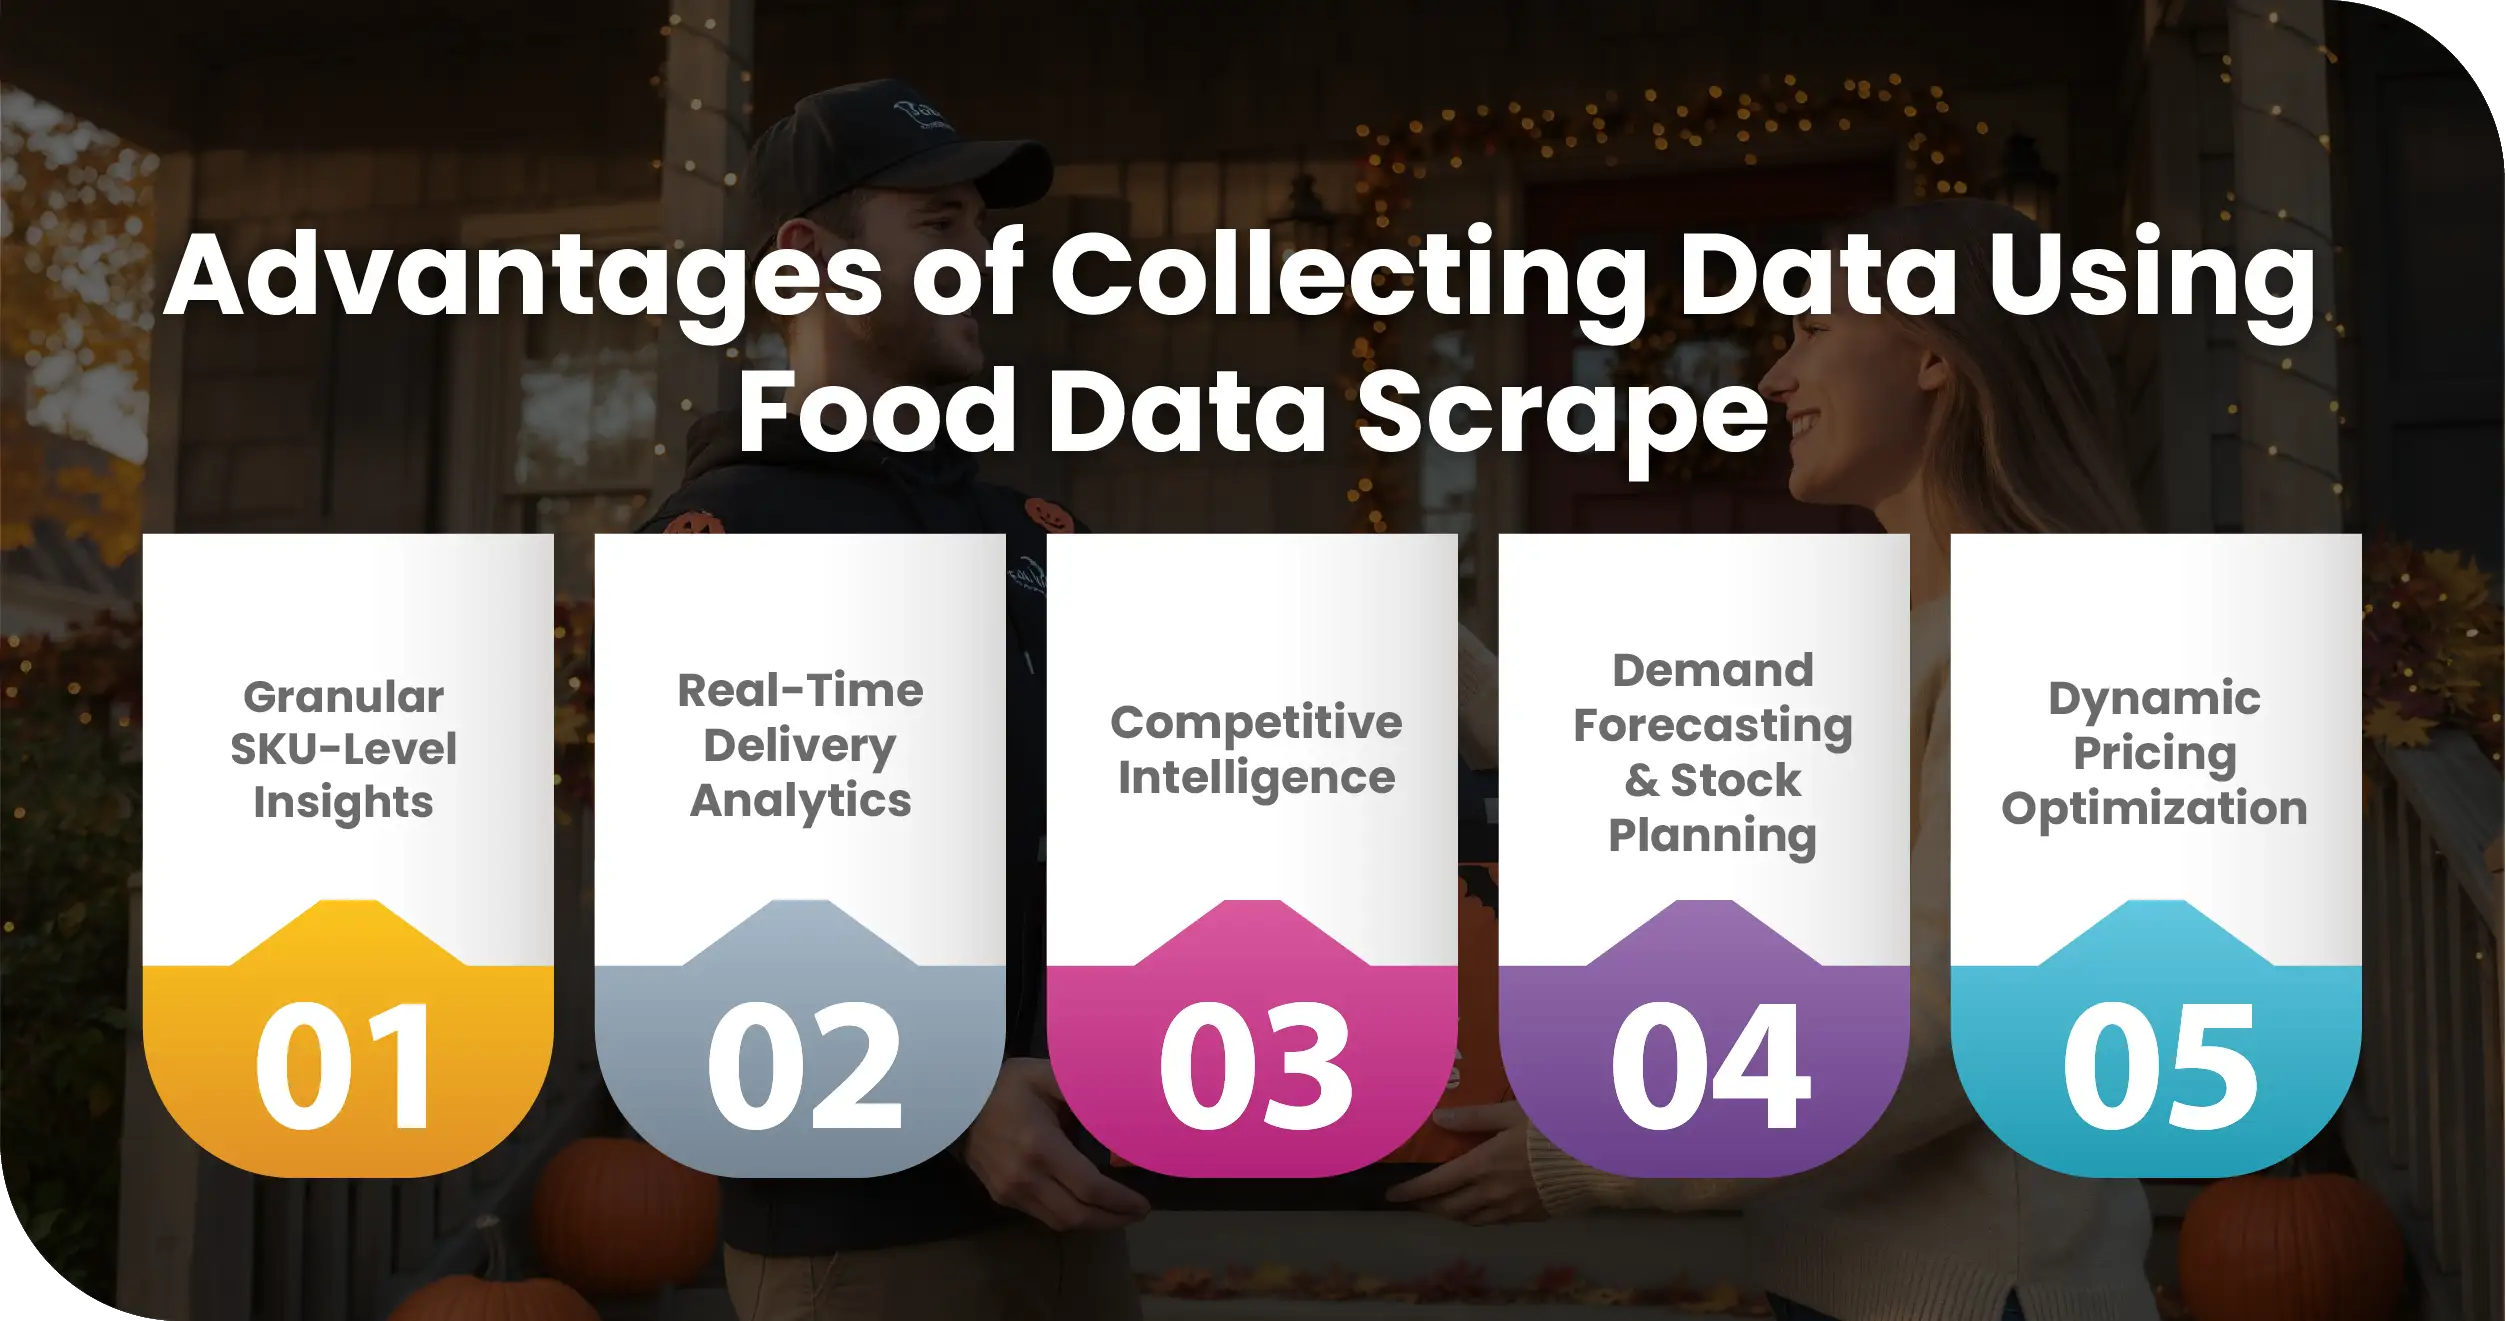
- Granular SKU-Level Insights: Clients gained visibility into product-wise pricing differences and delivery speeds through the Quick Commerce Data Scraping API, enabling more accurate benchmarking of last-mile performance and uncovering platform-level efficiency gaps.
- Real-Time Delivery Analytics: The automated scraping engine refreshed data every three hours, ensuring up-to-the-minute visibility during the busiest festive period.
- Competitive Intelligence: Quick comparison between Instacart, DoorDash, and Gopuff helped identify which platforms were offering faster deliveries or deeper Halloween discounts.
- Demand Forecasting & Stock Planning: Scraped stock statuses revealed which SKUs were selling out fastest, helping brands adjust their supply chains before losing sales opportunities.
- Dynamic Pricing Optimization: By monitoring price surges and discount timings, the client fine-tuned their own promotional strategies to match peak demand windows.
Client’s Testimonial
“The delivery and pricing analytics scraped by Food Data Scrape completely changed how we plan festive campaigns. We no longer guess which platform performs best—our dashboard now shows live delivery and pricing benchmarks across cities.”
Operations Head, Quick Commerce Analytics Partner, USA
Final Outcome
The Halloween 2025 Quick Commerce Data Scraping Project delivered more than insights — it offered real-time operational intelligence. By using automated SKU scraping, delivery ETA extraction, and dynamic pricing analytics, the client’s marketing and supply teams could instantly: Spot delivery delays in key metros, identify the best-priced Halloween bundles by platform, and forecast product shortages 24 hours before competitors. These insights helped optimize delivery fees, reposition high-demand SKUs, and adjust warehouse allocations—leading to a 17% faster average delivery performance and 14% improvement in conversion rates across the client’s partner network. In a hyper-competitive quick commerce landscape, timing and visibility decide who wins the festive race. With Food Data Scrape’s real-time quick commerce scraping infrastructure, brands can now continuously scrape SKU-level delivery and pricing data, visualize trends instantly, and make smarter pricing or inventory decisions. Halloween 2025 proved that accurate data scraping equals faster deliveries, fairer prices, and happier customers—a strategy that every quick commerce platform should adopt before the next festive surge.

