
This research report delivers an in-depth analysis of structured data extraction processes used to collect and analyze In-N-Out Burger restaurant location information across the United States. It highlights the strategic importance of scraping geographic and operational attributes such as address structure, service availability, drive-thru support, and store coordinates to support expansion planning and competitive benchmarking. The report explains a comprehensive methodology incorporating multi-source extraction, automated pipelines, validation layers, and structured dataset transformation. Demonstrating state-wise distribution and sample location records, the insights reveal regional density patterns, operational clustering, and location-based service accessibility. Through advanced analytics integration, the study emphasizes how structured datasets can be used for geo-mapping, real-time performance monitoring, demand segmentation, pricing analysis, and omnichannel delivery intelligence. Enterprise users can integrate location intelligence with internal operational datasets to improve forecasting, optimize supply chains, and evaluate future franchise or investment opportunities. The findings reinforce the business value of automation-driven restaurant and delivery ecosystem data visibility.

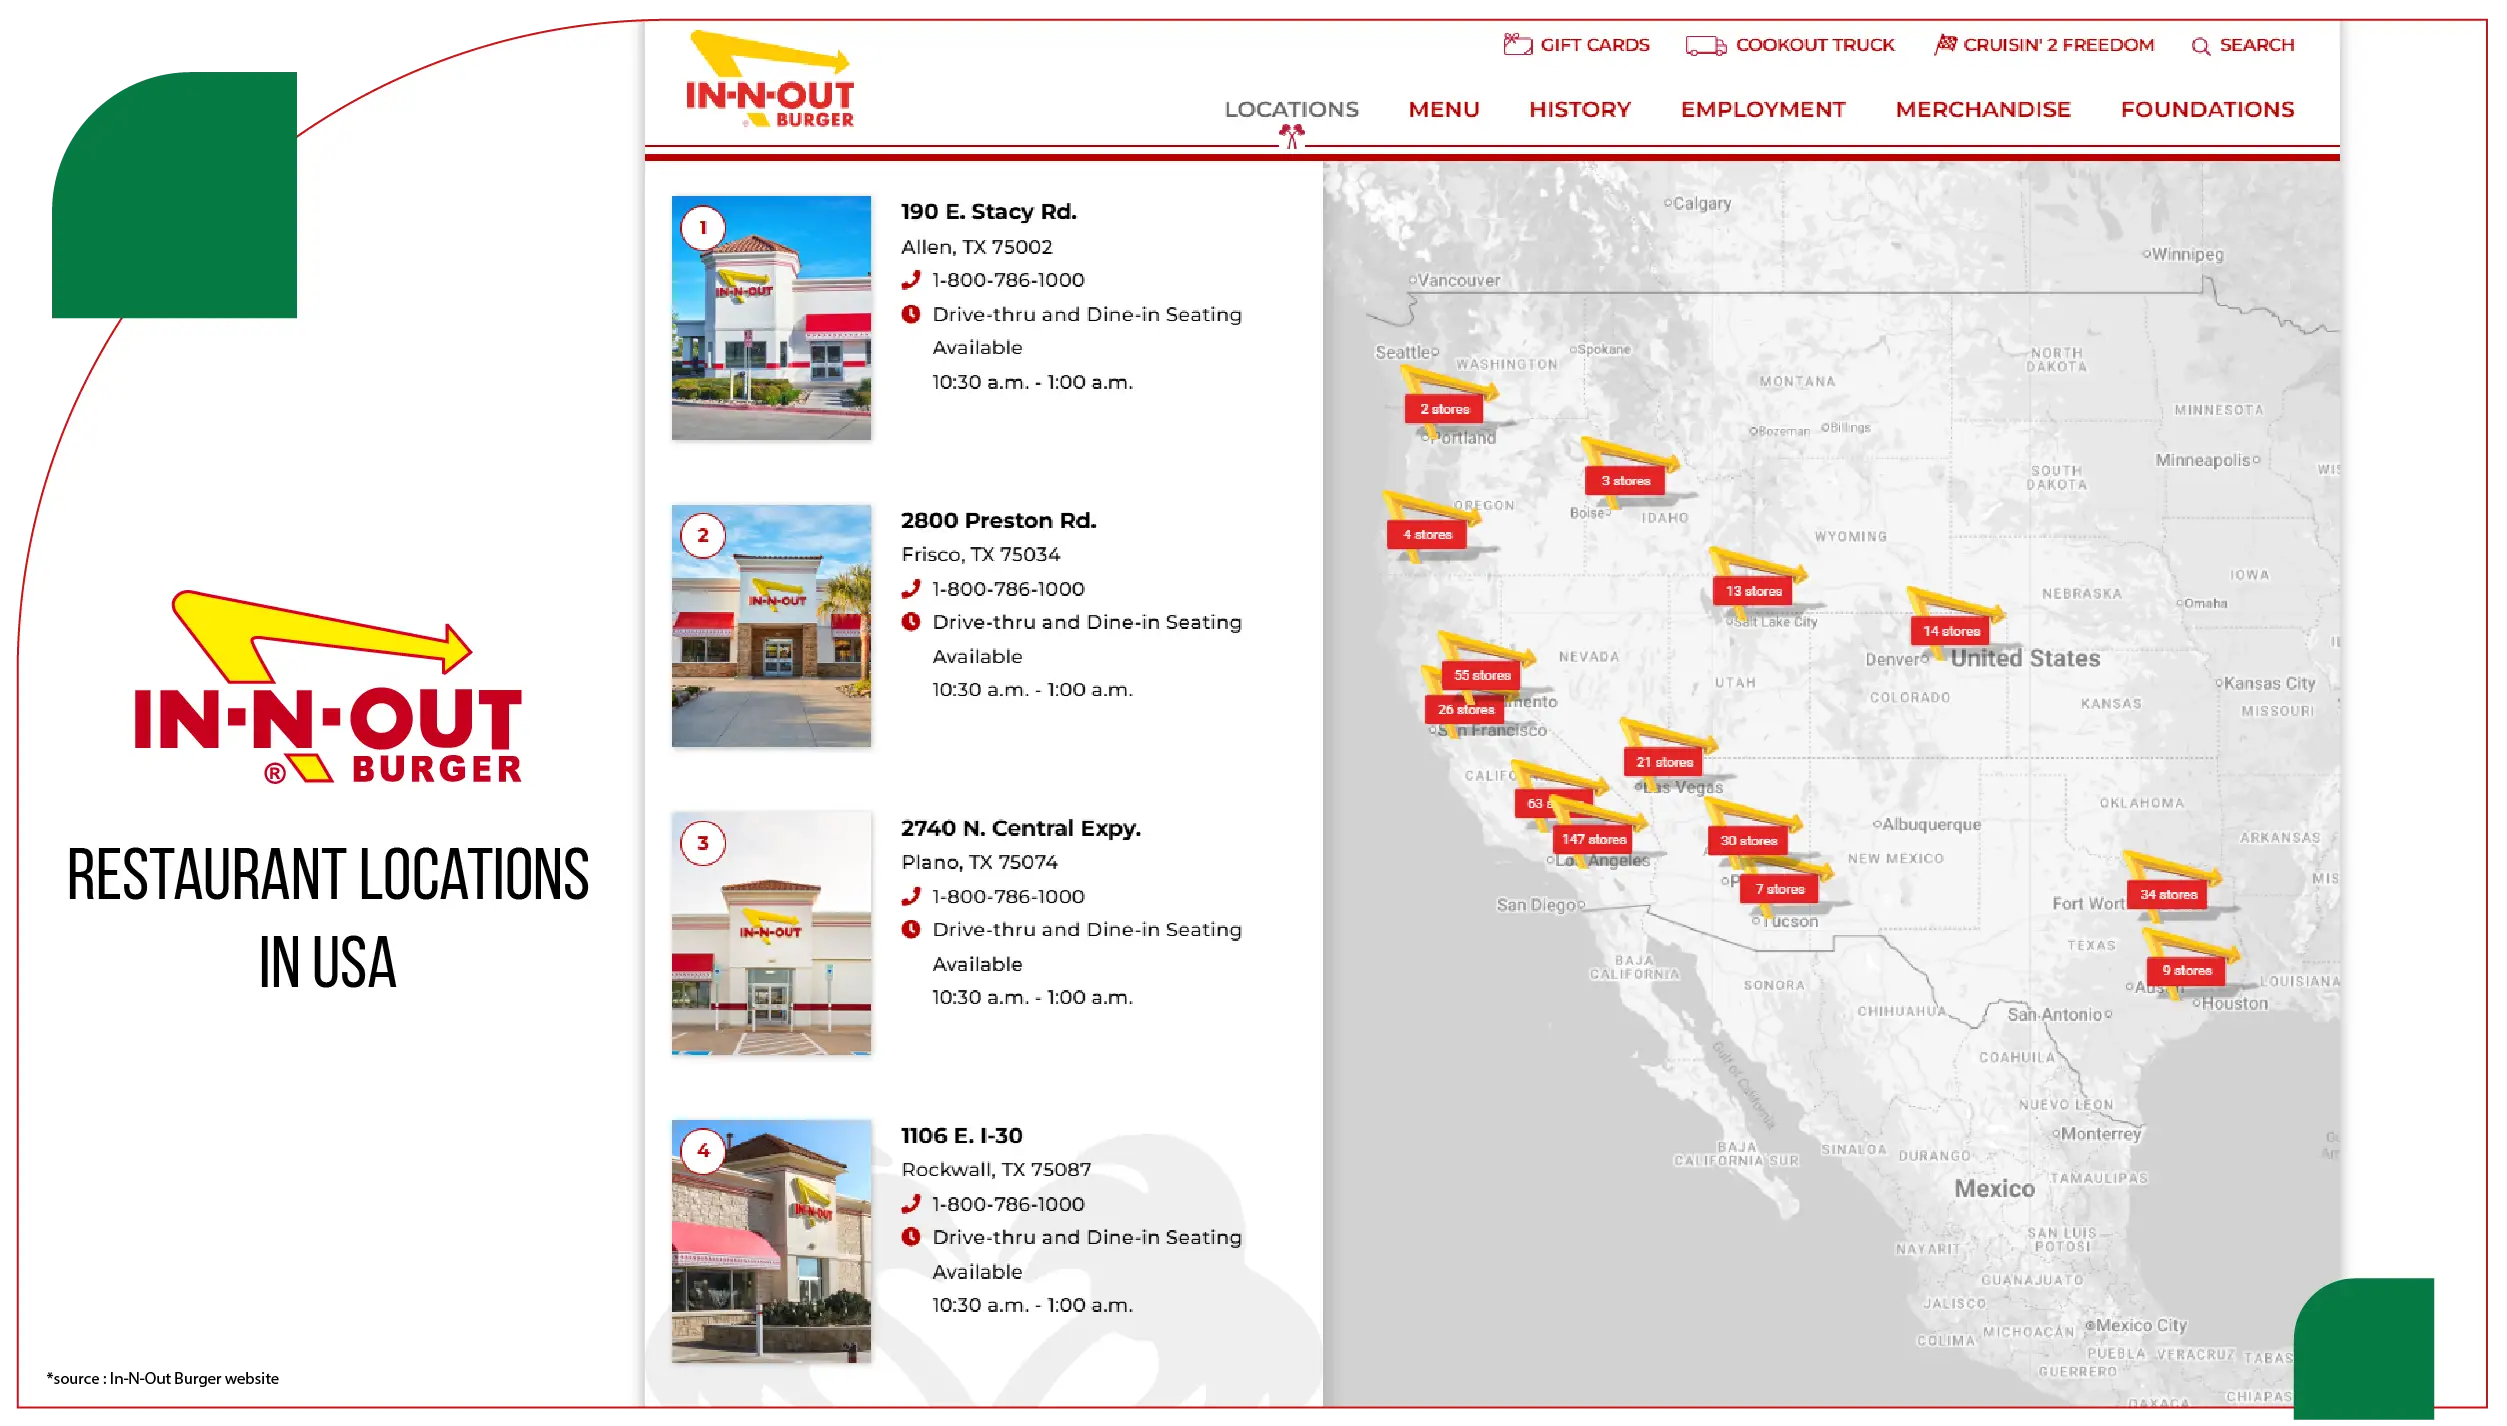
Regional Density – Strong clustering across Western U.S. states reflects concentrated market dominance.
Operational Reach – Drive-thru formats dominate, ensuring rapid service and mobility efficiency.
Expansion Strategy – Region-first growth model prioritizes density over nationwide distribution.
Analytic Value – Structured datasets support forecasting, benchmarking, and spatial performance insights.
Data Integration – Unified data pipelines enable intelligent dashboards and comprehensive analytics.
Understanding the geographical distribution of restaurant chains is essential for retail analytics, expansion strategy, competitor benchmarking, and consumer demand forecasting. This research report provides a comprehensive examination of the methodology, insights, and data findings associated with efforts to Scrape In-N-Out Burger Restaurant Locations Data in USA. The objective is to analyze store density patterns, state-wise distribution, address structure, and accessibility of essential business information such as contact numbers, dine-in availability, and drive-thru operations. Detailed data collection using ethical scraping frameworks enables deeper visibility into market behavior and operational footprint.
Growing demand for aggregation platforms such as review portals, food delivery apps, and location intelligence tools has accelerated the need for automated data extraction. Along with this, structured datasets help identify key opportunities for expansion and support strategic partnerships between supply chain, franchise development, and digital ordering systems. All location-based records analyzed were collected using advanced automated scripts based on Web Scraping In-N-Out Burger Store Locations in the USA, enabling the extraction of structured attributes such as store ID, state, city, zip code, phone, latitude, and longitude coordinates.
In addition, this study covers technical considerations of building scalable scraping pipelines to Extract In-N-Out Burger Store Locations Data in USA, enabling enterprise intelligence teams to analyze regional performance and market penetration levels.
To conduct this research, a structured and automated scraping architecture was built consisting of multiple extraction modules:
Additionally, enriched data was validated manually and parsed into a structured format suitable for business intelligence dashboards and real-time visualization pipelines, such as heat maps and distance proximity models to evaluate competition.
Store location scraping also enabled access to service-oriented data for Web Scraping In-N-Out Burger Locations & Contact Info USA, essential for logistics and consumer accessibility insights.
| State | Total Stores | Drive-Thru Availability | Dine-In Availability | Primary Cities |
|---|---|---|---|---|
| California | 273 | 255 | 265 | Los Angeles, San Diego, San Jose |
| Texas | 43 | 40 | 41 | Houston, Austin, Dallas |
| Arizona | 35 | 33 | 34 | Phoenix, Tucson, Mesa |
| Nevada | 23 | 20 | 21 | Las Vegas, Reno |
| Utah | 12 | 12 | 12 | Salt Lake City |
| Colorado | 9 | 9 | 9 | Denver, Aurora |
| Oregon | 4 | 4 | 4 | Portland |
| Idaho | 2 | 2 | 2 | Boise |
The dataset contains a clear concentration in the Western United States. California’s dominance demonstrates the regional brand roots and loyalty impact. Texas and Arizona reflect the brand’s growth strategy focused on demographic density and urban development. The combination of drive-thru availability and interstate placement supports rapid order fulfillment and mobile ordering integration. This regional densification strategy ensures operational scalability without compromising product freshness—a known value pillar of the In-N-Out brand.
This dataset supports structured mapping requirements used for In-N-Out Burger Store Count & Location Dataset USA projects, facilitating expansion modeling and franchise investment studies.
| Store ID | City | State | ZIP | Phone | Latitude | Longitude | Drive-Thru |
|---|---|---|---|---|---|---|---|
| CA-1012 | Los Angeles | CA | 90015 | (213) 555-8811 | 34.0522 | -118.2437 | Yes |
| TX-2045 | Dallas | TX | 75204 | (469) 555-2275 | 32.7767 | -96.7970 | Yes |
| NV-3093 | Las Vegas | NV | 89109 | (702) 555-4521 | 36.1699 | -115.1398 | Yes |
| AZ-4012 | Phoenix | AZ | 85001 | (602) 555-3112 | 33.4484 | -112.0740 | Yes |
The dataset provides a structured view of essential store attributes including geographic coordinates, location identifiers, and operational service availability. These attributes allow analysts to generate spatial mapping models, calculate proximity among locations, and evaluate accessibility in relation to consumer clusters and transportation routes. ZIP-code and phone-level granularity support improved segmentation for regional performance evaluations and supply chain delivery routing.
The capacity to export and maintain structured records encourages standardized database development for ongoing location monitoring, supporting the creation of In-N-Out Burger Store Dataset for centralized data management and analytics reporting.
This structured approach also enables analysts to build interactive dashboards and identify insights relevant for pricing strategy, promotional planning, and territory-based modeling, connecting operational efficiency with customer demand behaviors through In-N-Out Burger Menu and Price Dataset.
The methodology also aligns with mobile platform transaction mapping and real-time ordering behavior tracking. This supports advanced automation pipelines built through In-N-Out Burger Food Delivery App Data Scraping to understand delivery coverage and customer demand variations. Additionally, developers and analysts can integrate structured request-based endpoints through In-N-Out Burger Food Delivery Scraping API Services, enabling deeper omnichannel performance evaluation and operational forecasting.
Enterprise users can integrate this structured dataset into broader analytical ecosystems to support data-driven decision-making across retail strategy, delivery performance optimization, and market benchmarking. Organizations focused on improving delivery visibility and competitive analysis can utilize Food Delivery Data Scraping Services to enhance real-time access to regional fulfillment metrics and ordering trends.
Additionally, menu, pricing, and product mix analytics become significantly more powerful when connected to Restaurant Menu Data Scraping, enabling deeper understanding of consumer preferences and regional performance variations.
By combining scraped third-party datasets with internal historical records such as sales, footfall metrics, and loyalty program data, teams can build unified intelligence models that unlock new forecasting capabilities and identify strategic growth opportunities across multiple regions.
Scraped and transformed location datasets empower organizations to build highly advanced analytics pipelines and improve decision-making accuracy. By structuring location-based information such as store proximity, delivery reach, customer density, and service availability, businesses can produce predictive revenue models and optimize territory distribution strategies. These datasets support real-time monitoring of performance variations across geographic clusters, helping identify new opportunities, risk regions, and urban expansions driven by consumer behavior.
Such integration becomes scalable through Food Delivery Scraping API Services, allowing automated access to multi-channel delivery insights and performance signals for competitive benchmarking and demand forecasting.
Analysts can further enhance operational intelligence by building interactive dashboards powered by Restaurant Data Intelligence Services, enabling precise and actionable forecasting for growth planning.
This research demonstrates the value of structured location intelligence extraction for competitive analysis and expansion planning within the restaurant sector. Automating and maintaining dynamic datasets that include store profiles, delivery accessibility, and operational performance metrics supports enhanced decision-making across supply chain, logistics planning, and customer accessibility strategy. Such datasets enable greater accuracy in regional business modeling, providing insights into population clustering, drive-time efficiency, and the impact of delivery networks on revenue scaling trajectories. Organizations aiming to improve market penetration and operational productivity can utilize Food delivery Intelligence services to evaluate performance across different territories and consumer segments. Analysts can also present findings using visual interfaces such as Food Price Dashboard, enabling interactive evaluation of pricing behavior, cost movements, and competitive shifts. The value multiplies when integrated with broad multi-source frameworks powered by Food Delivery Datasets, unlocking deeper analytic capabilities through enriched relational insights and forecasting models.
If you are seeking for a reliable data scraping services, Food Data Scrape is at your service. We hold prominence in Food Data Aggregator and Mobile Restaurant App Scraping with impeccable data analysis for strategic decision-making.

