
This report delivers a comprehensive performance assessment of Minimalist across India’s leading quick commerce platforms, Blinkit and Swiggy Instamart. Based on structured marketplace data collected across Delhi NCR, the study evaluates assortment architecture, pricing benchmarks, discount distribution, stock stability, digital shelf positioning, and delivery efficiency.
The analysis highlights how identical SKUs perform differently depending on platform logic, fulfillment infrastructure, and promotional strategy. While Instamart demonstrates wider assortment depth and bundle presence, Blinkit leads in stock reliability, sharper pricing, and faster last-mile fulfillment. The findings also reveal that face care products act as the primary revenue engine, supported by high in-stock rates and frequent repurchase behavior.
By combining SKU-level tracking with delivery-time benchmarking, this report enables brands to refine quick commerce execution strategies and optimize performance across competing ecosystems.
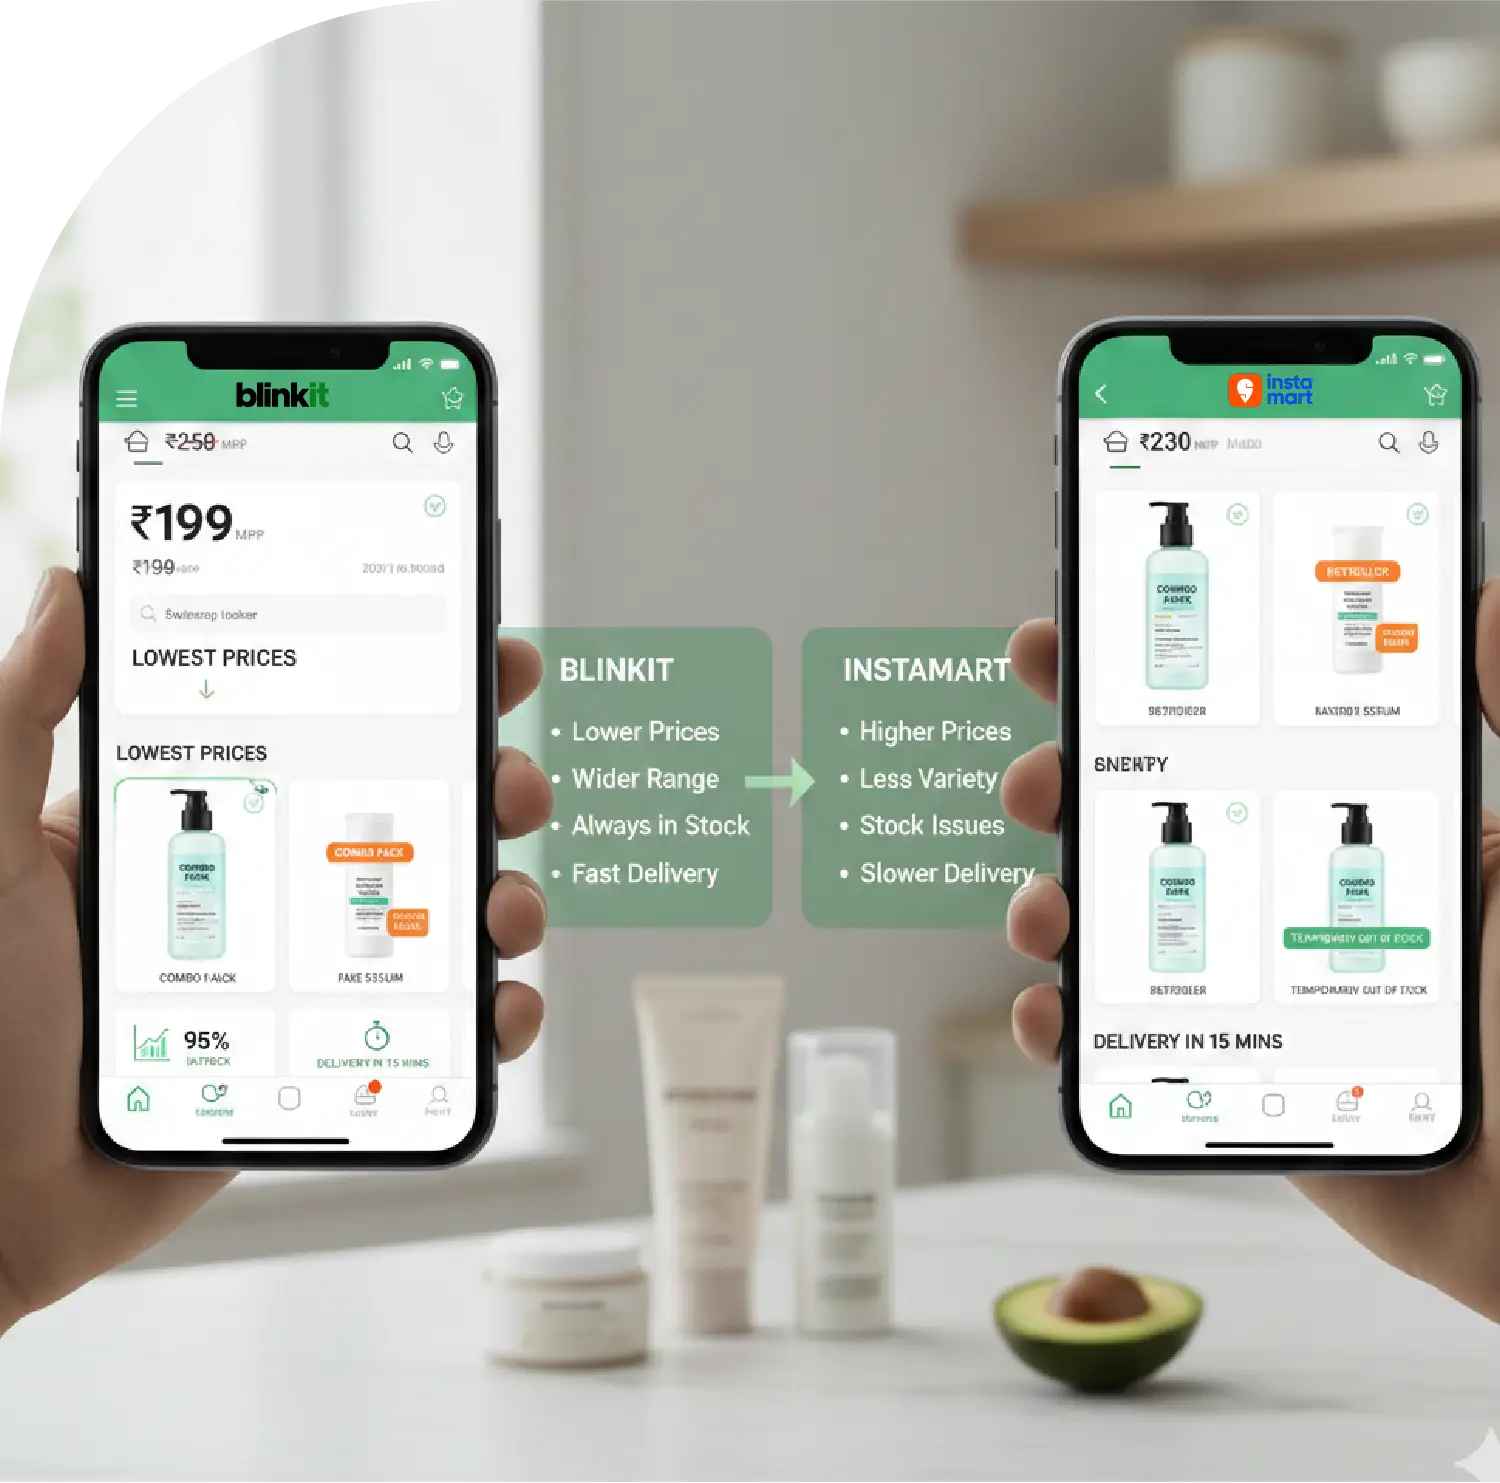
Pricing Leadership: Blinkit maintains consistently lower average selling prices across core skincare categories.
Assortment Depth: Instamart lists a broader SKU range, especially in combo and secondary categories.
Stock Stability: Higher in-stock rates on Blinkit strengthen search ranking and conversion consistency.
Category Dominance: Face care drives the majority of SKU share and repeat purchase behavior.
Delivery Advantage: Faster fulfillment times on Blinkit significantly enhance impulse buying decisions.
India’s quick commerce ecosystem has transformed how beauty brands compete in urban markets. For a science-backed skincare company like Minimalist, performance on fast-delivery platforms is no longer optional — it is a critical growth lever.
This research report presents a detailed analytical study of Minimalist’s performance across Blinkit and Swiggy Instamart, based on structured marketplace data collected between February 1–15, 2026, across Delhi NCR. The analysis framework is powered by method to Scrape Minimalist Data on Instamart vs. Blinkit methodologies to ensure marketplace-level precision.
The study evaluates assortment breadth, pricing logic, discount depth, stock stability, category dominance, digital shelf positioning, and delivery efficiency — offering a comprehensive understanding of how the same brand performs differently across two competing Q-commerce ecosystems. The insights are strengthened through a Minimalist Products Data Scraper on Instamart vs Blinkit, enabling SKU-level tracking and price benchmarking.
In quick commerce, assortment strategy must balance two competing objectives:
Unlike traditional e-commerce, Q-Comm prioritizes high-turnover SKUs over long-tail listings. Using structured systems to Track Minimalist Data Across Instamart & Blinkit, we observed clear operational differences.
| Metric | Blinkit | Instamart |
|---|---|---|
| Total SKUs Listed | 72 | 88 |
| Unique Face Care SKUs | 36 | 39 |
| Hair Care SKUs | 16 | 20 |
| Body Care SKUs | 9 | 13 |
| Kits & Bundles | 11 | 16 |
| In-Stock Rate (Top 30 SKUs) | 95% | 86% |
| In-Stock Rate (All SKUs) | 91% | 83% |
Instamart lists a broader assortment (88 SKUs), particularly in combo packs and secondary categories like body care. However, Blinkit demonstrates stronger stock reliability, especially for top-selling SKUs. These insights emerge from structured efforts to Extract Minimalist Data on Instamart vs. Blinkit across zones.
A wider assortment creates catalog depth, but inconsistent availability weakens shopper trust. Blinkit’s tighter SKU curation combined with higher replenishment accuracy ensures faster velocity for essential items like Vitamin C serums, barrier repair moisturizers, sunscreens, and cleansers.
In quick commerce, efficiency often beats scale — a conclusion reinforced through Web Scraping Minimalist Data on Instamart vs. Blinkit for real-time SKU audits.
Pricing behavior differs structurally between the two platforms. Insights derived from Minimalist Data Extraction on Instamart vs. Blinkit reveal consistent pricing gaps.
| Category | Blinkit Avg. Price (₹) | Instamart Avg. Price (₹) | Price Gap (₹) |
|---|---|---|---|
| Face Care | 479 | 556 | 77 |
| Hair Care | 432 | 503 | 71 |
| Body Care | 361 | 408 | 47 |
| Kits & Combos | 795 | 882 | 87 |
| Overall Average | 497 | 569 | 72 |
Blinkit is cheaper across all categories. The largest pricing gap appears in combo kits.
Instamart maintains higher ASP (Average Selling Price), especially in bundled routines. This pricing intelligence is derived via the Instamart Grocery Delivery Scraping API, allowing structured price comparisons at SKU level.
Blinkit uses competitive pricing to drive faster checkout decisions. Platform-level cost tracking through the Blinkit Grocery Delivery Scraping API highlights stronger tactical pricing alignment.
For shoppers comparing identical SKUs, a ₹70–₹90 difference becomes significant, especially for repeat-use items. Structured Web Scraping Grocery Data confirms that consistent base pricing influences loyalty more than sporadic high discounts.
Discount strategy reveals how aggressively each platform competes for basket share. This layer of analysis is powered by a structured Grocery Delivery Extraction API tracking daily price shifts.
| Discount Bracket | Blinkit (% SKUs) | Instamart (% SKUs) |
|---|---|---|
| 0–5% | 15% | 38% |
| 6–10% | 29% | 36% |
| 11–15% | 33% | 18% |
| 16–20% | 18% | 6% |
| 21%+ | 5% | 2% |
Blinkit applies mid-to-high tier discounts (11–20%) more frequently. Instamart’s majority of SKUs remain under 10% discount. These insights feed into a real-time Grocery Price Dashboard for tactical monitoring.
Blinkit’s effective checkout prices are often ₹90–₹130 lower than Instamart for bundled purchases. Longitudinal tracking via a Grocery Price Tracking Dashboard highlights sustained promotional leadership.
Face care remains the dominant driver of sales across both platforms. Broader Grocery Data Intelligence confirms that high-frequency essentials outperform specialty categories in Q-Comm.
| Category | Blinkit Share | Instamart Share |
|---|---|---|
| Face Care | 50% | 44% |
| Hair Care | 22% | 23% |
| Body Care | 12% | 15% |
| Kits & Combos | 16% | 18% |
While Instamart has more kits, Blinkit prioritizes face-care singles. SKU-level benchmarking using structured Grocery Datasets shows that daily-use categories deliver stronger velocity than occasional routines.
Face-care SKUs show higher search visibility, stronger homepage placements, and better stock consistency — confirming their role as the Q-Comm revenue backbone.
Quick commerce is defined by speed. Even a 5–8 minute difference impacts platform preference.
| Zone | Blinkit Avg. Time | Instamart Avg. Time |
|---|---|---|
| Central Delhi | 10.8 mins | 18.4 mins |
| South Delhi | 12.3 mins | 20.2 mins |
| East Delhi | 13.0 mins | 21.8 mins |
| West Delhi | 11.9 mins | 19.6 mins |
| Overall Average | 12.0 mins | 19.8 mins |
Blinkit maintains sub-13-minute fulfillment across major zones. Instamart averages close to 20 minutes.
In urgent replenishment scenarios — sunscreen before stepping out, cleanser after stock-out — this gap directly influences platform selection. Speed reduces purchase hesitation and increases impulse conversion rates.
Frequent stockouts reduce digital shelf ranking.
Blinkit’s top 20 SKUs remain continuously available for 94% of the observed period. Instamart shows intermittent stockouts in combo kits and secondary variants.
Consistent availability improves search ranking stability, add-to-cart rate, and repeat purchase probability. Stock health is one of the strongest hidden drivers of Q-Comm performance.
Data signals suggest two distinct consumer behaviors:
Blinkit Buyers:
Instamart Buyers:
.The same brand can win differently depending on platform architecture.
Based on comparative analysis:
Structured marketplace tracking across Blinkit and Instamart reveals how platform dynamics shape brand performance beyond pricing alone.
Key findings show:
For skincare brands like Minimalist, quick commerce success depends on precision — not just presence.
Winning in Q-Comm is no longer about being listed everywhere.
It’s about executing better than competitors on pricing clarity, promotion timing, stock reliability, and fulfillment speed — every single day.
Are you in need of high-class scraping services? Food Data Scrape should be your first point of call. We are undoubtedly the best in Food Data Aggregator and Mobile Grocery App Scraping service and we render impeccable data insights and analytics for strategic decision-making. With a legacy of excellence as our backbone, we help companies become data-driven, fueling their development. Please take advantage of our tailored solutions that will add value to your business. Contact us today to unlock the value of your data.

