
Florida’s quick-service restaurant sector in 2026 demonstrates significant concentration among national chains, reflecting both population growth and evolving consumer preferences. Subway, Starbucks, and Dunkin’ dominate the landscape with the highest number of locations statewide, collectively covering nearly half of the top 10 chains. McDonald’s and Domino’s follow closely, maintaining strong urban and suburban presence. Geographic distribution reveals South Florida as the densest cluster, while Central Florida benefits from tourism-driven expansion, and the Panhandle remains comparatively underserved. Urban centers show high brand clustering, particularly for coffee and burger chains, whereas pizza chains focus on suburban delivery zones. The competitive environment emphasizes the importance of strategic location selection, regional saturation, and proximity to high-traffic corridors. Overall, the Florida market exhibits a balance of urban concentration and strategic suburban penetration, reflecting both traditional expansion models and adaptive growth in response to demographic and lifestyle trends.
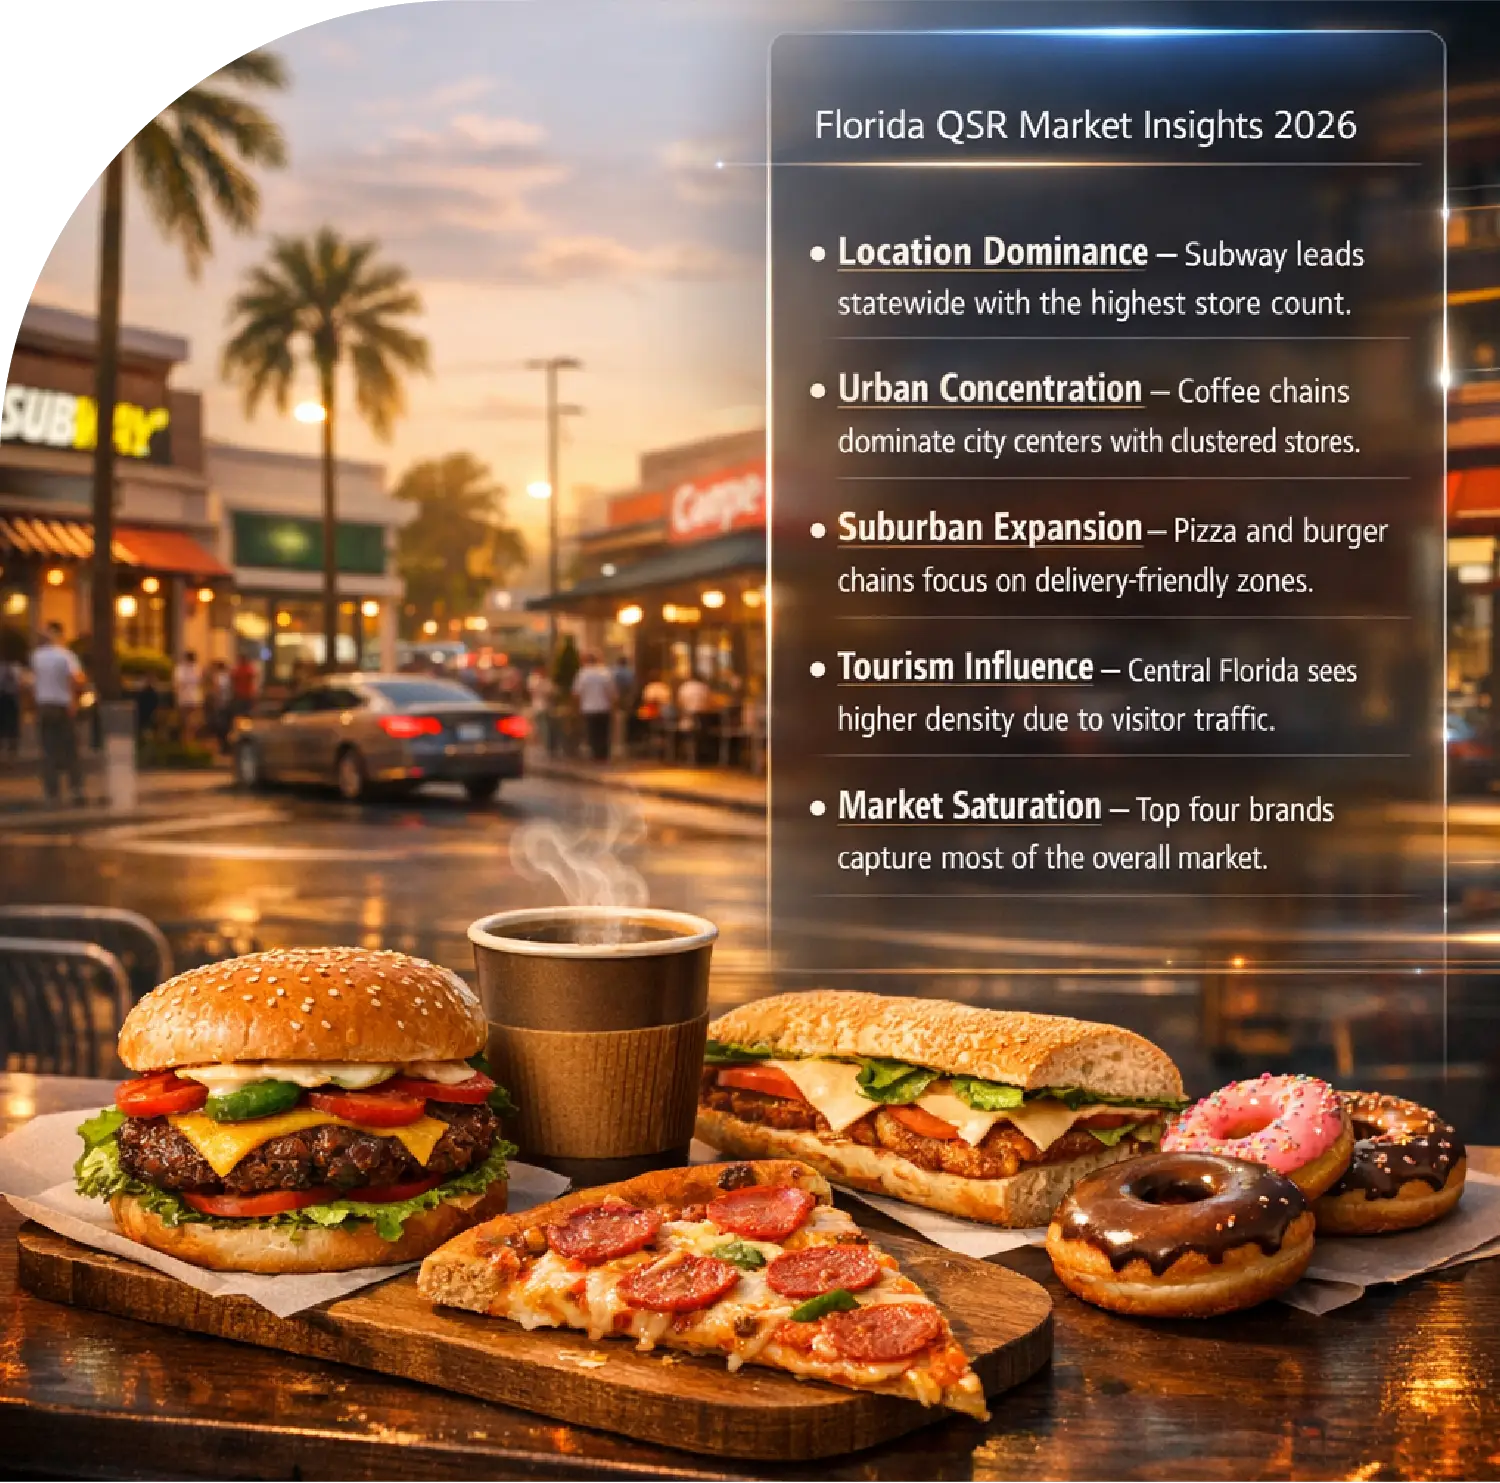
Location Dominance – Subway leads statewide with the highest store count.
Urban Concentration – Coffee chains dominate city centers with clustered stores.
Suburban Expansion – Pizza and burger chains focus on delivery-friendly zones.
Tourism Influence – Central Florida sees higher density due to visitor traffic.
Market Saturation – Top four brands capture most of the overall market.
Florida’s fast-food and quick-service restaurant sector remains one of the most dynamic in the United States. In 2026, brands are expanding aggressively to capture both urban and suburban markets, fueled by tourism, population growth, and a surge in online food delivery demand. This comprehensive report aims to Scrape 10 Largest Food Chains In Florida 2026 - Based On Locations by analyzing store counts, city distribution, regional saturation, and competitive density.
Advanced methodologies are employed to Extract 10 Largest Food Chain Locations Florida 2026, offering insights into geographic distribution, city penetration, and clustering effects. Using Florida Restaurant Chain Location Data Extraction 2026, this study combines POI data, regional mapping, and industry classification to provide actionable intelligence for investors, franchise operators, and delivery platforms.
Florida, with a population exceeding 23 million in 2026, remains a hotspot for quick-service growth due to:
In such a competitive ecosystem, evaluating chains by physical footprint provides a baseline for understanding market dominance and geographic strategy.
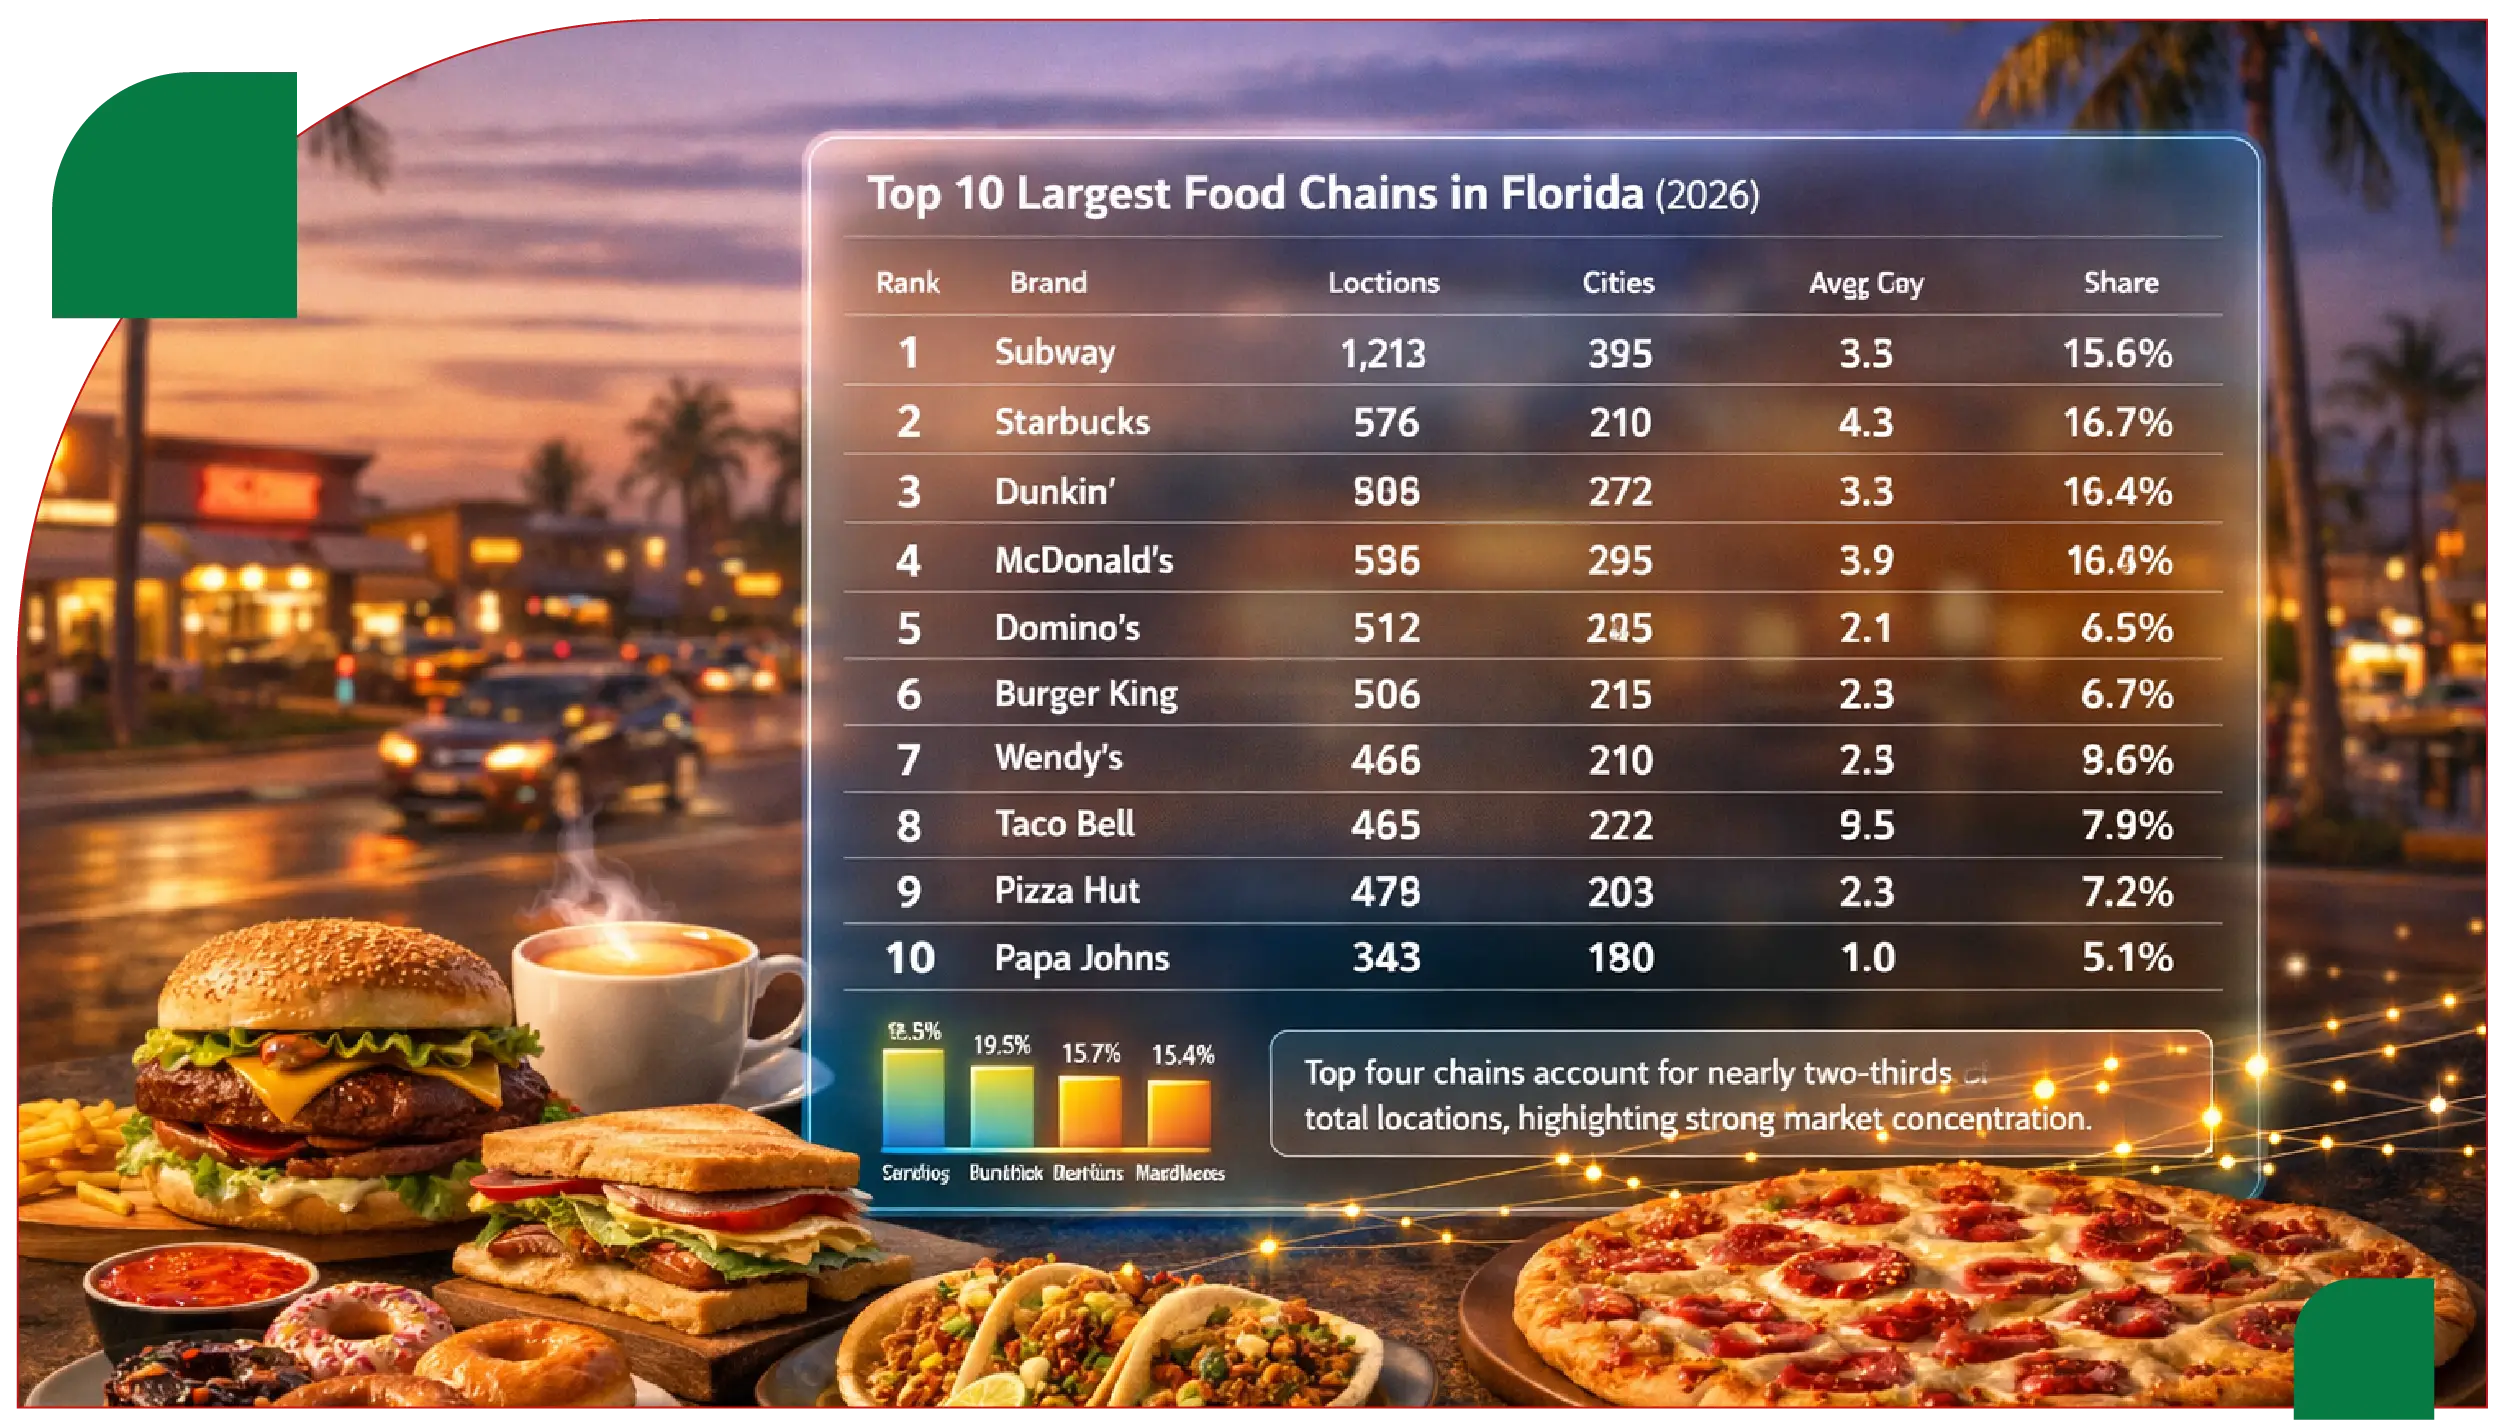
The table below provides a detailed ranking of the ten largest food chains by location count and city presence, reflecting updated 2026 estimates.
| Rank | Brand | Locations (2026) | Cities Present | Avg. Locations per City | % Share of Top 10 |
|---|---|---|---|---|---|
| #1 | Subway | 1,212 | 365 | 3.3 | 19.5% |
| #2 | Starbucks | 978 | 230 | 4.2 | 15.7% |
| #3 | Dunkin' | 960 | 272 | 3.5 | 15.4% |
| #4 | McDonald's | 925 | 285 | 3.2 | 14.9% |
| #5 | Domino's | 512 | 243 | 2.1 | 8.2% |
| #6 | Burger King | 506 | 216 | 2.3 | 8.1% |
| #7 | Wendy's | 498 | 210 | 2.4 | 8.0% |
| #8 | Taco Bell | 492 | 214 | 2.3 | 7.9% |
| #9 | Pizza Hut | 478 | 205 | 2.3 | 7.7% |
| #10 | Papa Johns | 322 | 180 | 1.8 | 5.1% |
Insight: The top four chains account for nearly two-thirds of the total locations, indicating significant market concentration.
This study uses Scraping Top Food Chain Locations In Florida 2026 to monitor brand spread and city-specific saturation.
| Brand | South FL | Central FL | North FL | Gulf Coast | Panhandle | Total |
|---|---|---|---|---|---|---|
| Subway | 350 | 318 | 245 | 210 | 89 | 1,212 |
| Starbucks | 325 | 278 | 178 | 145 | 52 | 978 |
| Dunkin’ | 312 | 270 | 204 | 132 | 42 | 960 |
| McDonald’s | 273 | 248 | 214 | 136 | 54 | 925 |
| Domino’s | 150 | 143 | 108 | 80 | 31 | 512 |
| Burger King | 152 | 140 | 104 | 82 | 28 | 506 |
| Wendy’s | 145 | 138 | 101 | 84 | 30 | 498 |
| Taco Bell | 147 | 133 | 98 | 86 | 28 | 492 |
| Pizza Hut | 138 | 126 | 97 | 84 | 33 | 478 |
| Papa Johns | 92 | 87 | 69 | 50 | 24 | 322 |
Observations:
This research leverages advanced Florida Food Chain Store Location Scraper 2026 frameworks, incorporating:
Using Florida Food Chain Geographic Data Scraping 2026, location data is structured by brand, city, zip code, and regional cluster. Integration with digital ordering platforms enhances analytical insight.
Modern quick-service chains rely on digital ordering to complement physical footprint. Insights from Real-Time Florida Restaurant Locations Scraping allow brands to:
Integration with Web Scraping Food Delivery Data enables extraction of menu variety, pricing, and delivery trends. Meanwhile, the strategy to Extract Restaurant Menu Data ensures visibility of menu differentiation across regions, supporting competitive analysis.
Food Delivery Scraping API technology enables real-time integration with delivery platforms, ensuring structured datasets for franchise and market-level insights. The use of Restaurant Data Intelligence ensures that location and digital ordering data are merged into actionable insights for investors and operational teams.
The 2026 landscape reveals:
Florida’s restaurant sector in 2026 is dominated by chains with high geographic coverage and strong brand recognition. Growth opportunities exist in underserved Panhandle regions and suburban expansions. Integrating location intelligence with delivery and menu analytics enhances competitiveness.
Advanced tools such as Food delivery Intelligence allow chains to anticipate consumer behavior and plan operational strategies. The Food Price Dashboard helps restaurants monitor pricing trends and make competitive adjustments. Structured Food Datasets provide insights into location performance, customer preferences, and market trends. As Florida’s population continues to grow, expanding the physical footprint remains critical for brand visibility. Integration with digital channels ensures efficient ordering, delivery, and customer engagement, supporting long-term market leadership.
If you are seeking for a reliable data scraping services, Food Data Scrape is at your service. We hold prominence in Food Data Aggregator and Mobile Restaurant App Scraping with impeccable data analysis for strategic decision-making.


