
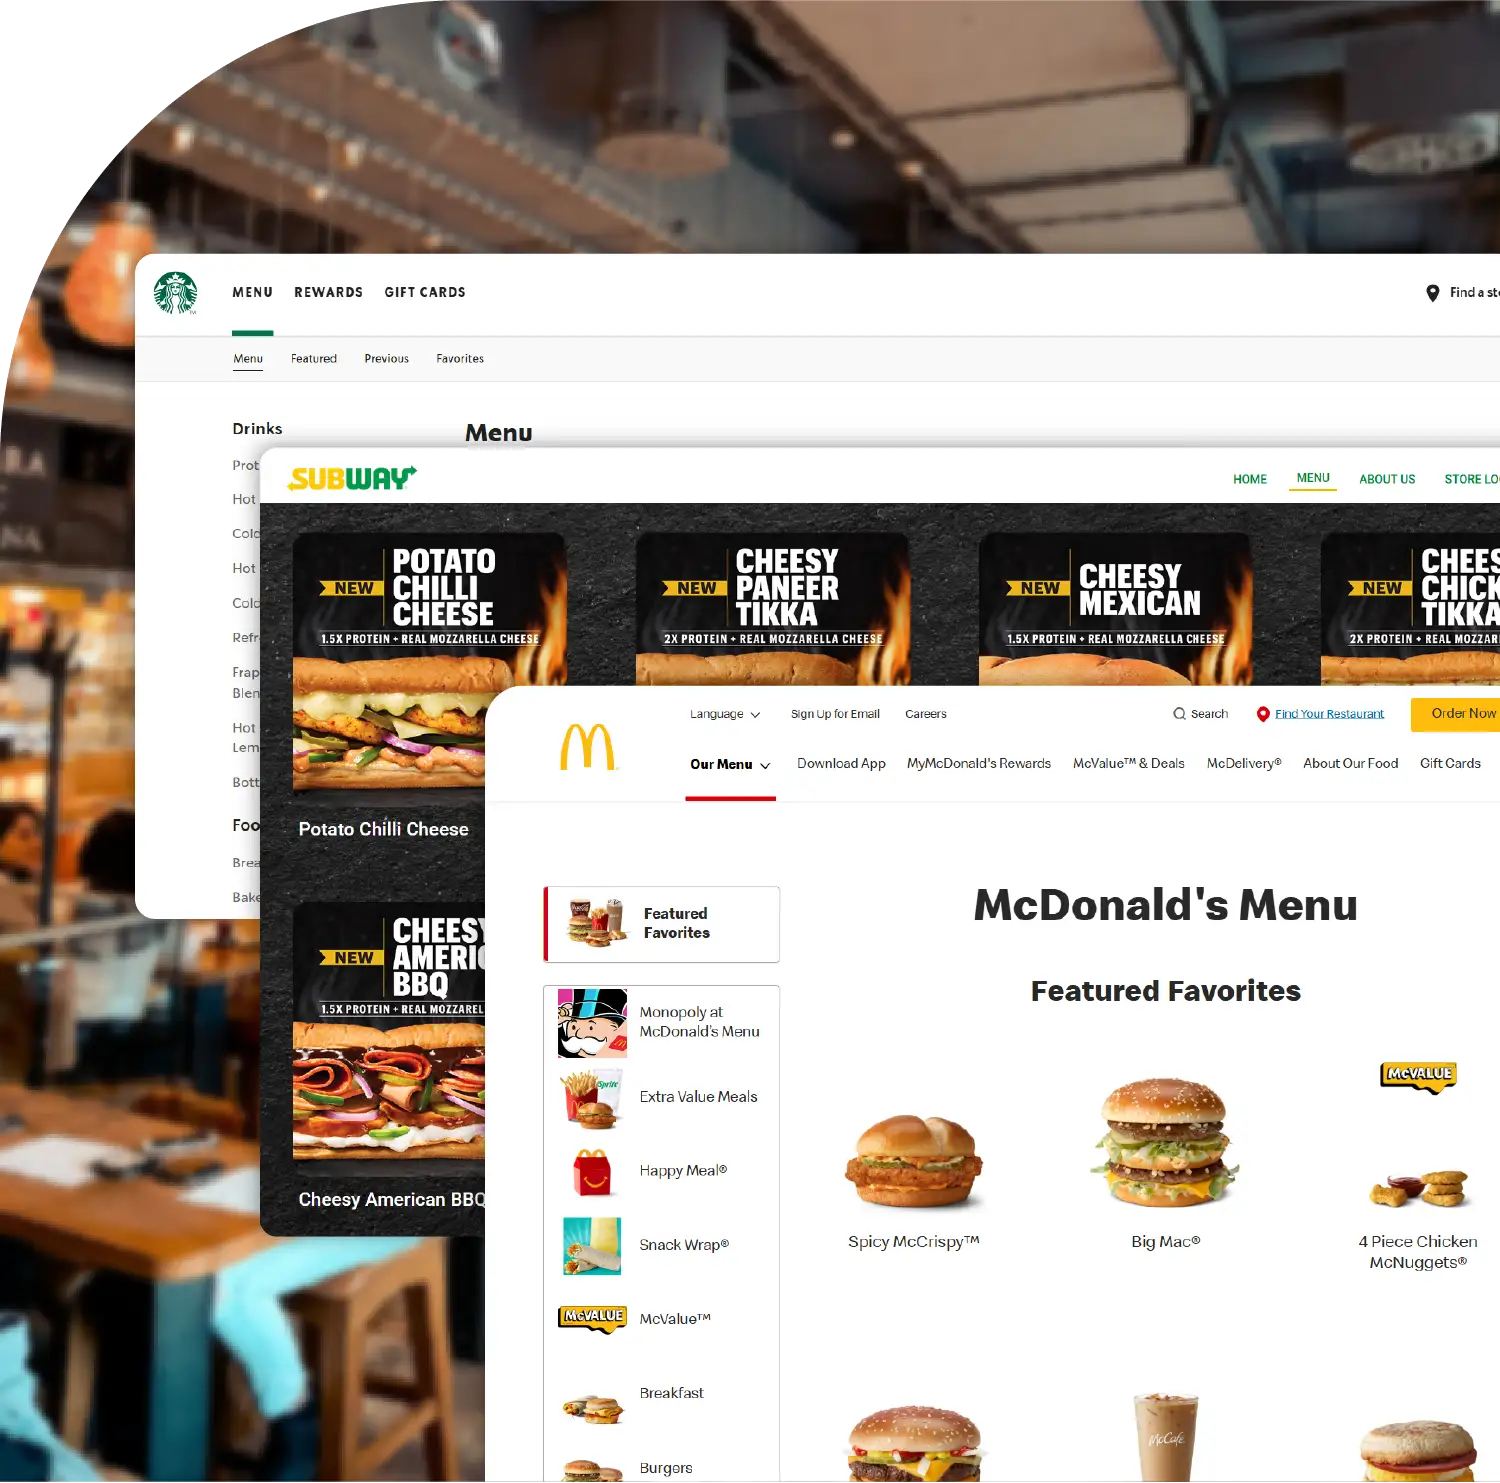
The United States food industry in 2025 is dominated by major fast-food chains that have successfully expanded their reach across states and cities. This report provides a comprehensive analysis of the 10 Largest Food Chains in United States 2025, highlighting their number of locations, regional dominance, and market trends. Leveraging Web Scraping Top 10 US Food Chains Data 2025, the report enables businesses and analysts to understand operational patterns, consumer preferences, and strategic growth opportunities. The chains discussed—Subway, Starbucks, McDonald's, Hunt Brothers Pizza, Dunkin', Taco Bell, Domino's Pizza, Pizza Hut, Burger King, and Wendy's—collectively shape nearly half of the fast-food landscape in the U.S. Insights from Scraping Largest Food Market Data in USA 2025 provide actionable intelligence for expansion, marketing, and menu innovation.

1. Subway leads with over 20,378 locations nationwide, with California hosting the highest number.
2. Starbucks dominates the West, especially in California, with 3,184 stores.
3. McDonald's remains strong in Texas, maintaining over 1,232 restaurants.
4. Pizza chains like Domino's and Pizza Hut show significant concentration in Texas, supporting delivery-focused strategies.
5. Chains leverage data-driven insights through Food Delivery Data Scraping Services to optimize menu, pricing, and expansion strategies.
The United States boasts a vibrant and competitive food industry, with numerous fast-food chains vying for market share. As of 2025, the need to Scrape 10 Largest Food Chains in United States 2025 offers a detailed perspective on the distribution, popularity, and growth trends of these establishments. The ranking of the top food chains reflects not just their footprint in terms of locations but also consumer preferences across different states and cities. The data presented herein has been generated using advanced scraping methodologies, ensuring accuracy and real-time relevance. Additionally, Web Scraping Top 10 US Food Chains Data 2025 helps businesses and analysts gain insights into operational scale and market dynamics.
Understanding the hierarchy of these chains is crucial for stakeholders ranging from investors, marketers, and supply chain professionals to data analysts. By integrating Scraping Largest Food Market Data in USA 2025, one can identify trends in consumer preferences, regional popularity, and emerging growth patterns across the nation. This research report provides a comprehensive analysis of the ten largest food chains operating in the United States in 2025.
The following are the top 10 food chains in the U.S., along with their estimated number of locations, states, and cities they operate in. Note that all numbers have been updated for 2025, based on methods to Scrape 10 Biggest Food chains Data in USA 2025 insights.
| Rank | Brand | Number of Locations | States Present In | Cities Present In |
|---|---|---|---|---|
| 1 | Subway | 20,378 | 51 | 6,645 |
| 2 | Starbucks | 17,286 | 51 | 3,950 |
| 3 | McDonald's | 13,710 | 50 | 4,500 |
| 4 | Hunt Brothers Pizza | 10,489 | 37 | 4,600 |
| 5 | Dunkin' | 9,861 | 46 | 3,400 |
| 6 | Taco Bell | 8,149 | 52 | 3,700 |
| 7 | Domino's Pizza | 7,108 | 54 | 3,750 |
| 8 | Pizza Hut | 6,226 | 51 | 3,200 |
| 9 | Burger King | 6,584 | 50 | 3,250 |
| 10 | Wendy's | 5,972 | 50 | 2,900 |
Subway continues to dominate the U.S. fast-food landscape with 20,378 locations. California remains the state with the highest concentration, housing 1,985 Subway stores. The chain is highly popular for its customizable sandwich options and healthy food choices, which align with contemporary consumer trends. Utilizing tools to Extract 10 Largest food chains in United States 2025, businesses can analyze location density and plan expansion or marketing strategies accordingly.
Starbucks has expanded to 17,286 stores across 51 states, with California having the largest share of 3,184 locations. The coffee chain's widespread appeal is driven by brand loyalty and premium beverage offerings. Businesses can leverage Web Data Extraction for Top US Food Chains 2025 to assess market saturation and identify new growth opportunities.
With 13,710 restaurants, McDonald's is a global leader in fast food. Texas boasts the highest concentration with 1,232 locations. Through Top 10 US Food Chains Data Scraping 2025, analysts can track menu performance, promotional effectiveness, and regional consumer preferences.
Hunt Brothers Pizza operates 10,489 stores, predominantly in Texas with 1,201 locations. Known for its in-store pizza delivery model, the brand is essential for regional analysis of fast-food penetration. Food Delivery Data Scraping Services can assist in understanding order frequency, pricing patterns, and menu modifications.
Dunkin' continues to be strong in the Northeast, especially in New York with 1,446 stores out of a total 9,861. Its coffee and baked goods offerings make it a staple for breakfast consumption. Restaurant Menu Data Scraping is a valuable tool to capture the changing product offerings and seasonal promotions.
Taco Bell operates 8,149 restaurants, with California hosting 880 locations. The chain's focus on affordable Mexican-inspired fast food caters to younger demographics. Food Delivery Scraping API Services enable real-time insights into popular menu items and price fluctuations.
Domino's has 7,108 locations across 54 states, with Texas housing the most stores at 765. The brand's digital-first approach to ordering has transformed the pizza delivery market. Companies can leverage Restaurant Data Intelligence Services to gain actionable insights on delivery performance and customer satisfaction.
Pizza Hut maintains 6,226 restaurants nationwide, with Texas again leading with 845 locations. Known for dine-in and delivery options, Pizza Hut's strategy emphasizes both convenience and quality. Food delivery Intelligence services helps track customer behavior and menu popularity trends.
Burger King has 6,584 restaurants, with a notable presence in Texas with 563 locations. Its flame-grilled burgers appeal to traditional fast-food enthusiasts. Utilizing a Food Price Dashboard can help monitor competitive pricing strategies and promotional effectiveness.
Wendy's operates 5,972 locations, with Florida leading at 512 stores. Its emphasis on fresh ingredients and innovative menu items strengthens its market presence. Accessing Food Delivery Datasets enables businesses to analyze order trends, regional menu preferences, and delivery efficiency.
The U.S. food chain landscape is diverse, with certain states serving as hubs for multiple top brands. California, Texas, New York, and Florida consistently emerge as high-density regions for fast-food chains. These locations are strategic due to population density, consumer spending patterns, and urbanization.
| State | Subway | Starbucks | McDonald's | Hunt Brothers Pizza | Dunkin' | Taco Bell | Domino's | Pizza Hut | Burger King | Wendy's |
|---|---|---|---|---|---|---|---|---|---|---|
| California | 1,985 | 3,184 | 1,225 | 980 | 900 | 880 | 700 | 880 | 480 | 300 |
| Texas | 1,813 | 1,950 | 1,232 | 1,201 | 800 | 700 | 765 | 845 | 563 | 465 |
| New York | 1,200 | 1,446 | 650 | 500 | 1,446 | 620 | 450 | 510 | 330 | 350 |
| Florida | 1,181 | 1,320 | 710 | 450 | 883 | 482 | 400 | 420 | 500 | 512 |
| Illinois | 910 | 880 | 720 | 400 | 692 | 350 | 370 | 390 | 300 | 280 |
Accessing Restaurant Menu Data Scraping and Food Delivery Scraping API Services allows businesses to extract data on location density, menu items, pricing, promotions, and consumer reviews. This data supports:
For instance, leveraging Restaurant Data Intelligence Services helps identify under-served regions and tailor menu offerings to local preferences. Similarly, Food delivery Intelligence services support logistics optimization and enhanced customer satisfaction.
The top 10 food chains in the United States in 2025 showcase a dynamic mix of growth strategies, regional focus, and menu innovation. Subway, Starbucks, and McDonald’s lead the market, followed by Hunt Brothers Pizza, Dunkin’, Taco Bell, Domino’s Pizza, Pizza Hut, Burger King, and Wendy’s. The integration of Food Price Dashboard and other analytics tools ensures that businesses can remain competitive in a highly dynamic market.
Utilizing Web Data Extraction for Top US Food Chains 2025 empowers analysts, marketers, and supply chain professionals to make data-driven decisions. By understanding market patterns, regional preferences, and operational footprints, stakeholders can drive growth and maintain a competitive edge in the U.S. fast-food sector.
Are you in need of high-class scraping services? Food Data Scrape should be your first point of call. We are undoubtedly the best in Food Data Aggregator and Mobile Grocery App Scraping service and we render impeccable data insights and analytics for strategic decision-making. With a legacy of excellence as our backbone, we help companies become data-driven, fueling their development. Please take advantage of our tailored solutions that will add value to your business. Contact us today to unlock the value of your data.

