Last week, we observed the opening of yet another sushi restaurant in the vicinity. Upon browsing the Thuisbezorgd platform for the postal code, we discovered 11 restaurants offering sushi delivery. It is a significant competition considering the population of Gouda, which is around 70,000 residents. This situation sparked our curiosity, leading us to ponder the following question:
- Are there areas where sushi is not available for delivery through Thuisbezorgd?
- Which location has the highest concentration of sushi restaurants?
- Do customers generally enjoy the sushi they order?
This project aligns perfectly with our interests, allowing us to scrape data from Thuisbezorgd.nl. We will convert numerous HTML pages into a usable (semi-)structured data source, enabling us to explore and analyze the data using Power BI. First, let’s examine the findings before delving into the technical aspects.
Results
Are there any locations where Thuisbezorgd does not deliver sushi?
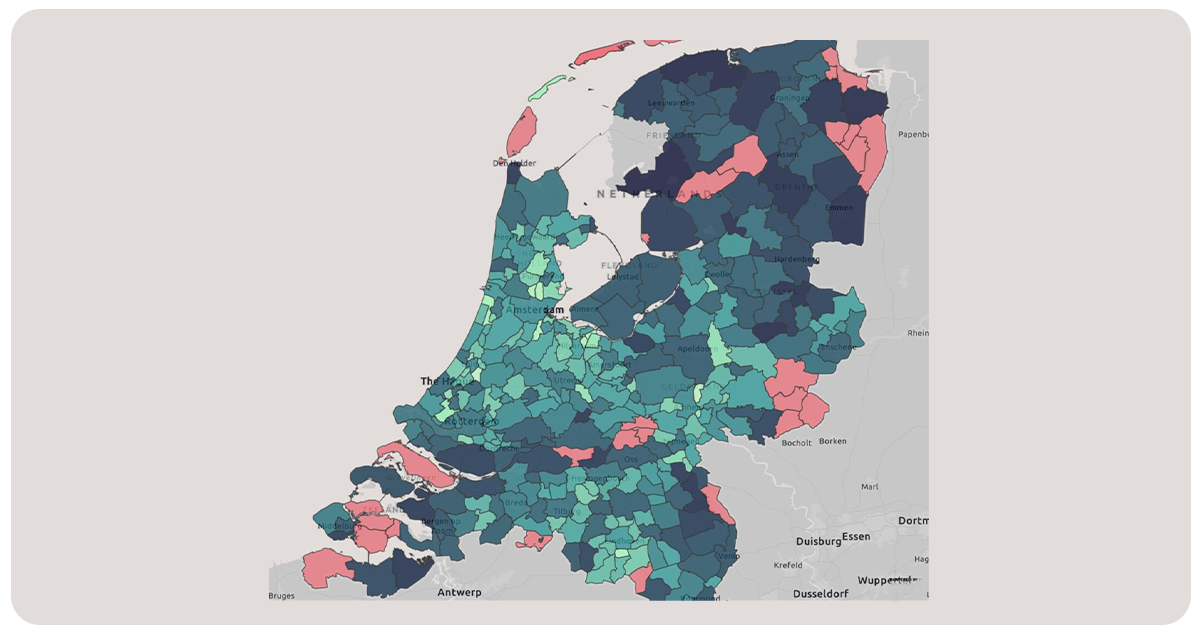
By web scraping data from Thusisbezorgd, we found certain areas where sushi delivery is unavailable through thuisbezorgd. These areas are in green or blue colors on the map. With the exception of Schiermonnikoog, all municipalities have at least one restaurant listed on Thuisbezorgd but do not offer sushi delivery. Zaltbommel, a city with nearly 12,000 residents, stands out as an ideal location for opening a sushi shop on Thuisbezorgd, as it currently has no competition in sushi delivery. Scrape restaurant data API to check whether other areas without sushi delivery options are primarily located near the German border and in sparsely populated provinces such as Zeeland and Friesland.
Where is the highest number of sushi restaurants?
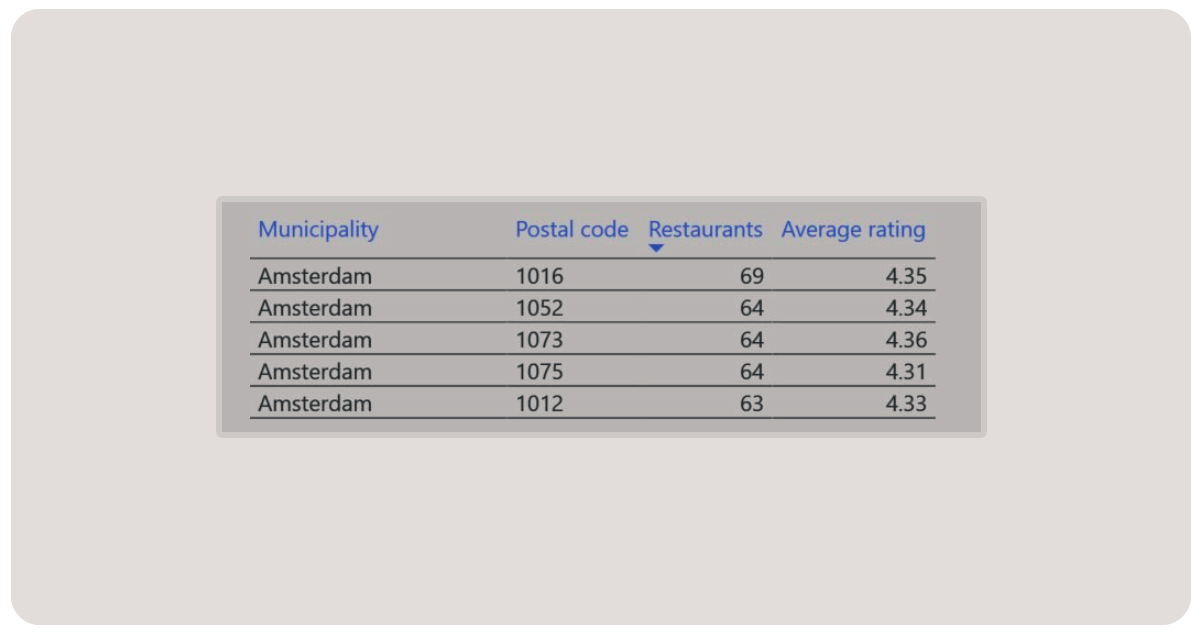
In the specific 1054 postal code area of Amsterdam, located around Overtoom/Vondelpark, an impressive selection of 75 sushi restaurants, is available for delivery. With such many options, if you were to order sushi once a week, it would take you over 1.5 years to try every restaurant. Interestingly, by the time you complete this cycle, new sushi spots will likely emerge, allowing you to embark on the culinary journey again..
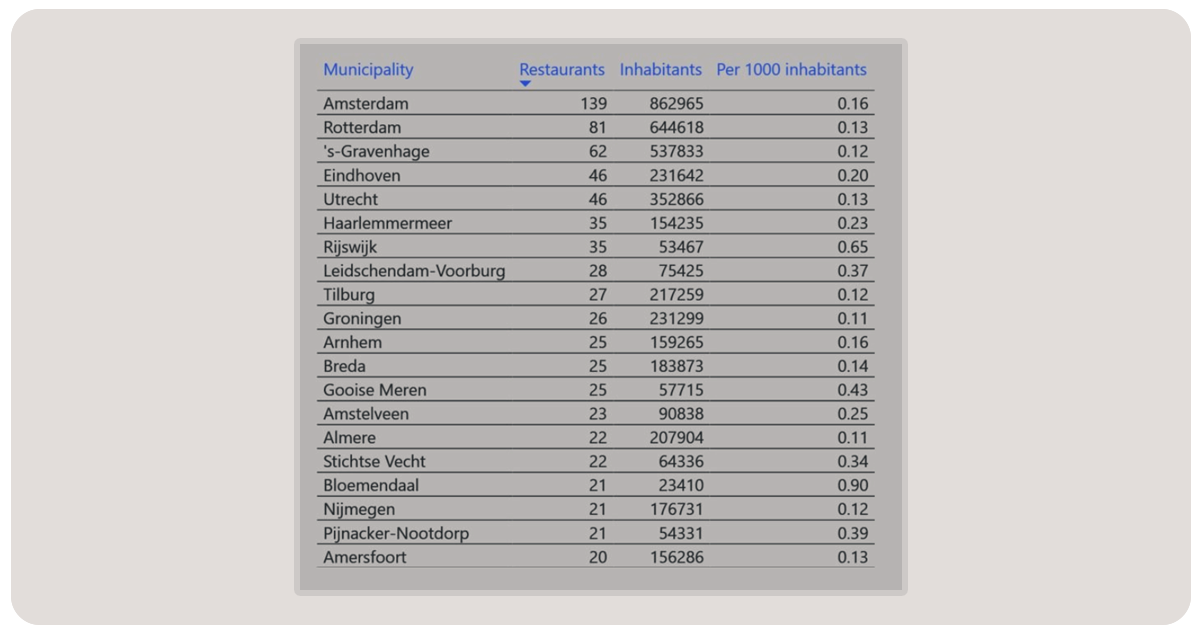
When examining the data at the municipality level, it becomes apparent that the top 10 cities with the highest number of sushi delivery options include significant cities from the Randstad area, such as Amsterdam and Rotterdam, as well as cities from the southern region, like Eindhoven and Tilburg. Interestingly, numerous smaller municipalities near larger cities also rank high. It's important to note that the data is on delivery options within specific postal codes and not the physical location of the restaurants. As a result, a restaurant situated in one municipality but delivering to multiple nearby areas can contribute to the restaurant count in each area, potentially leading to double counting.
Is the sushi we order through delivery services delightful?
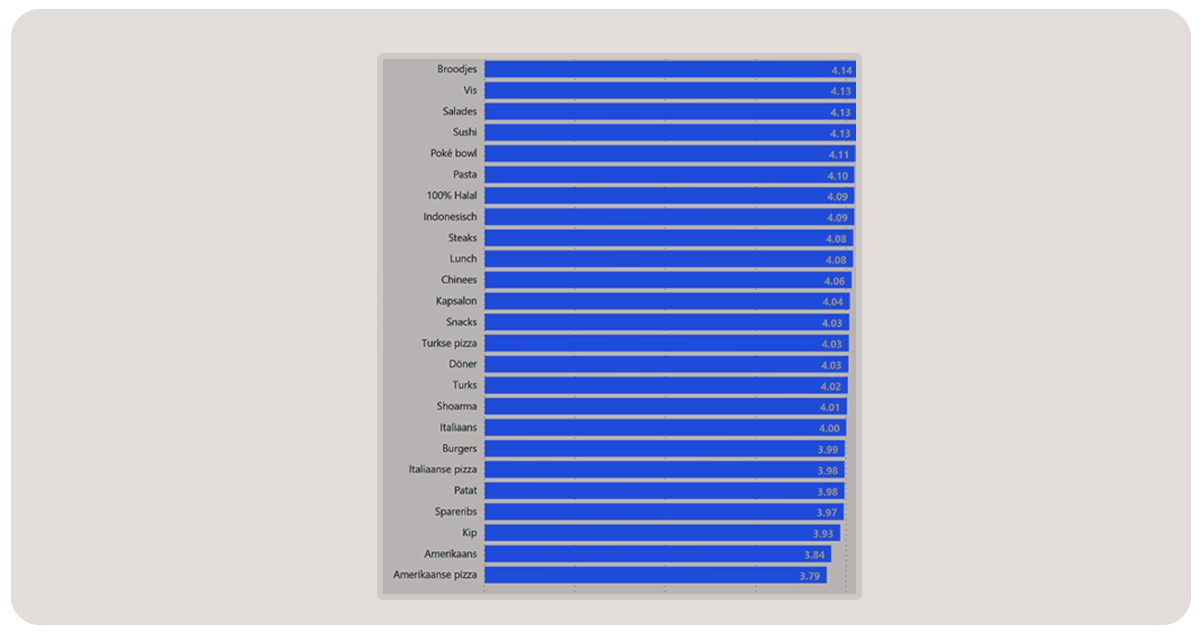
According to the review data, it is evident that people genuinely enjoy sushi as a type of food. On average, sushi restaurants receive a high rating of 4.13, placing them among the top-rated options. Moreover, the overview of average ratings per kitchen or food type suggests that certain foods are more suitable for delivery than others. Foods less affected by
temperature changes and the passing of time tend to receive better ratings. For instance, food types like "patat" (fries) and categories like Italian pizza, burgers, and American food generally receive poorer ratings. Focusing on the top 25 food types based on the number of restaurants serving them makes it apparent that cuisines like Indian food and curry also rank high on the list of suitable options for delivery.Data Collection
From the outset, we anticipated data collection would pose a significant challenge. The initial step involves understanding the structure of the Thuisbezorgd website and scraping Thuisbezorgd sushi restaurant data. When entering an address on Thuisbezorgd, the platform redirects you to a page displaying restaurants that deliver to your specified area. For instance, if you search for restaurants delivering to the address "Dam 1, Amsterdam," you are directed to the page featuring restaurants for the Amsterdam-1012 area. The numerical value represents the first four digits of the postal code corresponding to the provided address.
Our Plan:
To accomplish the project objectives, we can follow the following steps:
- Obtain a comprehensive list of all postal codes in the Netherlands by scraping sushi restaurant data.
- Download the HTML page from Thuisbezorgd for each postal code on the list.
- Convert the individual HTML pages into a unified JSON file for more straightforward data processing.
- Load the JSON file into Power BI and create a structured data model.
- Utilize Power BI to explore and analyze the data, deriving insights and answers to our questions regarding sushi delivery and customer experiences.
List Of Data Fields
- Name
- Kitchens
- Data_url
- Restaurant Id
- Worst Rating
- Rating Value
- Review Count
- Delivery Cost
- Average Delivery Time
Scraping Thuisbezorgd
Scrape Thuisbezorgd restaurant data to obtain a comprehensive list of all postal codes is straightforward, as the Central Bureau of Statistics (CBS) offers a suitable DataFeed for our needs. A Python function can retrieve the postal codes and extract the first four digits, compiling them into a list to extract the necessary information. This list of postal codes serves as the input for the subsequent web scraping process.
The web scraper, implemented using Selenium, follows a simple flow. Although we won't delve into the details, it involves the following steps:
The web scraping process using Selenium to collect the HTML pages from Thuisbezorgd.nl can be summarized as follows:
- Navigate to Thuisbezorgd.nl using the web driver.
- Use the .send_keys() method to enter the postal code and press the enter key to initiate the search.
- Allow a 6-second delay to ensure the entire page appears correctly.
- Save the page source in a folder structure, such as "results/{postal_code}.html."
- Return to Thuisbezorgd.nl and repeat the process for the following postal code.
- Following these steps, we can systematically collect the HTML pages for each postal code from Thuisbezorgd.nl.
- Thuisbezorgd's lack of pagination in their results simplifies the web scraping process by removing one obstacle to tackle. Instead of extracting and storing the required information as JSON, I initially opted to store the raw individual HTML pages. This approach offers flexibility, allowing me to extract additional data elements later without revisiting all 4,000 pages. This decision prevented the need to rerun the process, which took nearly 7 hours (calculating 4000 pages * 6 seconds waiting time, totaling approximately 24,000 seconds or 6.7 hours). Remembering all essential attributes during extraction is crucial, as it would necessitate restarting the entire 7-hour process. Let's ensure that doesn't happen.
Converting 4000+ HTML Files to JSON
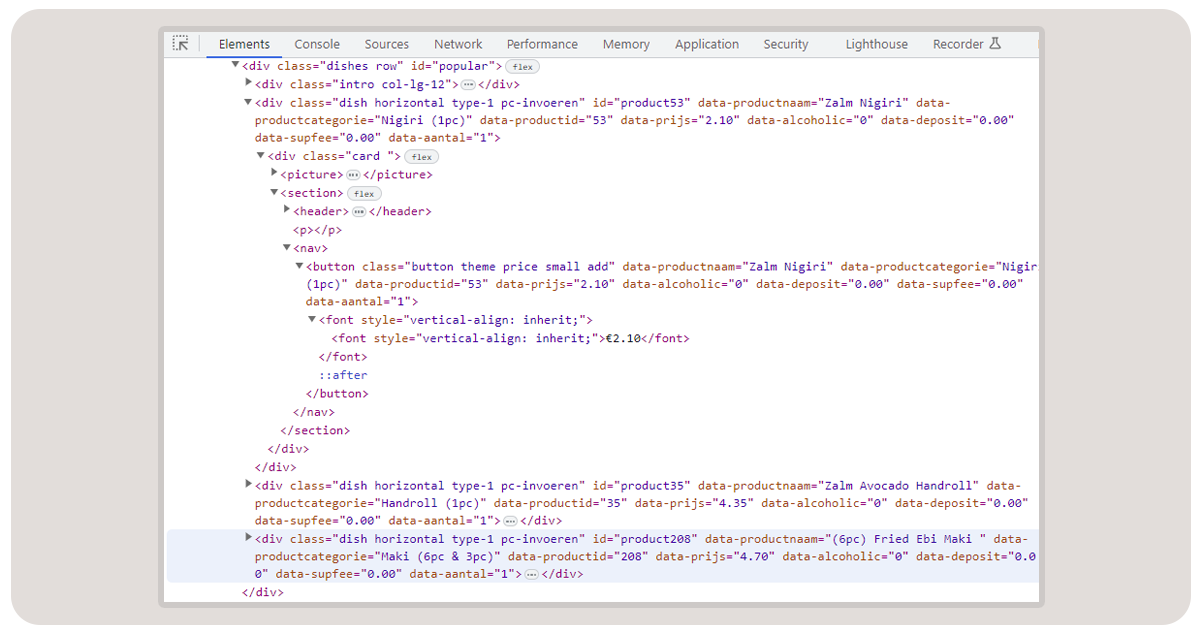
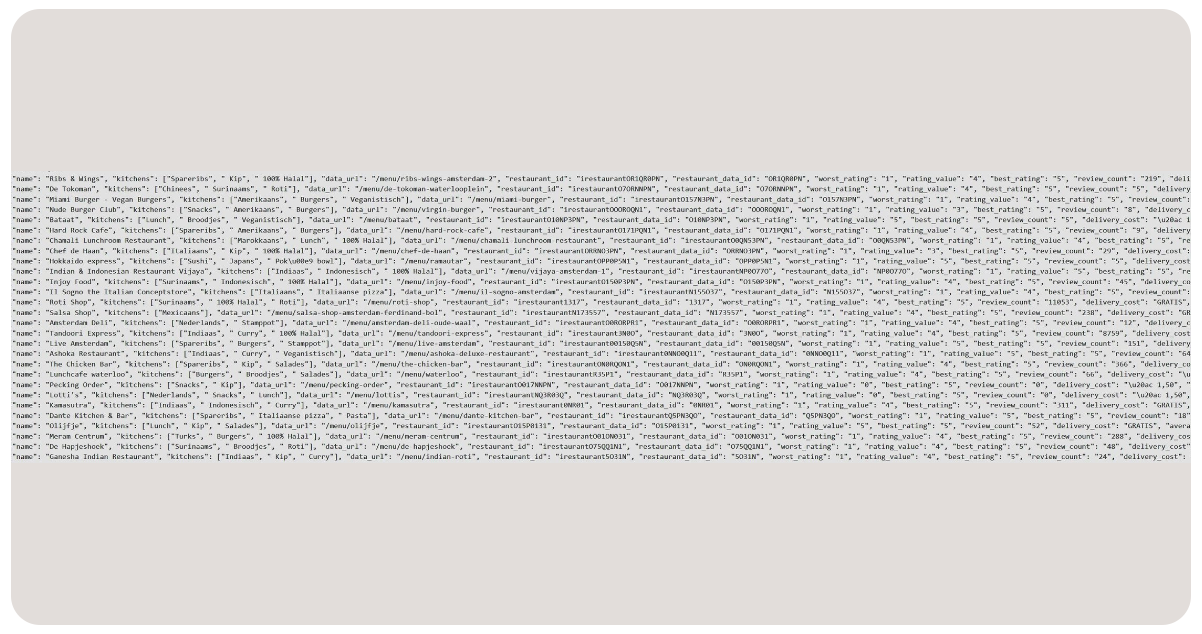
The web scraper implemented using Selenium successfully generated more than 4,000 HTML files. Each HTML file corresponds to a specific four-digit postal code and contains the complete page of search results from Thuisbezorgd. Below is an HTML snippet representing a restaurant element on the Thuisbezorgd website. The required information for our analysis is available from this snippet.
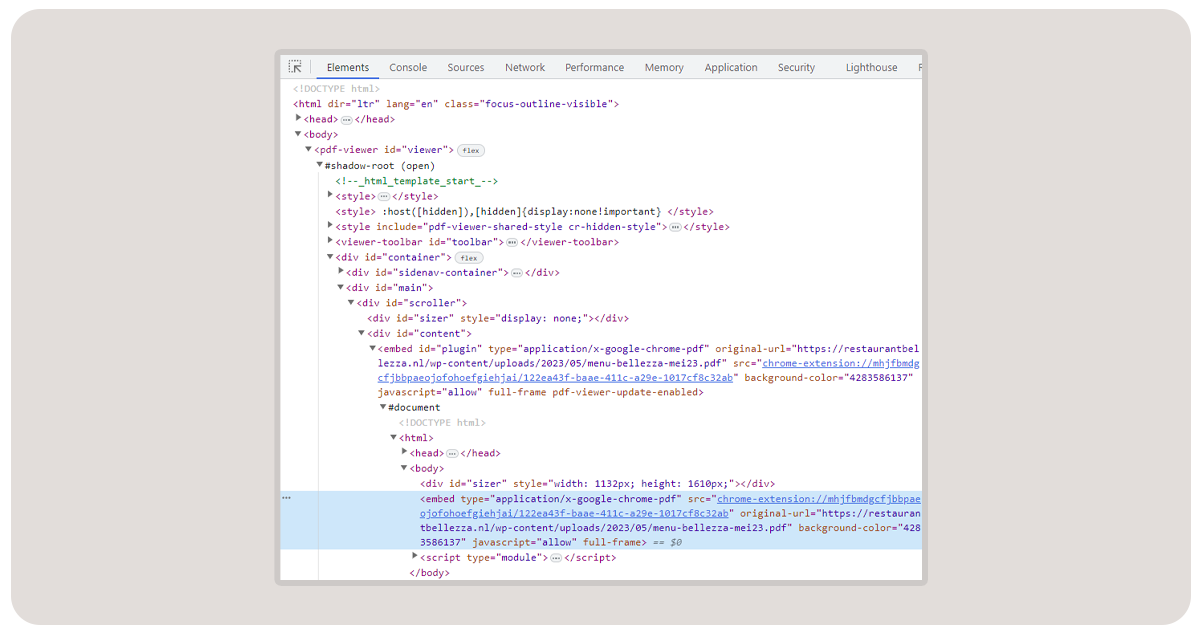
Scrape restaurant and food data using the BeautifulSoup library, which allows for parsing data from HTML or XML files. In this case, extract_restaurant_data function process the HTML snippet. Each HTML page may contain zero or more restaurants. The extract_html_file function reads the file and creates a BeautifulSoup object. By employing the findAll function, all restaurants are available from the HTML source. The extract_restaurant_data function is executed for each restaurant, returning a dictionary that encompasses the desired data elements.
To summarize:
- The BeautifulSoup library is helpful for data extraction.
- The extract_html_file function reads the HTML file and creates a BeautifulSoup object.
- All restaurants are available using the findAll function.
- The extract_restaurant_data function is applied to each restaurant, returning a dictionary with the desired data elements.
The process involves iterating over the files in the "results" directory generated by the web scraper to create the JSON file. Remove previously processed files from this iteration. The ability to resume data processing from where it left off is incorporated to account for any potential crashes or interruptions. Save the data using the JSON Lines format, where each line in the file represents a new JSON object. This format is compatible with various technologies such as Power BI and Big Data platforms like Spark. Additionally, a line prints the progress, providing visibility in the terminal on the script's processing status.
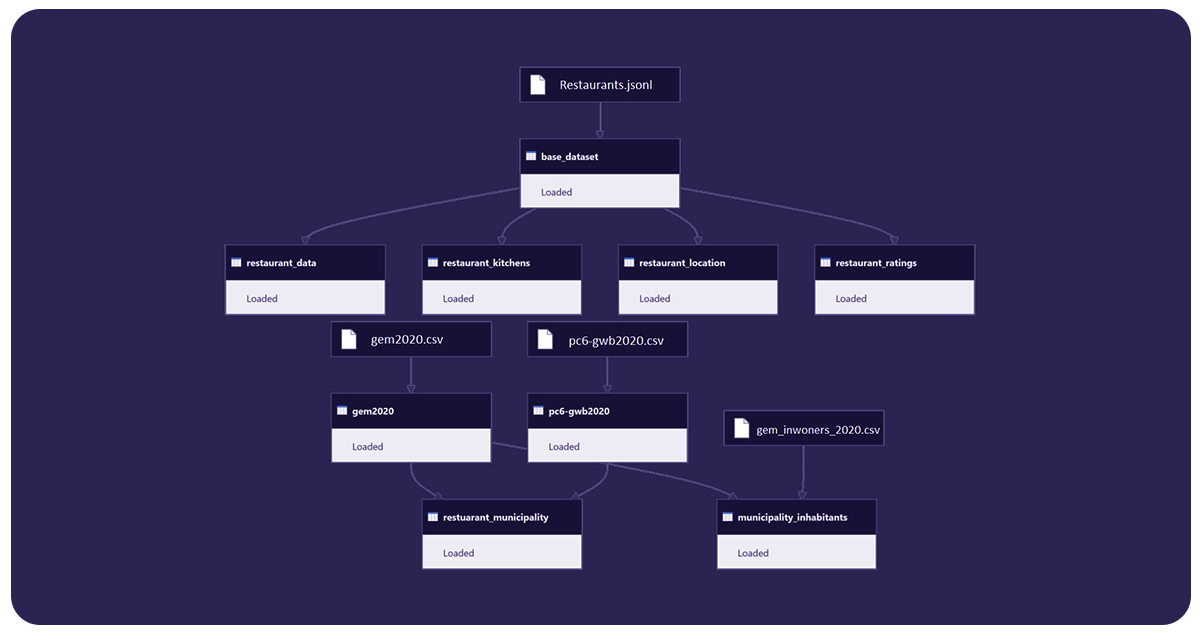
Power BI Data Model
The model consists of four source files:
- restaurants.jsonl: Contains all the data extracted from Thuisbezorgd.
- gem2020.csv: Municipality data, including names and keys.
- pc6-gwb2020.csv: Postal codes and their corresponding municipalities.
- gem_inwoners_2020.csv: Population data for each municipality.
The CBS data is in the sources mentioned above.
The model development process involved transforming the data from the restaurants.jsonl file into the base_dataset, where the JSON structure is into columns. It provided a structured foundation for further analysis. From the base_dataset, four separate datasets were to form the comprehensive model. One of these datasets focused explicitly on capturing information about kitchens. For this, the list of kitchens was expanded into new rows, resulting in a table where each row contained a unique combination of restaurant ID and corresponding kitchen name. It facilitated more granular analysis and insights into the culinary offerings of the restaurants within the dataset.
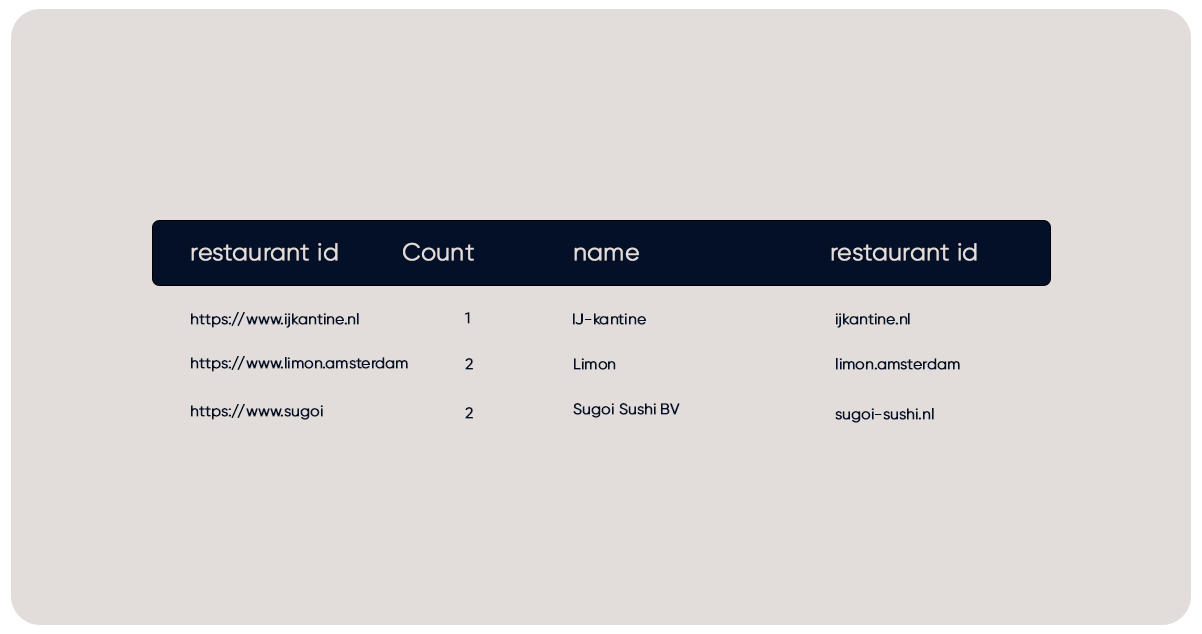
Primary Keys?
Regardless of the data source, encountering data quality issues is not uncommon. In this case, the restaurantid would be unique. However, this assumption revises upon selecting the distinct combination of restaurant_id and name. Further investigation revealed that some restaurants had undergone recent renaming, possibly occurring during the 7-hour data processing job. Given the large number of nearly 10,000 unique restaurants, it is unsurprising that a few minor edits occurred within a 7-hour. This situation is particularly plausible due to the current circumstances, with many new restaurants emerging in response to restrictions on indoor dining. Addressing and handling such data quality issues is essential to data analysis and requires appropriate strategies and measures to ensure accurate and reliable insights.
Data Model
After resolving the issue by filtering out the four duplicate keys, we have temporarily addressed the problem. We may revisit it later if the dataset continues to be enjoyable to work with. The concept of "kitchen" denotes the different types of cuisines or products a restaurant offers. The term "kitchen" may seem unconventional from a traditional definition standpoint, but it is from the source HTML. Interestingly, a restaurant can have multiple kitchens, a mix of actual cuisines and products. However, there appears to be a limitation on the number of kitchens a restaurant can select when selling through Thuisbezorgd, with a maximum of three.
Consequently, restaurants must strategically choose their kitchens to optimize their visibility in customer searches. For instance, if a restaurant offers sushi along with poke bowls and snacks, including "Japanese" as a kitchen may not be necessary, as sushi itself is indicative enough. The rest of the data model is relatively straightforward. The "restaurant_location" table resolves the many-to-many relationship between the municipality and the restaurant. At the same time, the "municipality_inhabitants" field calculates the restaurant count per 1000 inhabitants, providing additional insights into the density of dining options within each municipality.

Conclusion: The prevalence of sushi restaurants in the Netherlands extends beyond just Gouda, making the situation familiar to that particular city. Interestingly, Gouda and Amsterdam have an equal ratio of 0.16 sushi restaurants delivering within the municipality per 1000 inhabitants. Another surprising observation is the widespread availability of sushi across the entire country. Nearly all municipalities offer the option to order sushi, with only a few exceptions typically found in densely populated areas. However, it's important to note that this dataset only covers Thuisbezorgd, and local sushi establishments may need to be more active on the platform. Additionally, a restaurant can sell sushi without explicitly listing it as one of their "kitchens," although from a marketing perspective, this might be considered a missed opportunity.
For further details, contact Food Data Scrape now! You can also reach us for all your Food Data Aggregator and Mobile Restaurant App Scraping service requirements.
Get a Free Food Data Sample in 48 Hours.
Tell us your platforms, target markets and required fields — we'll map exactly what's possible with food data scraping, recommend the right approach, and send a working sample so you can verify quality before any commitment.
Request a strategy call
Thanks — our data team will reach out within 48 hours with your sample.

