
India’s rapidly evolving quick-commerce sector is transforming consumer purchasing expectations, driven by the demand for near-instant delivery and expanding dark-store infrastructure across metropolitan and Tier-2 regions. The shift from planned weekly shopping to real-time ordering has reshaped consumption behaviour and amplified the need for granular retail intelligence. Real-time insights into fast-moving products, emerging categories, promotional impact, and inventory dynamics are becoming essential for data-driven strategic execution among FMCG brands, retailers, and delivery platforms.
The report explores the rising significance of SKU-level and category-level visibility to understand shifting product velocity and demand fluctuations influenced by festivals, pricing changes, lifestyle transitions, and seasonal trends. It highlights how market forecasting, assortment planning, and competitor benchmarking can significantly improve profitability and operational efficiency. With industry growth projections reaching multi-billion-dollar scale by 2027, businesses equipped with advanced analytics and decision-automation tools are best positioned to capture accelerated opportunity in India’s fast-expanding instant-delivery market.

Market Acceleration: Explosive growth driven by real-time delivery convenience and impulse-based category expansion.
Category Momentum: Strong demand across snacks, beverages, dairy, household essentials, and beauty segments.
SKU Growth Trends: Performance insights show distinct patterns between daily essentials and lifestyle-driven purchases.
Analytical Advantage: Category-level intelligence enables better forecasting, portfolio optimization, and pricing decisions.
Future Outlook: Multi-year double-digit expansion indicates long-term scalability and competitive advancement.
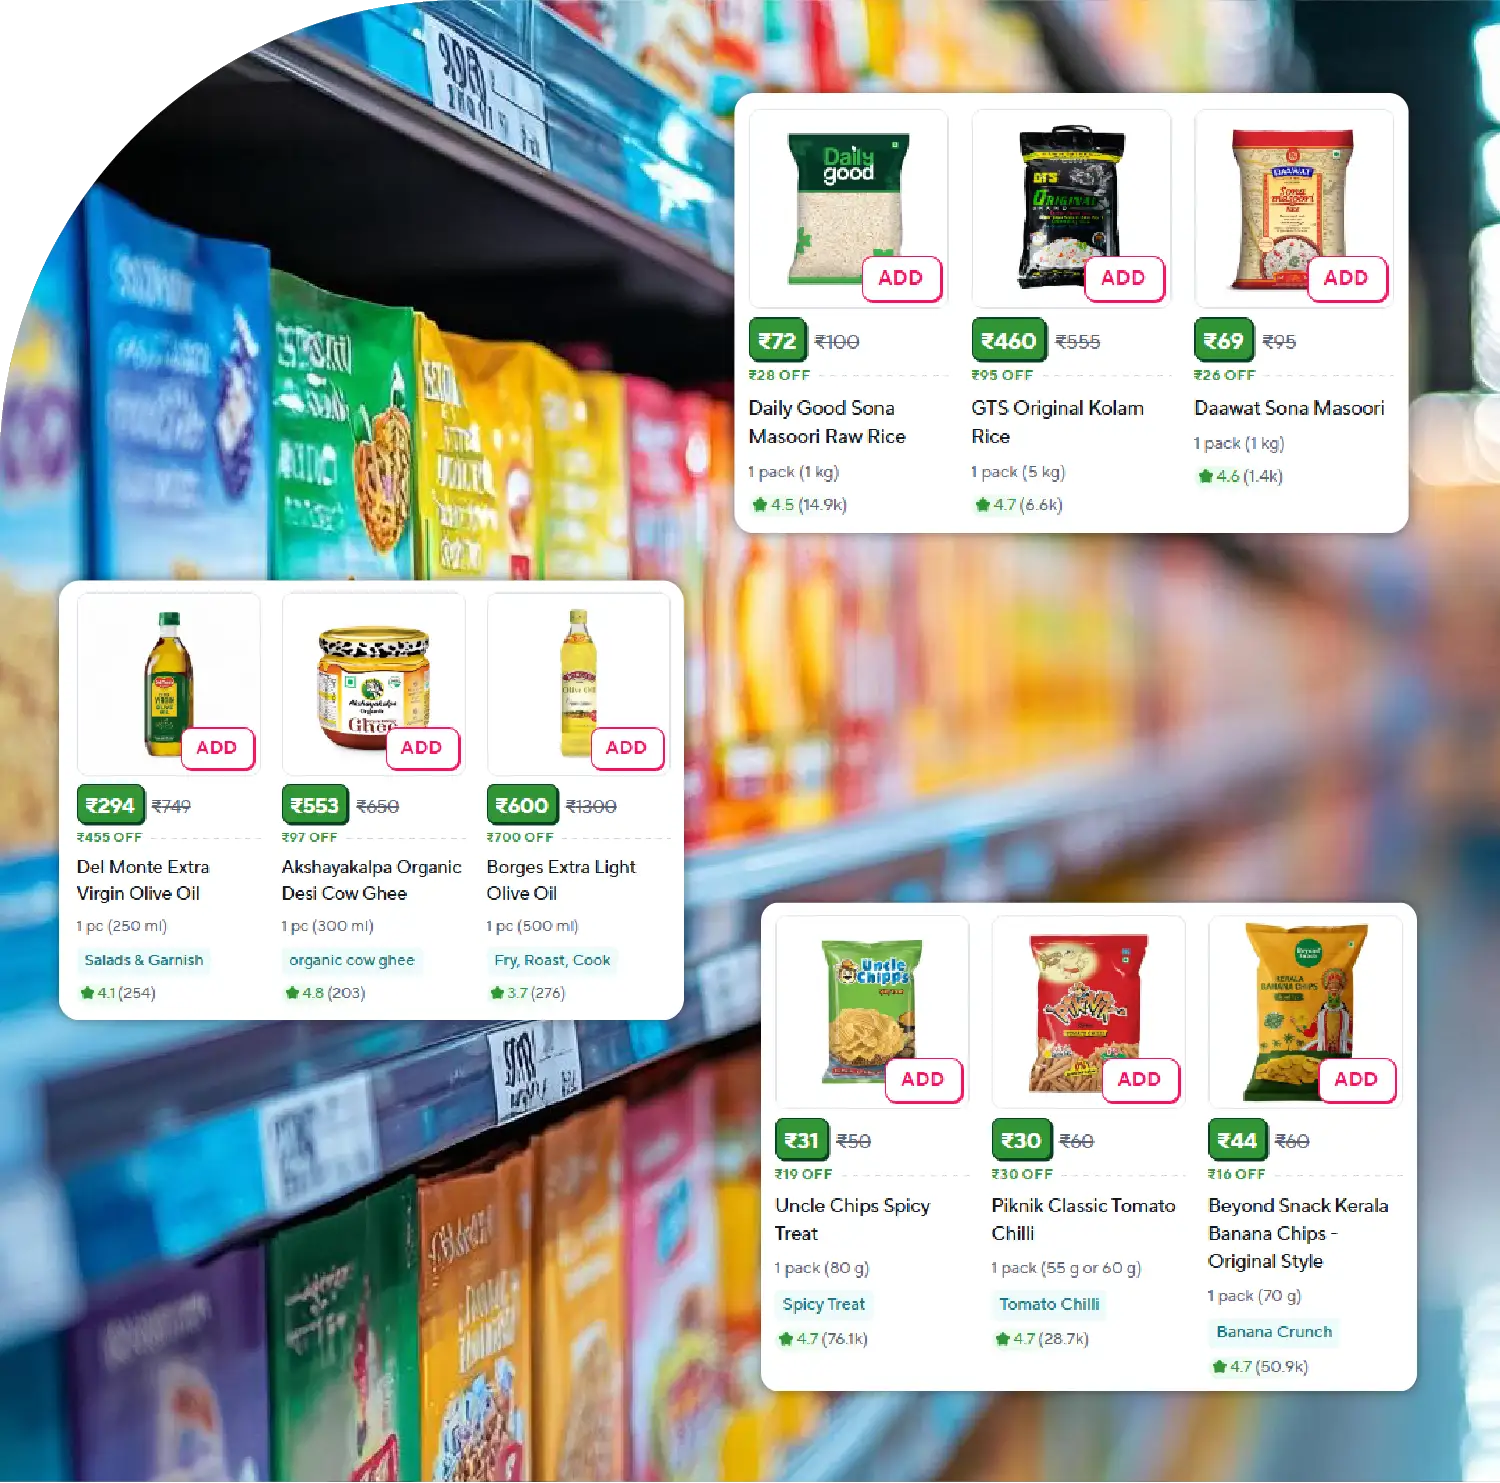
India’s quick-commerce (Q-commerce) ecosystem has experienced unprecedented acceleration driven by instant fulfillment expectations, evolving digital purchasing behaviour, and aggressive delivery-time competitions among platforms such as Blinkit, Zepto, Swiggy Instamart, and BigBasket Now. The shift from scheduled weekly grocery orders to real-time delivery within 10–20 minutes has redefined consumption dynamics across both metro and Tier-2 city clusters. With expanding dark-store networks, product recommendations, AI-driven demand prediction, and impulse buying patterns, category-level visibility and SKU-level tracking have become critical for decision-making.
Businesses aiming to scale require high-frequency retail intelligence systems to Scrape Top 100 Fastest Growing SKUs & Categories, enabling precise strategy execution. With automated intelligence models that Scrape India Q-Commerce Top 100 Fastest-Growing SKUs, enterprises gain visibility into cross-platform product movement, stock variation, promotion efficiency, and brand penetration in real time. Leveraging Real-Time Q-Commerce SKU Tracking in India, companies can analyze how seasonality, pricing, festivals, and lifestyle changes shape purchasing patterns.
Q-commerce demand is projected to grow at a CAGR of 50% between 2024 and 2027, supported by rising household reliance on instant fulfillment, especially in the food, beverage, and snack categories. The future of Q-commerce will be defined by assortment intelligence, automated inventory forecasting, dynamic pricing optimization, and integrated product visibility analytics.
Using Fastest-Growing Q-Commerce Categories Data Extraction, analysts access real-time datasets that map shifting demand cycles across thousands of daily purchases. This insight helps FMCG brands optimize placement, manage product lifecycle planning, analyze competitive positioning, and unlock whitespace opportunities.
Modern competitive FMCG sectors depend heavily on method to Extract Top 100 Q-Commerce Products & Categories India, as SKU-level growth is now driven by frequent micro trends rather than long-term brand loyalty. This includes rising preference for premium health products, protein snacks, instant meals, baby essentials, energy beverages, and functional beauty categories.
| Rank | SKU / Brand | Category | Monthly Growth % | Key Insight |
|---|---|---|---|---|
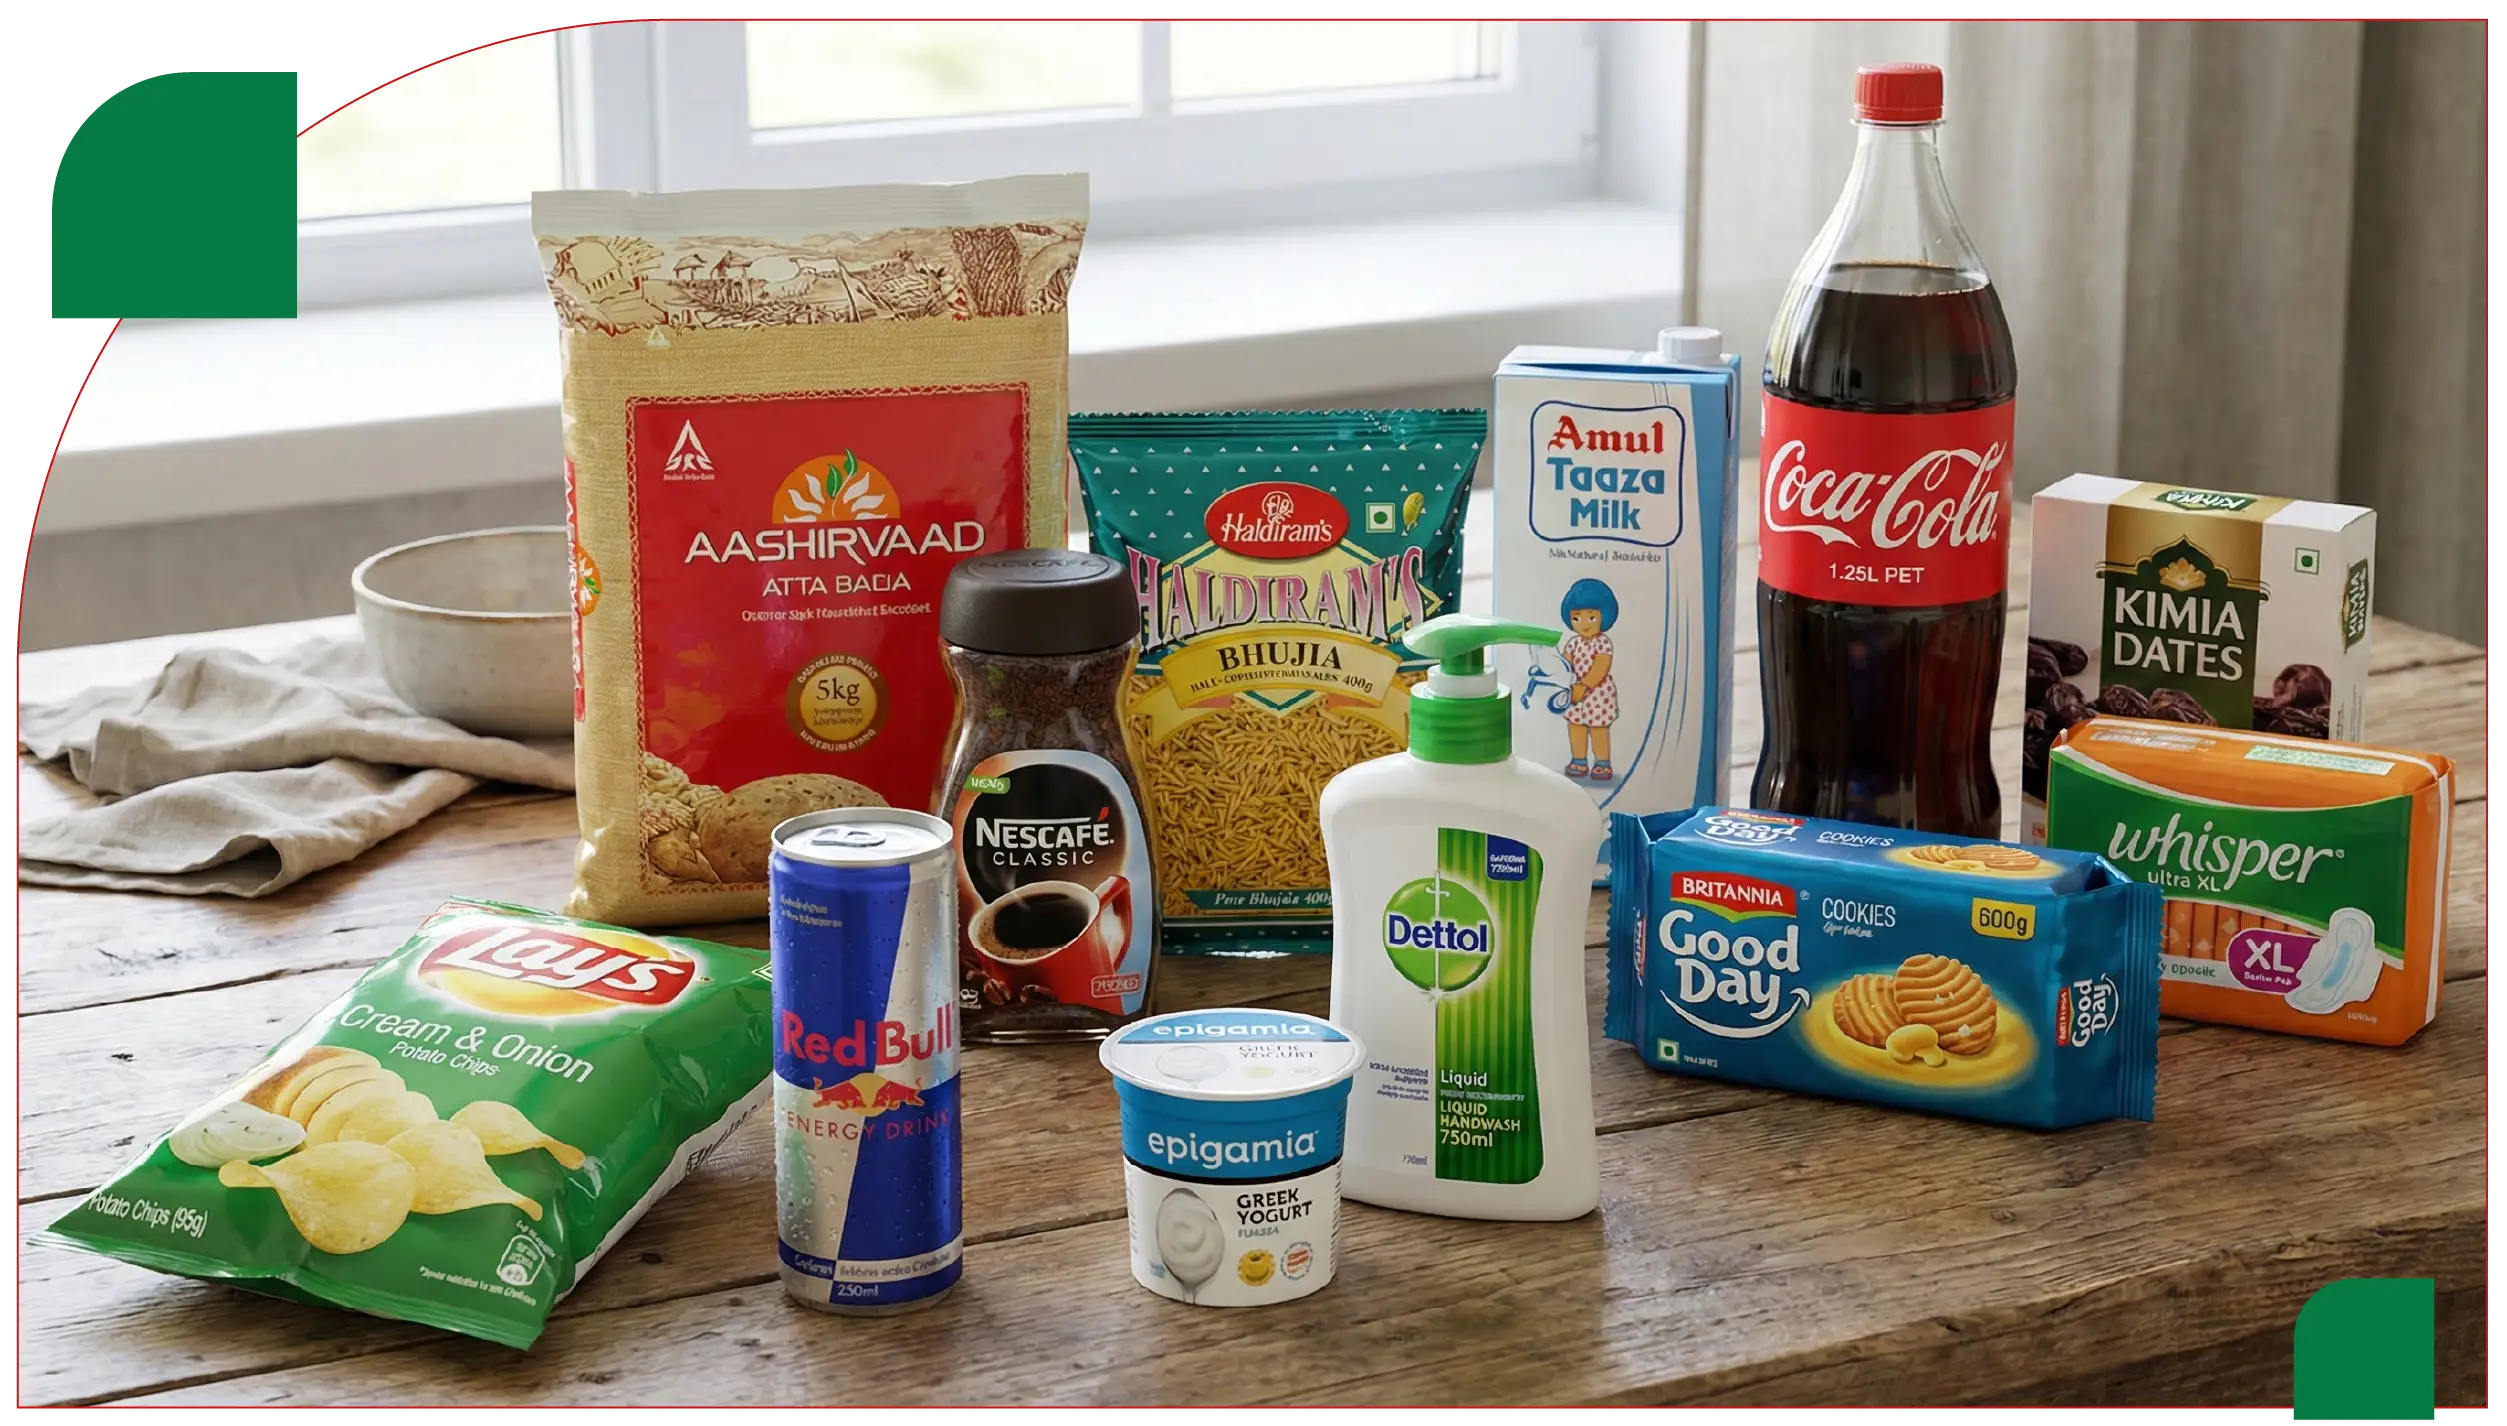
| 1 | Lay’s Cream & Onion (95g) | Snacks | 37% | Impulse & entertainment-driven |
| 2 | Amul Taaza Milk 1L | Dairy | 33% | Daily essential recurring orders |
| 3 | Red Bull 250ml | Beverages | 31% | Late-night ordering surge |
| 4 | Epigamia Greek Yogurt | Premium Dairy | 29% | Health-conscious urban buyers |
| 5 | Aashirvaad Atta 5kg | Staples | 27% | Weekend bulk buying |
| 6 | Nescafé Classic 200g | Beverages | 25% | Tier-1 peak consumption |
| 7 | Haldiram’s Bhujia 400g | Namkeen | 24% | Tier-2 festive preference |
| 8 | Coca-Cola 1.25L PET | Beverages | 23% | Bundled promotion lift |
| 9 | Kimia Dates 500g | Dry Fruit | 22% | Ramadan seasonal spike |
| 10 | Britannia Good Day 600g | Biscuits | 21% | Stable daily demand driver |
| 11 | Dettol Liquid Handwash 750ml | Hygiene | 19% | Health & safety category |
| 12 | Whisper Ultra XL Pack | Feminine Care | 18% | Essential urgency orders |
The SKU growth analysis reveals a clear mix of impulse-driven products, daily essentials, and lifestyle-based categories as the fastest movers. Snacks and beverages lead due to their impulsive nature, especially in metro regions where late-night orders are highest. Dairy and staples show strong repeat purchasing patterns linked to essential household cycles. Personal hygiene growth demonstrates the continued impact of post-pandemic awareness. This multi-segment performance indicates diversified demand momentum across product categories.
Understanding category segmentation is crucial for competitive visibility. Strategic retail planning now relies heavily on tracking top-performing verticals to map business expansion priorities.
Using insights from Track India’s Fastest-Growing Q-Commerce Categories, enterprises leverage micro-level understanding of real-time demands, evolving consumption profiles, product portfolio ranking, and forecasting models at hourly granularity.
| Category | Market Contribution % | YoY Growth % | Core Demand Drivers |
|---|---|---|---|
| Snacks & Beverages | 33% | 41% | Impulse orders, entertainment |
| Daily Essentials & Dairy | 27% | 34% | Replenishment cycles |
| Beauty & Personal Care | 12% | 28% | Social media influence |
| Baby Food & Diapers | 8% | 24% | Emergency needs |
| Packaged Bakery & Biscuits | 9% | 19% | Tea-time consumption |
| Household Cleaning & Utilities | 11% | 21% | Quick restocks |
Snack and beverage categories dominate Q-commerce growth due to high buying frequency and promotional bundling strategies. Essentials such as dairy demonstrate consistent volume-led scaling. Beauty and baby-care categories show strong potential for accelerated adoption with rising delivery reliability and rapid category assortment expansion. Household cleaning products gain momentum due to emergency demand and convenience needs. These insights highlight competitive growth zones that require stronger visibility, discount monitoring, and inventory forecasting.
Demand acceleration indicates that consumers are shifting toward instant delivery convenience for both discretionary and essential consumption. Market forecasts estimate that the Q-commerce industry could exceed $11.5 billion by 2027. Expansion to Tier-2/Tier-3 markets and algorithmic recommendation-driven selling will redefine assortment prioritization.
Enterprises depend on Real-Time Quick Commerce Product Analytics Dataset India to understand product velocity, category substitution patterns, and price elasticity. Combined with enriched Quick Commerce Datasets, brands can optimize real-time performance across platforms, track competitor strategies, and build predictive stock planning systems.
| Year | Total Market Value (USD Billion) | Annual Growth Rate % |
|---|---|---|
| 2024 | 5.1 | – |
| 2025 | 6.8 | 33% |
| 2026 | 8.9 | 31% |
| 2027 | 11.5 | 29% |
The projected market trajectory demonstrates robust and sustained double-digit growth. While the growth rate slightly moderates year-on-year due to market stabilization, total revenue expansion continues strongly. This indicates increasing geographic penetration, stronger infrastructure scaling, and broader SKU/category coverage. Plotting this data would display a steep upward graph with consistent acceleration.
Next-generation Q-commerce success will be defined by:
High-frequency scraping environments and predictive modeling will be crucial for market competitiveness.
Data intelligence remains the foundation of India’s rapid Q-commerce expansion, empowering real-time retail agility. Businesses investing in precise SKU-level extraction, pricing movement analytics, competitor assortment benchmarking, and hyperlocal category segmentation are positioned to lead market transformation. Automating insight generation from Web Scraping Quick Commerce Data strengthens strategic forecasting and optimized product mix allocation across regions. Organizations integrating scalable Quick Commerce Data Scraping API frameworks can continuously monitor stock fluctuations, promotional impact, and platform-specific performance cycles. Advanced analytical ecosystems powered by Quick Commerce Data Intelligence Services enable granular visibility across top-performing categories and customer demand behaviour. Such intelligence infrastructure supports improved product availability, dynamic pricing optimization, and accelerated revenue growth aligned to evolving consumption patterns within India’s fast-scaling Q-commerce ecosystem.
Are you in need of high-class scraping services? Food Data Scrape should be your first point of call. We are undoubtedly the best in Food Data Aggregator and Mobile Grocery App Scraping service and we render impeccable data insights and analytics for strategic decision-making. With a legacy of excellence as our backbone, we help companies become data-driven, fueling their development. Please take advantage of our tailored solutions that will add value to your business. Contact us today to unlock the value of your data.

