Introduction
The coffee shop industry in the United States is far more than a retail business — it represents a deeply ingrained cultural phenomenon that fuels billions in annual revenue and millions of daily transactions. By utilizing USA Coffee Shop Data Scraping Services, companies and analysts can gain a precise understanding of consumer preferences, location-based performance, and emerging market opportunities. With Web Scraping Coffee Industry Data in the USA, businesses can extract actionable insights related to pricing trends, product innovation, and competitive positioning. As the market approaches an impressive valuation of nearly $24 billion in 2025, strategic data utilization becomes essential for growth and adaptation. Leveraging Scrape USA Coffee Shop Industry Data enables operators to make data-driven decisions, refine marketing strategies, and enhance operational efficiency. Ultimately, real-time data intelligence empowers stakeholders to stay ahead in one of America’s most dynamic and enduring consumer industries — coffee retail.
Coffee Consumption Habits in the US
Coffee remains a daily ritual for most Americans. The latest data shows that 72.9% of adults drink coffee every day, highlighting the strength of this market. Another 16.1% consume it several times a week, while only 10.4% drink it infrequently. This behavior translates into one of the most consistent and predictable customer bases in any industry.
| Consumption Frequency |
Percentage of Americans |
Implication for Industry |
| Daily | 72.9% | Strong repeat traffic |
| Few times a week | 16.1% | Regular customer engagement |
| Once a week or less | 10.4% | Potential growth segment |
With nearly 90% of Americans drinking coffee weekly, the Coffee Shop Price and Menu Data Scraper USA enables businesses to adapt pricing and product offerings for both frequent and occasional customers.
Market Size and Projected Growth
The US coffee market stands at $23.96 billion in 2025, projected to grow to $28.94 billion by 2030 — an annual growth rate (CAGR) of 3.85%. This steady rise demonstrates a robust market trajectory and reinforces the industry’s long-term stability.
| Year |
Market Size (USD Billion) |
Growth Trend |
| 2025 | 23.96 | Current value |
| 2030 | 28.94 | +4.98 increase |
Businesses can utilize Web Scraping Coffee Chain Outlets and Reviews USA to identify regional performance, customer satisfaction trends, and brand loyalty, providing actionable intelligence for expansion or improvement.
Leading Coffee Chains in the US
The market is dominated by two giants: Starbucks and Dunkin Donuts, with 17,137 and 9,830 locations respectively. Other key players include Dutch Bros Coffee (1,020), Tim Hortons (696), Caribou Coffee (490), and BIGGBY Coffee (448).
This high concentration means Starbucks and Dunkin command vast consumer attention, while smaller brands rely on niche positioning or regional focus.
For businesses analyzing store-level competition or planning retail expansion, the USA Coffee Market Trends Dataset provides precise insight into store density, chain distribution, and local market saturation across all 50 states.
Geographic Distribution and State-Level Insights
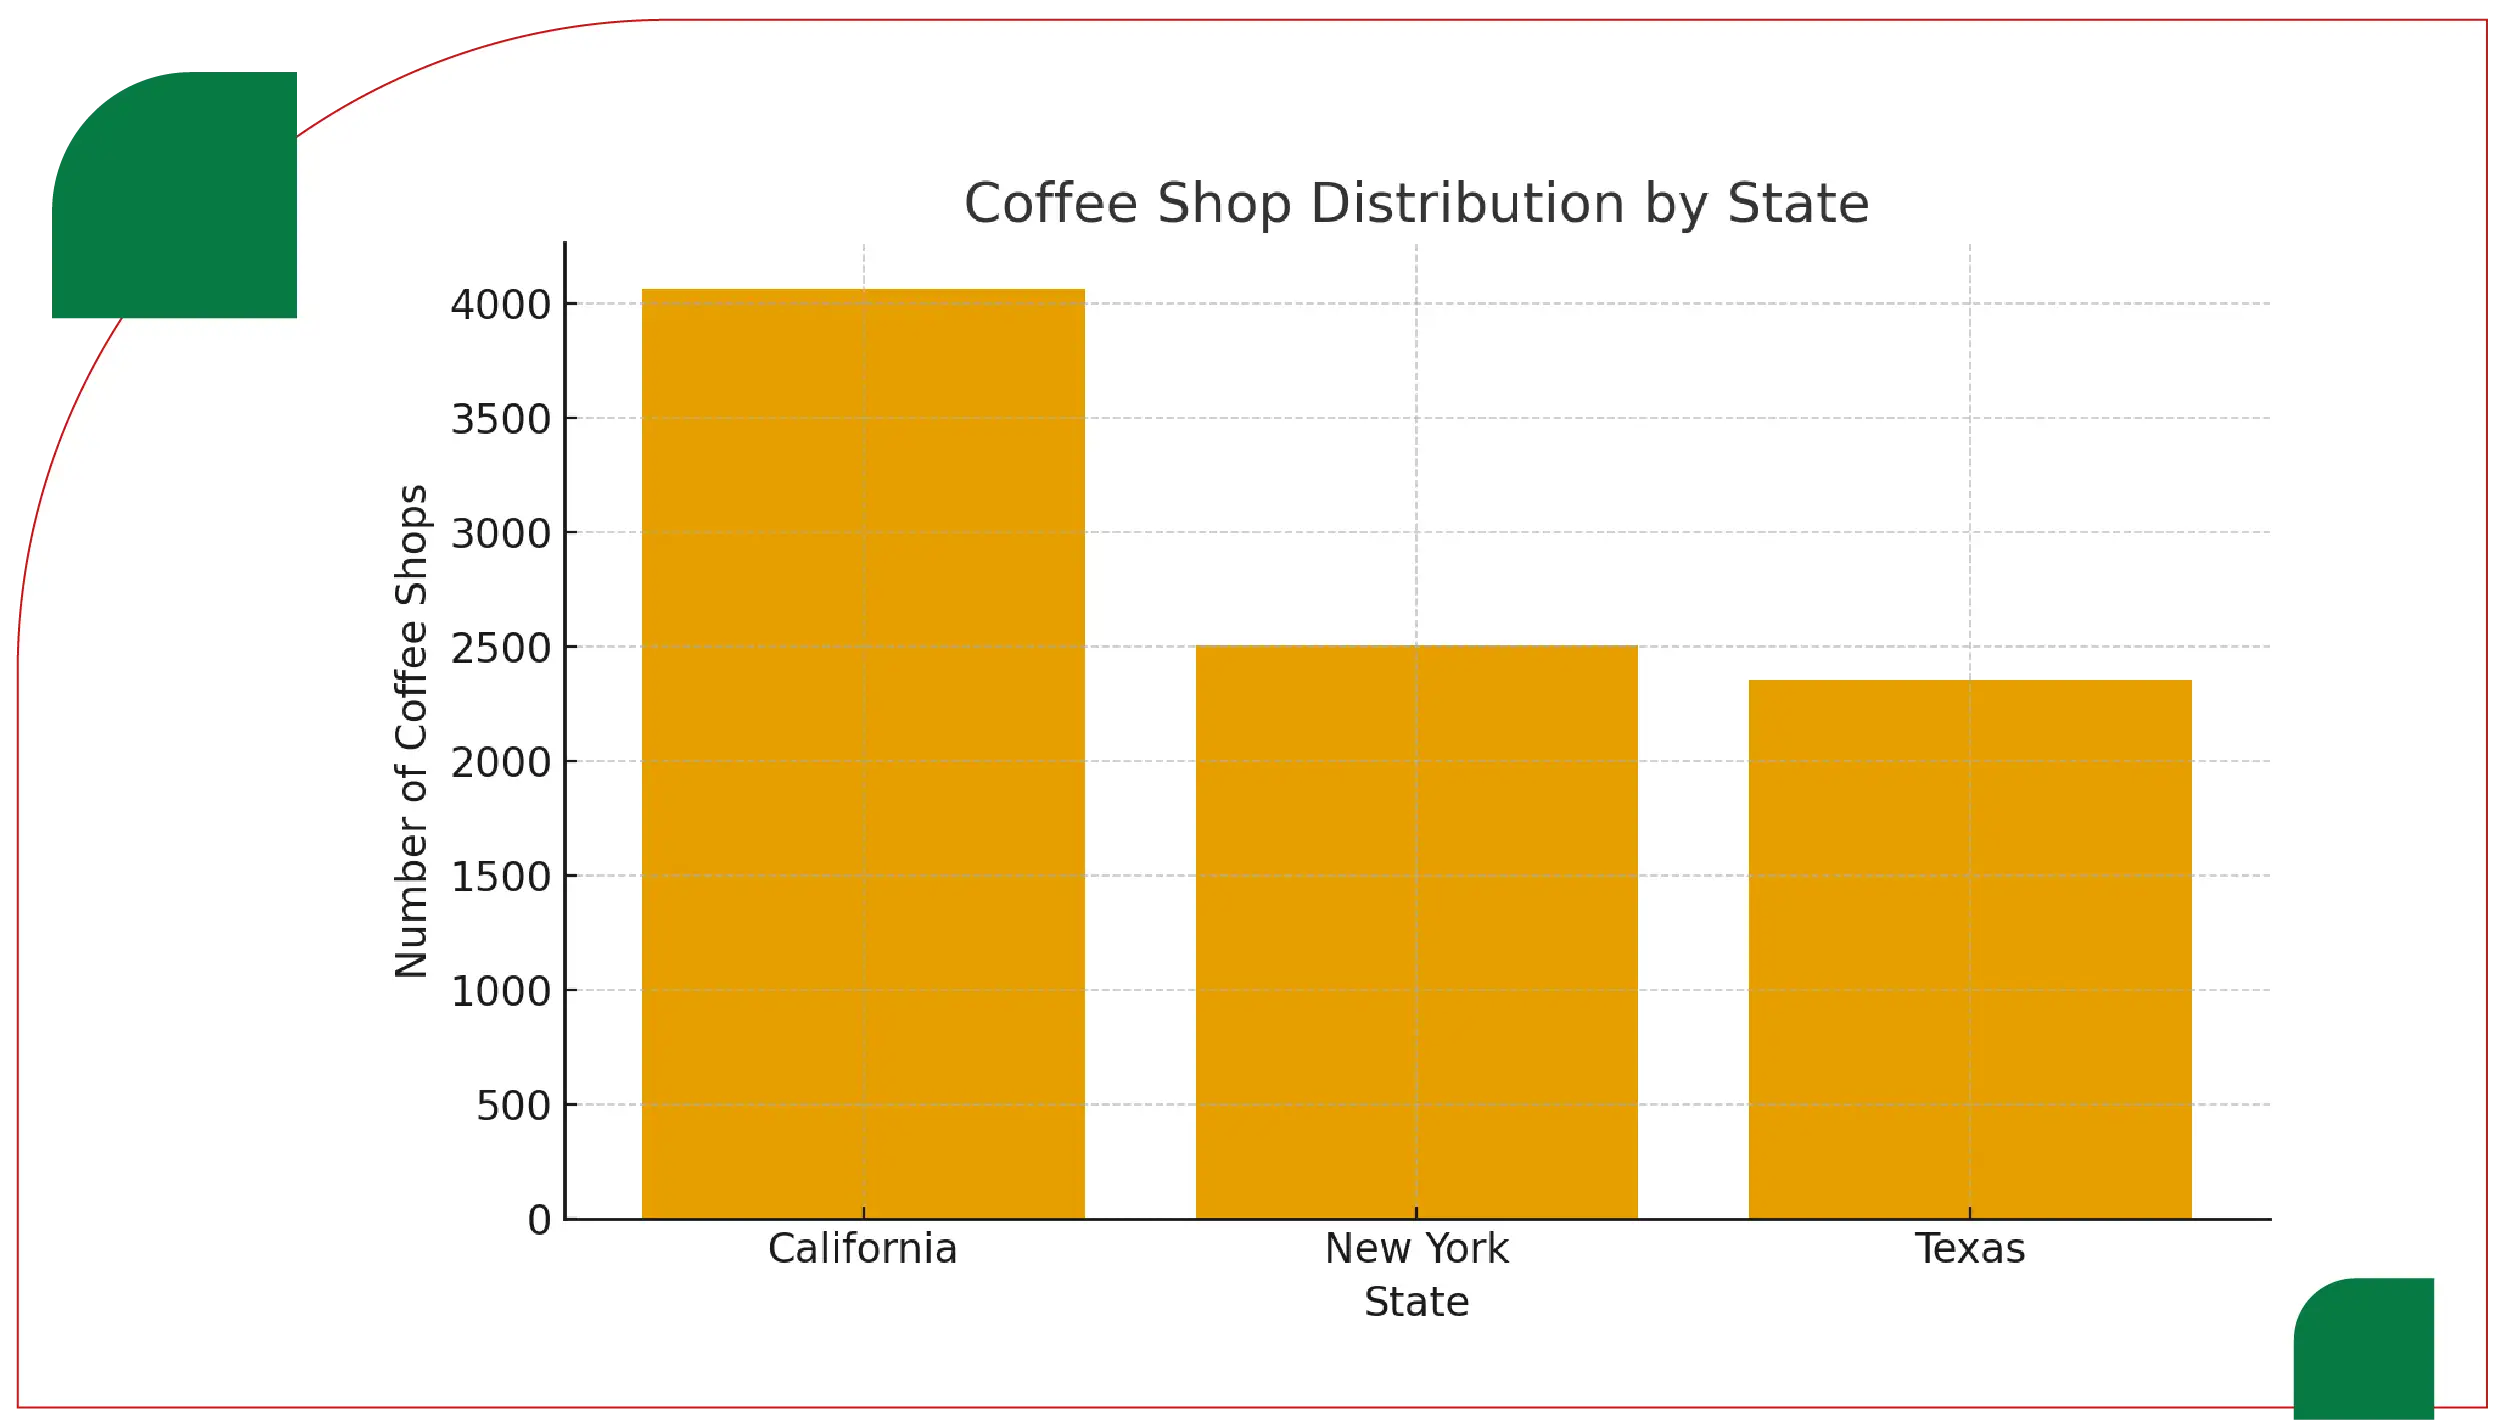
California leads the coffee shop landscape with 4,063 locations, followed by New York (2,507) and Texas (2,355). These three states account for a major share of national coffee shop density.
Starbucks alone operates in all 52 states and territories, with its strongest presence in California (3,184 locations), Texas (1,471), and Florida (932). By using Coffee Chain Store Data Scraping API USA, analysts can map these locations, compare competitors, and identify underpenetrated regions ripe for new entrants.
This geographic diversity allows smaller, regional coffee shops to thrive in markets where national players have limited reach, such as parts of the Midwest and Mountain West regions.
Operational Stability and Industry Health
The coffee shop sector in the US demonstrates impressive operational resilience. Out of 32,000 tracked stores, 31,752 are open and active, while fewer than 100 face closures or temporary shutdowns. This 99% operational rate shows remarkable industry stability and consumer dependence.
For service providers and suppliers, this ensures consistent B2B demand. Tools like Coffee Flavors & Ingredient Insights can help brands identify consumer preferences, trending ingredients, and seasonal menu variations that drive repeat purchases.
Coffee Pricing Trends
Between January 2024 and May 2025, the average price of coffee in the US increased from $3.25 to $3.50, representing a 7.7% rise over 16 months. Despite this, consumer demand remains strong, reflecting price elasticity and brand loyalty.
Businesses can leverage Food Delivery Data Scraping Services to monitor online coffee prices across third-party delivery platforms and compare them with in-store rates, revealing consumer willingness to pay premiums for convenience or specialty offerings.
City-Level Concentration and Consumer Hotspots
At a city level, Chicago (412) and New York (388) lead the country in coffee shop count, followed by Houston (281) and Las Vegas (261). These cities serve as national coffee hubs due to dense populations, active commuters, and a thriving café culture.
By applying Restaurant Menu Data Scraping, operators can track menu trends across these cities, understand which beverages dominate (e.g., cold brews, lattes, or plant-based alternatives), and tailor local promotions accordingly.
Regional Opportunities and Competitive Dynamics
Despite the dominance of Starbucks and Dunkin, the data indicates room for regional and independent coffee houses to expand. Dunkin is still absent from seven states, offering white space for other chains to establish presence.
Through Food Delivery Scraping API Services, brands can measure delivery coverage gaps, optimize distribution routes, and test new markets via third-party apps before opening physical outlets.
Furthermore, Restaurant Data Intelligence Services allow brands to benchmark operational efficiency, pricing strategies, and customer sentiment across multiple platforms, fostering better market adaptability.
Long-Term Growth Outlook
The industry’s compound growth rate of 3.85% reflects sustainable expansion rather than volatility. Investors and entrepreneurs can use these analytics to plan infrastructure investments, tech adoption (like mobile ordering), or menu diversification.
Combining location analytics, pricing intelligence, and Web Scraping Coffee Industry Data in the USA enables comprehensive insights that inform strategic decision-making — from real estate selection to product innovation.
Conclusion
The US coffee shop industry’s success lies in its consistency, cultural significance, and ability to evolve with consumer tastes. With a $28.94 billion projected value by 2030, and nearly three-quarters of the adult population drinking coffee daily, this sector promises both reliability and growth. Emerging data tools and automation such as Food delivery Intelligence services give brands a sharper understanding of pricing, demand, and regional variations.
The integration of Food Price Dashboard helps businesses track real-time cost changes and optimize pricing strategies effectively. By leveraging Food Delivery Datasets, stakeholders can analyze the performance and balance between dine-in, takeaway, and delivery operations across the expanding US coffee market. Together, these insights ensure comprehensive visibility, enabling brands to make informed, data-driven decisions within the fast-evolving national coffee ecosystem.
Are you in need of high-class scraping services? Food Data Scrape should be your first point of call. We are undoubtedly the best in Food Data Aggregator and Mobile Grocery App Scraping service and we render impeccable data insights and analytics for strategic decision-making. With a legacy of excellence as our backbone, we help companies become data-driven, fueling their development. Please take advantage of our tailored solutions that will add value to your business. Contact us today to unlock the value of your data.