The framework includes :
- A universal schema for menu items
- Global cuisine taxonomy (250+ cuisines and sub-cuisines)
- Ingredient-level mapping and allergen tagging
- Portion-size standardization
- Modifier clustering
- Dish semantic clustering
- The global problem
- The technical solution
- The architecture
- Sample datasets
- Country-level challenges
- Platform variations
- Business impact
- ROI
- 2026 roadmap
Food Data Scrape’s unified catalog has become the backbone for enterprise-grade foodservice intelligence.
Introduction: Why Global Foodservice Data Is Broken
The foodservice industry is inherently diverse. This diversity becomes a challenge when data needs to be integrated, compared, or analyzed at scale. Food Delivery Datasets provide structured, standardized information to overcome these challenges and enable actionable insights. Across the world, restaurants format menus differently. Delivery platforms use different schemas. Ingredient naming is inconsistent. Modifiers vary drastically. Portion sizes lack standard units. Even price structures differ based on regional norms. Restaurant Menu Data Scraping helps standardize and unify this fragmented data for accurate analysis and insights.
Some platforms categorize food by cuisine. Others classify items by dish family. Some mix them. Many restaurants upload non-standard menu formats like:
- PDFs
- Social media posts
- High-resolution images
- Unstructured text
- Seasonal menu updates
As a result:
- AI models perform poorly
- Cross-country comparison becomes impossible
- Pricing intelligence tools misclassify items
- POS onboarding takes weeks longer
- Data teams spend more time cleaning data than analyzing it
The Challenge
Enterprises approached Food Data Scrape with a consistent complaint:
“We have menu data, but none of it can be compared or used effectively because the structure is different everywhere.”
Key challenges identified:
-
1. Menu Structure Inconsistency
Menus differ by:- Hierarchy
- Categorization style
- Portion descriptions
- Variation formatting
- “Chicken Biryani – Regular”
- “Biryani (Chicken)”
- “Chicken Dum Biryani Combo”
-
2. Modifier Chaos
Add-ons and customizations are labeled inconsistently:- “Add Mozzarella”
- “Cheese + ₹20”
- “Extra Cheese Slice”
- “Add Cheddar”
-
3. Cuisine Confusion
Restaurants self-define cuisines, producing terms like:- “Italian-Asian Fusion”
- “Modern Cambodian Grill”
- “Tex-Mex Street Food”
-
4. Missing Ingredient & Allergen Structure
Descriptions vary heavily:- Some detailed
- Some minimal
- Some missing
-
5. Portion Size Variability
Portions are labeled with:- “Small,” “Regular,” “Large”
- “12 oz,” “Tall,” “Venti”
- “150 g,” “Box,” “Bowl”
-
6. Multi-Country Expansion Needs
Enterprise clients operate in:- North America
- Europe
- Middle East
- LATAM
- Africa
- Southeast Asia
The Food Data Scrape Solution: The Worldwide Foodservice Catalog
Food Data Scrape built a robust system that automatically converts messy global menu data into a unified, structured, consistent format. The framework includes:
- Global schema design
- Cuisine taxonomy
- Ingredient extraction and allergen mapping
- Portion standardization
- Modifier clustering
- Dish semantic clustering
- Country-level normalization
- Platform-level mapping
Global Menu Schema Design
A universal schema supports all menu types and platforms.
Core Schema Fields
| Field | Description |
|---|---|
| global_item_id | Universal dish identifier |
| restaurant_id | Unique merchant reference |
| dish_name_clean | Standardized name |
| dish_family | Grouped dish category |
| cuisine_primary | Main cuisine |
| cuisine_secondary | Sub-cuisine |
| ingredients_mapped | Structured ingredient list |
| allergens_detected | Derived allergens |
| portion_size_ml_g | Standardized size |
| portion_type | ml/g/pieces |
| modifiers_standardized | Add-on clusters |
| price_local | Local currency price |
| price_usd | Normalized USD value |
| country | Region |
| platform_source | UberEats, Zomato, DoorDash |
| updated_at | Timestamp |
This schema becomes the foundation for global consistency.
Cuisine Taxonomy (250+ Standard Types)
Food Data Scrape built a hierarchical cuisine model:
Level 1: Continent
Level 2: Region
Level 3: Country Cuisine
Level 4: Sub-cuisine
Level 5: Dish Family
Example:
- Asian
- Southeast Asian
- Thai
- Northern Thai
- Street-Style Thai
This improves search, recommendations, and analytics accuracy.
Ingredient Mapping & Allergen Detection
Ingredients are extracted from:
- Names
- Descriptions
- Add-ons
- Nutrition labels
Mapped allergens include:
- Gluten
- Dairy
- Peanuts
- Sesame
- Soy
- Egg
These mappings power compliance systems and dietary filters.
Portion Size Standardization
Raw label → Standardized size:
- “Tall Latte” → 354 ml
- “Fries Medium Box” → 130 g
- “8-inch Pizza” → 20 cm
This allows price and portion comparison across markets.
Modifier Normalization
Modifiers are clustered into families:
- Cheese Add-ons
- Milk Alternatives
- Extra Shot Add-ons
- Toppings (Vegetarian & Non-Vegetarian)
- Beverage Sweetness Levels
Instead of 200+ modifier combinations, clients receive 15–20 standardized groups.
Dish Semantic Clustering
Multiple dish names → one global family:
- “Chicken Biryani”
- “Hyderabadi Chicken Biryani”
- “Chicken Dum Biryani”
→ Chicken Biryani (Global Family)
This enables global comparative reporting.
Country-Level Normalization
Each region poses unique challenges:
- United States & Canada: Large menus, heavy modifiers, and beverage size variations. Solution: beverage size model + modifier clustering.
- India: Regional cuisines, spice levels, veg/non-veg flags. Solution: 50+ Indian sub-cuisine mapping + dietary classification.
- UAE & Middle East: Mixed global cuisines + Arabic naming styles. Solution: multilingual NLP dictionary.
- Europe: Multi-language menus + allergen regulation differences. Solution: translation + EU allergen alignment.
- LATAM: Local dish names and portion terms vary significantly. Solution: regional dictionary for tacos, arepas, empanadas.
- Southeast Asia: Street-food and visually recognizable dishes often lack descriptions. Solution: image recognition + dish family mapping.
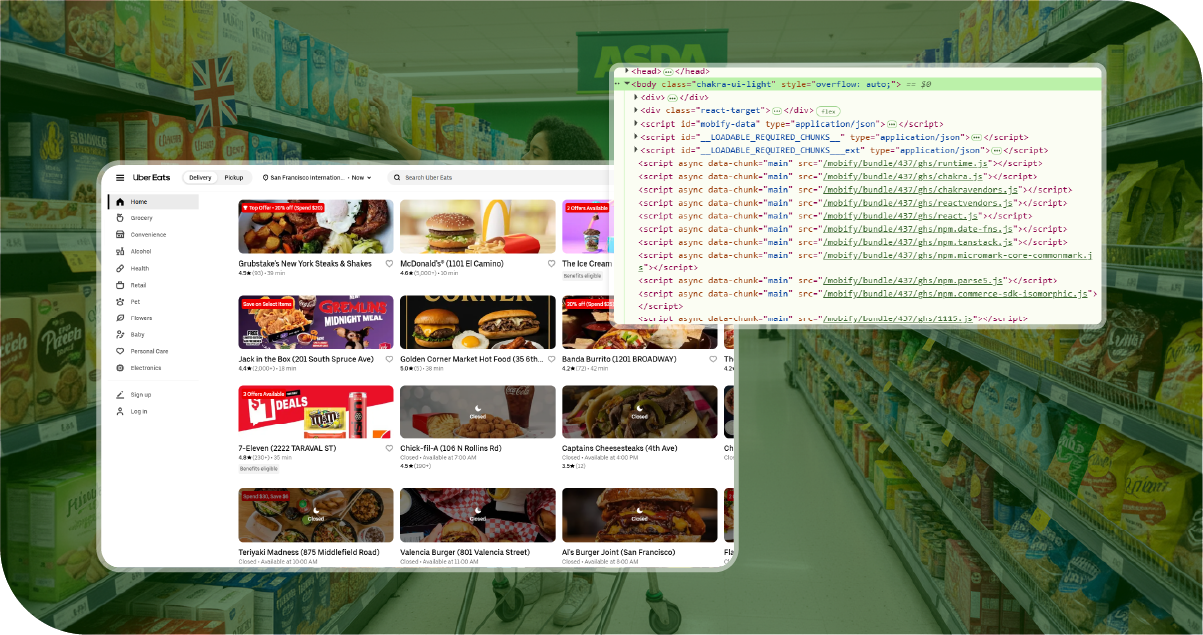
Platform-Level Standardization
Each platform structures menus differently:
| Platform | Key Challenge | Solution |
|---|---|---|
| Uber Eats | Too many modifiers | Clustering engine |
| DoorDash | Deep category hierarchy | Schema flattening |
| Zomato | Regional naming complexity | Sub-cuisine mapping |
| Google Menus | Semi-structured | NLP-based normalization |
| Yelp | User-generated noise | Deduplication + cleaning |
The Global ETL Pipeline
Complete flow:
[Scraping] → [Raw Data Lake] → [OCR/NLP] → [Normalization]
→ [Cuisine Mapping] → [Modifier Clustering] → [Ingredient Mapping]
→ [Portion Standardization] → [Dish Clustering] → [Enrichment]
→ [Final Structured Output]
Data Quality Framework
Food Data Scrape applies seven layers of quality checks:
- Structural validation
- Duplicate detection
- Price validation
- Unit consistency
- Cuisine confidence scoring
- Modifier mapping accuracy
- Manual review for priority countries
Accuracy ranges from 94–97 percent.
Sample Dataset (Standardized)
| global_item_id | dish_name_clean | category | cuisine | portion_size | price_local | price_usd | ingredients | add_ons | country |
|---|---|---|---|---|---|---|---|---|---|
| FD_98231 | Chicken Biryani | Biryani | Indian | 350 g | ₹249 | 2.98 | chicken, rice, spices | raita, egg | India |
| FD_88214 | Margherita Pizza | Pizza | Italian | 12 inch | $12.99 | 12.99 | cheese, tomato, dough | extra cheese | USA |
| FD_77812 | Caramel Latte | Coffee | Global | 355 ml | 18 AED | 4.90 | milk, coffee, caramel | extra shot | UAE |
Implementation Architecture
The architecture includes:
- Data ingestion
- Standardization engine
- Intelligence enrichment
- Export and API layers
The modular design supports enterprises of all sizes.
Enrichment Layer
After standardization, enrichment adds value:
- USD normalization
- Dietary tagging
- Cooking method inference
- Popularity signals
- Price benchmarking
This makes the dataset usable for analytics and decision-making.
Business Impact
Clients report:
- Faster decision-making Global pricing, trends, and cuisine insights become reliable.
- Lower operational costs Data cleaning time reduced by 78 percent.
- More accurate AI models Search and recommendations improved by 10–14 percent.
- Faster product launches Go-to-market time reduced by 40–60 percent.
- New revenue streams Companies monetize global foodservice datasets.
14. Multi-Industry Use Cases
Food Delivery Apps
- Price benchmarking
- Trend prediction
- Modifier intelligence
- Dish mapping
POS Companies
- Auto-generated menus
- Merchant onboarding acceleration
- Competitive menu tracking
- Ingredient planning
- Training data for food models
- Menu recognition
- Allergen & nutrition inference
- Ingredient demand forecasting
- Market entry analysis
- Cuisine popularity reporting
Cloud Kitchens
AI Startups
FMCG Companies
Consulting Firms
15. ROI Summary
| Metric | Improvement |
|---|---|
| Engineering dependency | -65% |
| Manual processing | -78% |
| AI model performance | +14% |
| Market expansion time | -50% |
| Feature development | +3–5 features per quarter |
16. 2026 Roadmap
Food Data Scrape is expanding the catalog with:
- Ingredient cost intelligence
- Nutritional estimation AI
- Multi-language translation (100+ regions)
- Historical menu versioning
- Advanced dish image recognition
- Restaurant attribute expansion
- Real-time surge pricing intelligence
These additions will elevate the catalog into an even more powerful global standard.
17. Conclusion
Foodservice data is diverse, unstructured, and globally inconsistent. Without standardization, enterprises face inefficiencies, inaccurate analytics, and unreliable insights. Restaurant Data Intelligence Services help organize, standardize, and extract actionable intelligence from complex foodservice data. The Worldwide Foodservice Catalog developed by Food Data Scrape solves this at scale. By offering:
- A universal schema
- Global cuisine taxonomy
- Ingredient & allergen mapping
- Modifier clustering
- Portion standardization
- Dish semantic grouping
- Platform-wise normalization
- Global enrichment
companies can finally rely on structured, comparable, analytics-ready datasets across the entire foodservice universe. Our Food Price Dashboard provides real-time, standardized pricing insights for restaurants, cafes, bars, and food trucks globally. This framework is now used by:
- Food delivery leaders
- POS systems
- Market intelligence teams
- Cloud kitchens
- FMCG companies
- AI innovators
- Restaurant-tech platforms
Food Data Scrape has created the global foundation for foodservice data intelligence — enabling better decisions, stronger AI, faster products, and scalable global insights.
If you are seeking for a reliable data scraping services, Food Data Scrape is at your service. We hold prominence in Food Data Aggregator and Mobile Restaurant App Scraping with impeccable data analysis for strategic decision-making.

