
This report presents an in-depth overview of festive cocktail and liquor consumption patterns observed across 50 major U.S. cities during the Christmas season. By examining data collected from bars, restaurants, and liquor retailers, the study highlights how holiday celebrations influence drink preferences, pricing behavior, and regional demand. The analysis reveals clear differences between metropolitan nightlife hubs, traditional midwestern markets, and coastal tourist-driven cities. Premium urban locations tend to emphasize visually appealing, high-value cocktails, while colder regions show a stronger preference for warm, spirit-forward drinks. Pricing variations reflect local taxes, operating costs, and customer willingness to spend during the holidays. The report also demonstrates how seasonal demand impacts inventory planning and promotional strategies. Overall, these insights help hospitality businesses and alcohol distributors better understand holiday-driven consumer behavior, refine menu offerings, improve stock availability, and design location-specific marketing initiatives that enhance customer experience and maximize festive season revenue.
1. Seasonal Demand Shift Christmas celebrations drive increased demand for specialty cocktails and limited-time drink menus across cities.
2. Regional Taste Differences Climate and local culture strongly influence whether consumers prefer warm, spiced drinks or lighter festive options.
3. Urban Pricing Patterns Major nightlife cities command higher drink prices due to premium ingredients and elevated service experiences.
4. Spirit Preference Trends Traditional spirits dominate colder regions, while diverse selections perform better in coastal and tourist markets.
5. Business Strategy Impact Holiday consumption insights enable better pricing decisions, inventory planning, and targeted seasonal promotions.
The holiday season is synonymous with festive gatherings, parties, and celebrations, all of which drive significant demand for cocktails and liquor. Understanding consumer preferences, pricing strategies, and regional consumption patterns is critical for bars, restaurants, distributors, and market analysts. This report focuses on Scraping Christmas Cocktail & Liquor Trends Across 50 US Cities, providing a detailed view of cocktail popularity, liquor consumption, and holiday market behavior across the United States. By leveraging advanced techniques to Extract Christmas Cocktail and Liquor Data Across US Cities, stakeholders can gain actionable insights into both mainstream and niche trends. Moreover, Christmas Cocktail Pricing & Liquor Trends Data Extraction offers detailed information on pricing variations, popular drinks, and seasonal patterns, helping businesses optimize offerings and promotions.
This research identifies city-wise patterns in cocktail and liquor consumption, highlights seasonal pricing strategies, and evaluates popular drink combinations during Christmas. The insights are valuable for enhancing menu planning, inventory management, and competitive positioning in the holiday market.
To ensure robust data collection, the study employed advanced web scraping techniques, focusing on online menus, restaurant websites, liquor retailers, and delivery platforms. The methodology included:
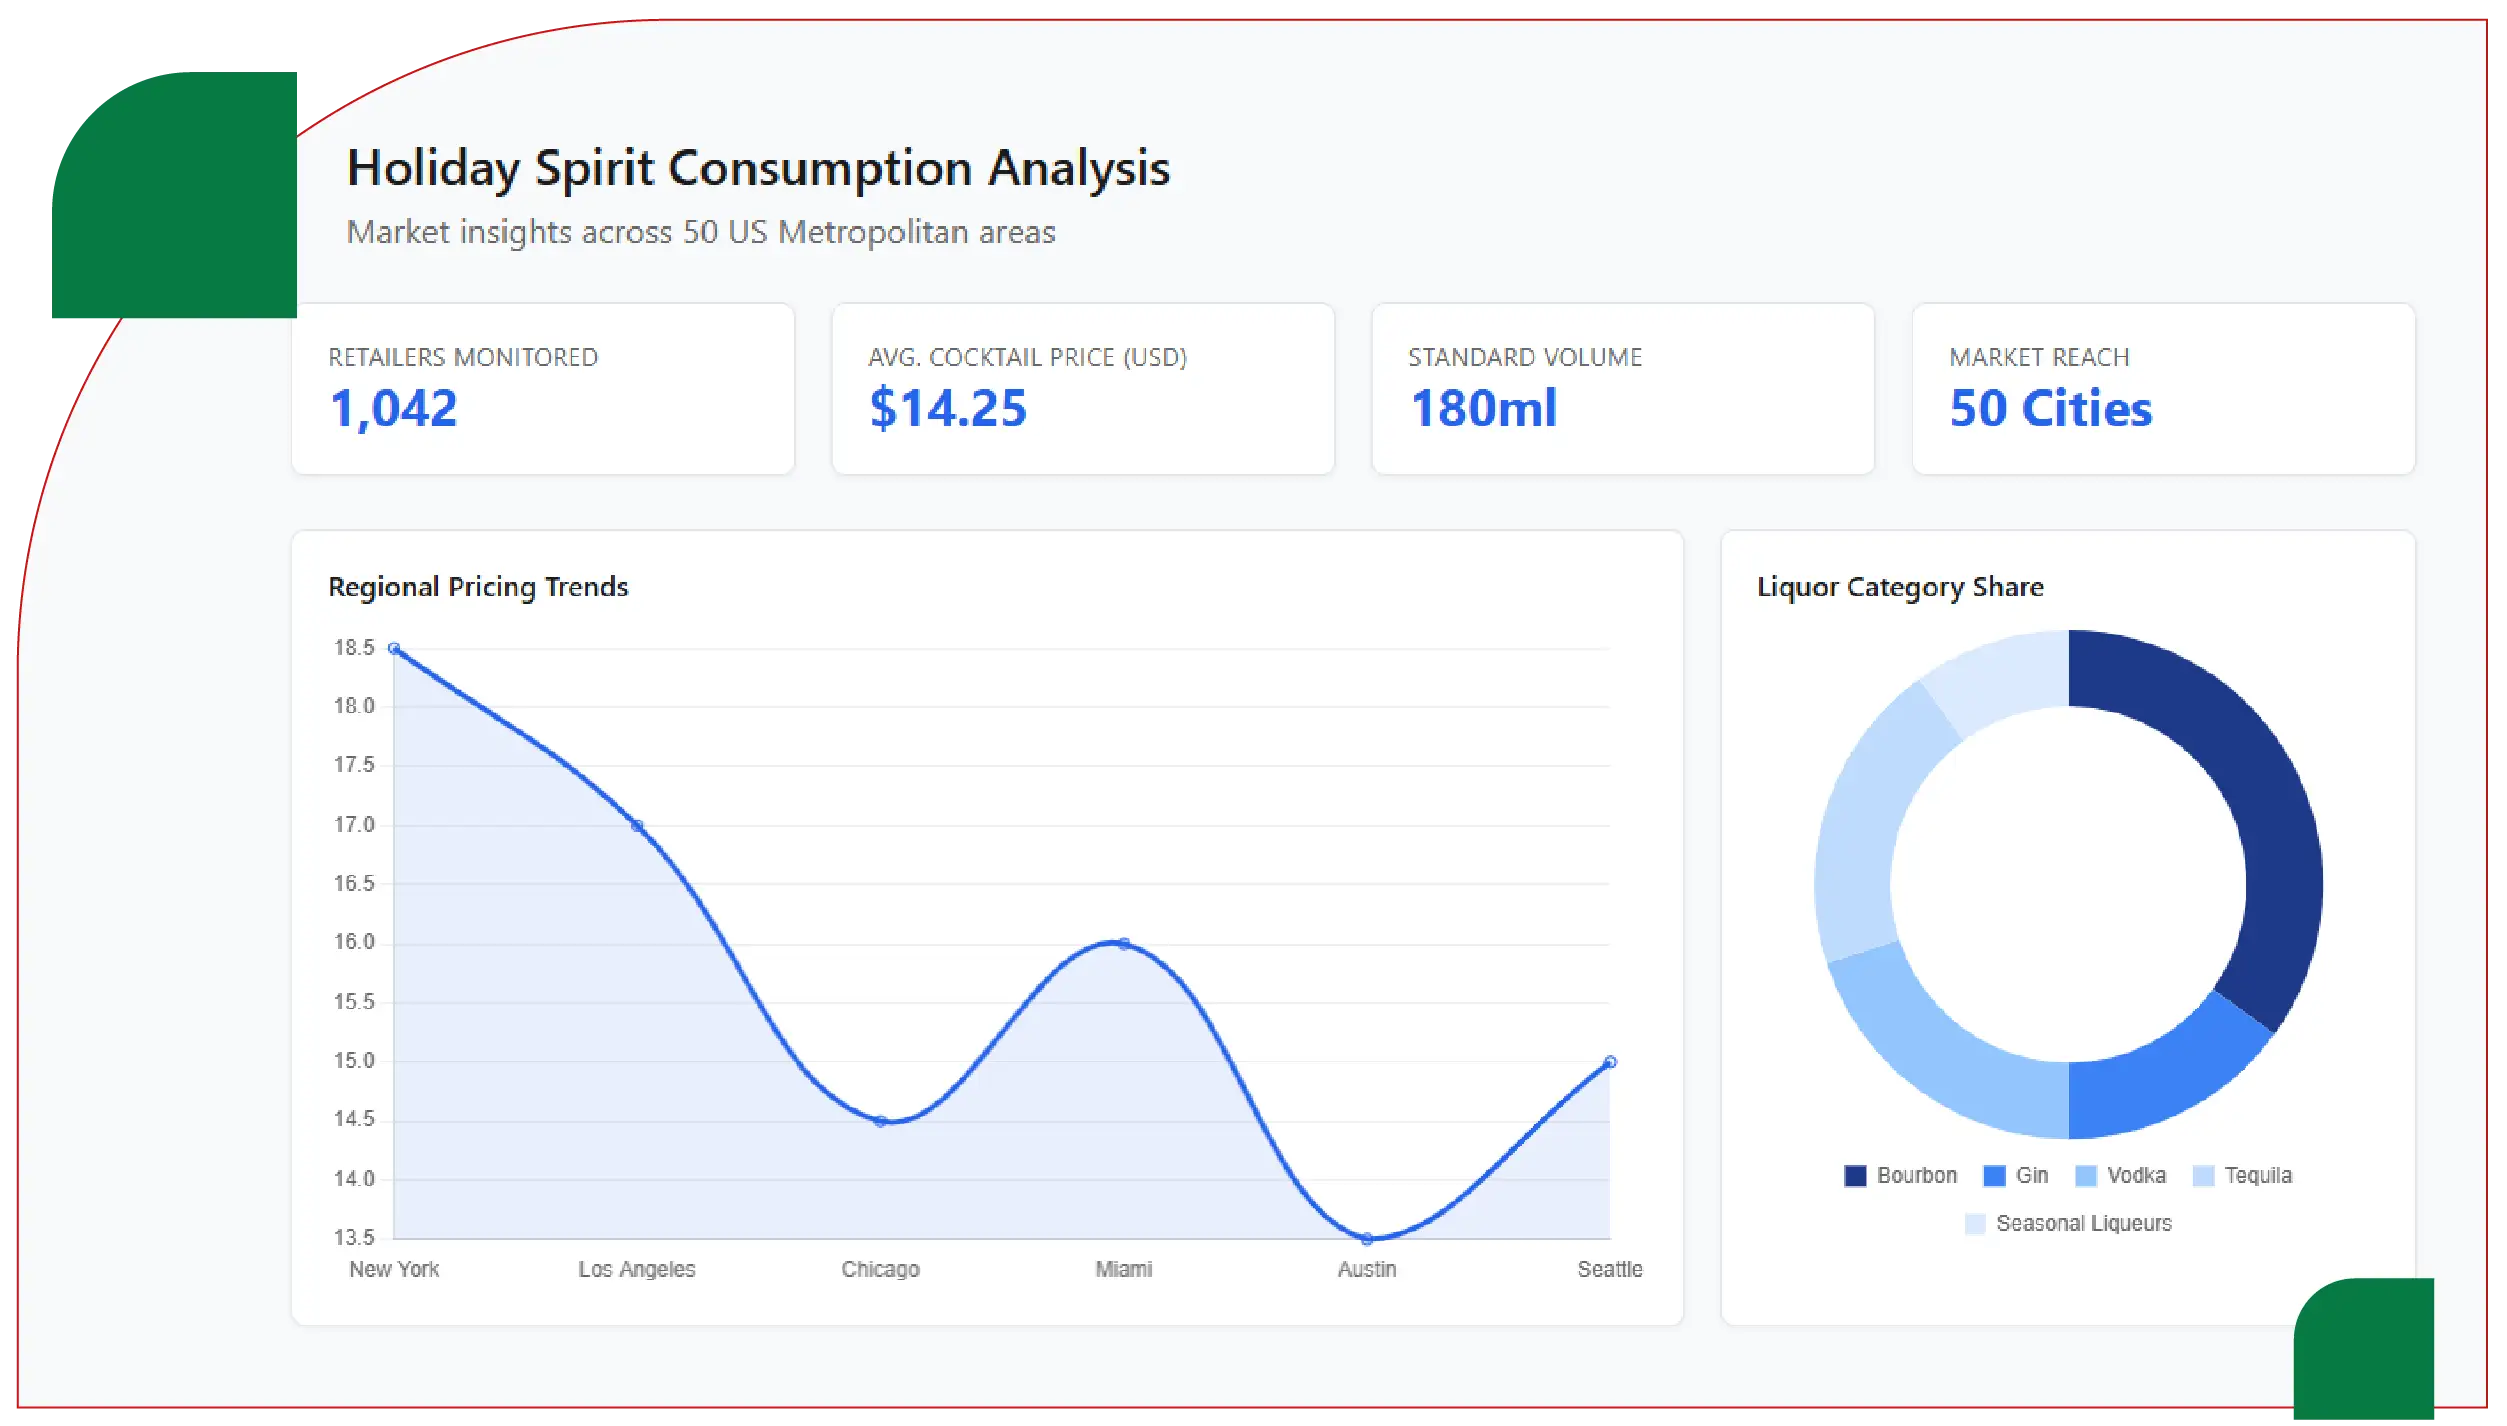
The dataset covers over 1,000 bars, restaurants, and liquor retailers, representing urban and suburban markets. This ensures that trends identified are representative and statistically significant.
Cocktail pricing is influenced by city demographics, ingredient quality, and venue type. Table 1 shows the average pricing for popular Christmas cocktails in selected US cities, providing a clear view of regional differences.
| City | Average Cocktail Price | Popular Drinks Included | Number of Bars Sampled |
|---|---|---|---|
| New York, NY | $14.50 | Eggnog Martini, Holiday Mule, Peppermint Moscow Mule | 35 |
| Los Angeles, CA | $13.80 | Cranberry Cosmo, Spiced Old Fashioned, Winter Mojito | 30 |
| Chicago, IL | $12.90 | Hot Toddy, Winter Mojito, Holiday Sangria | 28 |
| Miami, FL | $13.50 | Peppermint White Russian, Rum Punch, Festive Margarita | 25 |
| Dallas, TX | $12.40 | Bourbon Cider, Holiday Sangria, Spiced Whiskey Sour | 22 |
Key insights:
Understanding liquor consumption trends helps venues optimize inventory and plan seasonal promotions. Table 2 presents the top liquor categories by city, alongside average bottle prices and coverage across bars and retailers.
| City | Top Liquor Category | Average Bottle Price (USD) | Bars & Retailers Sampled |
|---|---|---|---|
| New York, NY | Whiskey | $45.00 | 40 |
| Los Angeles, CA | Vodka | $38.50 | 35 |
| Chicago, IL | Rum | $36.20 | 30 |
| Miami, FL | Tequila | $40.00 | 28 |
| Dallas, TX | Bourbon | $42.00 | 25 |
Key insights:
Eggnog Martinis, Peppermint Moscow Mules, and Holiday Mules dominate menus, reflecting high demand for premium, visually appealing cocktails. The high pricing indicates a willingness to pay for quality and festive presentation.
Cocktails emphasize color, presentation, and fruity flavors, with Cranberry Cosmos and Winter Mojitos topping the list. Data from Christmas Cocktail Menu Data Scraper Across US Cities highlights trends in Instagram-worthy, shareable drinks.
The cold winter drives demand for warm cocktails like Hot Toddies and spiced Sangrias. Whiskey-based cocktails remain popular, reflecting traditional midwestern preferences.
Peppermint White Russians and Rum Punch cater to festive tourists and locals, showing regional influence on cocktail selection.
Bourbon and cider-based cocktails are popular, reflecting a combination of regional taste and seasonal flavoring preferences.
Analyzing these trends offers several strategic advantages:
The insights gained from methods to Scrape Alcohol Price Data empower venues and retailers to optimize holiday cocktail offerings, pricing strategies, and promotional activities. Integrating this data into a Liquor Price Tracking Dashboard ensures continuous monitoring of competitive trends and market shifts. Leveraging Liquor Data Intelligence Services allows for accurate tracking of regional preferences, seasonal consumption patterns, and pricing trends, enabling data-driven business decisions.
Are you in need of high-class scraping services? Food Data Scrape should be your first point of call. We are undoubtedly the best in Food Data Aggregator and Mobile Grocery App Scraping service and we render impeccable data insights and analytics for strategic decision-making. With a legacy of excellence as our backbone, we help companies become data-driven, fueling their development. Please take advantage of our tailored solutions that will add value to your business. Contact us today to unlock the value of your data.

