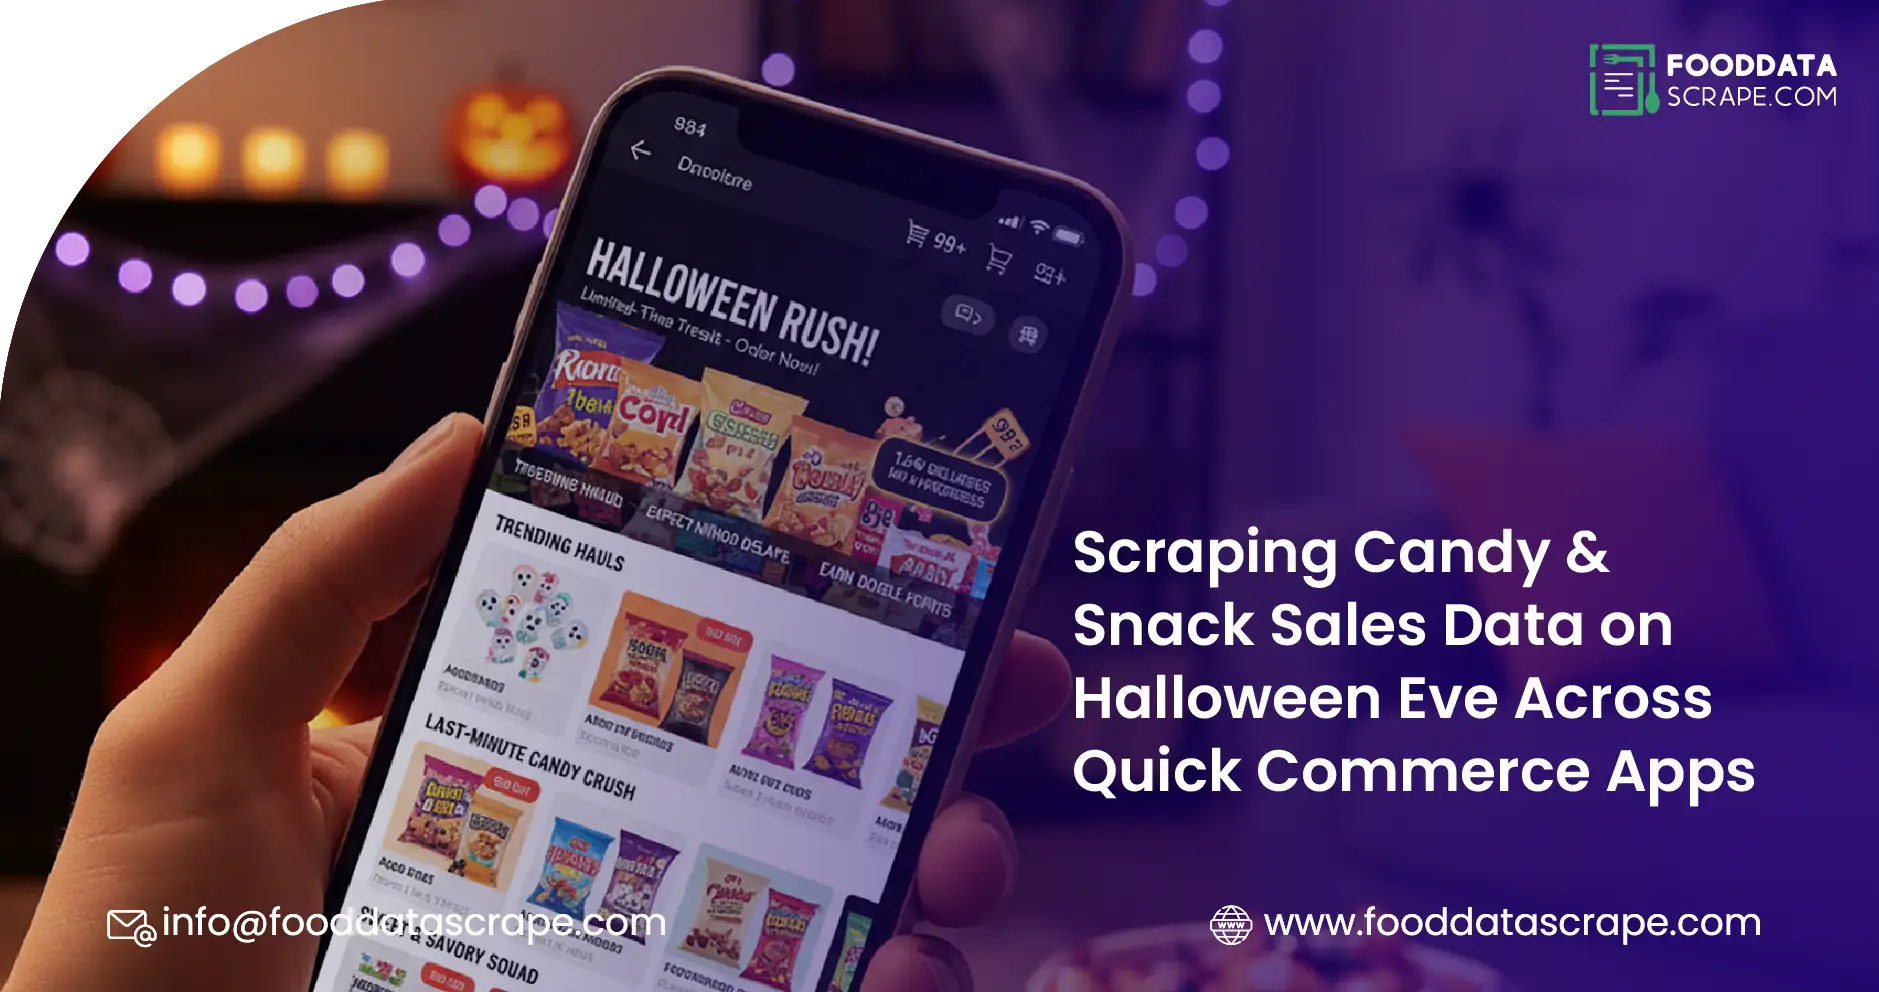
Introduction: The Data Behind the Halloween Candy Craze
Halloween isn’t just about costumes and decorations — it’s one of the biggest candy consumption festivals in the world. Each year, billions of dollars are spent on chocolates, gummies, and snacks in just a few days leading up to October 31. From the United States, United Kingdom, Canada, Germany, to Australia, Halloween drives massive retail activity as consumers rush to stock up on festive treats. With the explosive growth of quick commerce platforms like Gopuff, Instacart, Deliveroo, and Amazon Fresh, understanding real-time candy and snack sales has become critical for brands, retailers, and logistics companies alike. Scraping Candy & Snack Sales Data on Halloween Eve Across Quick Commerce Apps has emerged as an essential strategy to track trends, optimize inventory, and make data-driven business decisions.
That’s where Food Data Scrape comes in. Leveraging advanced web scraping and data extraction technologies, it tracks and analyzes Halloween candy and snack sales across multiple quick commerce and e-grocery apps. By building and analyzing Quick Commerce Datasets, Food Data Scrape helps brands understand real-time shifts in product popularity, pricing, and availability across regions. Through Web Scraping Quick Commerce Data, the company enables businesses to forecast product demand, monitor dynamic pricing, and identify top-selling SKUs across global markets. This data-driven approach helps companies uncover cross-country trends, adjust promotional strategies, and make smarter stocking decisions — turning Halloween excitement into measurable business growth.
Why Scraping Halloween Candy Sales Data Matters
Quick commerce apps have changed how consumers buy festive treats. Instead of buying early in supermarkets, most now order on-demand through mobile apps, especially during peak hours on Halloween Eve.
By implementing Halloween candy sales scraping, businesses can:
- Track trending candies and snack products across countries and cities.
- Analyze consumer demand spikes by hour or day.
- Monitor competitor promotions and pricing strategies.
- Predict stockouts and optimize delivery logistics.
This type of Halloween retail data scraping transforms seasonal chaos into structured, actionable intelligence.
Top 5 Countries with the Highest Halloween Participation
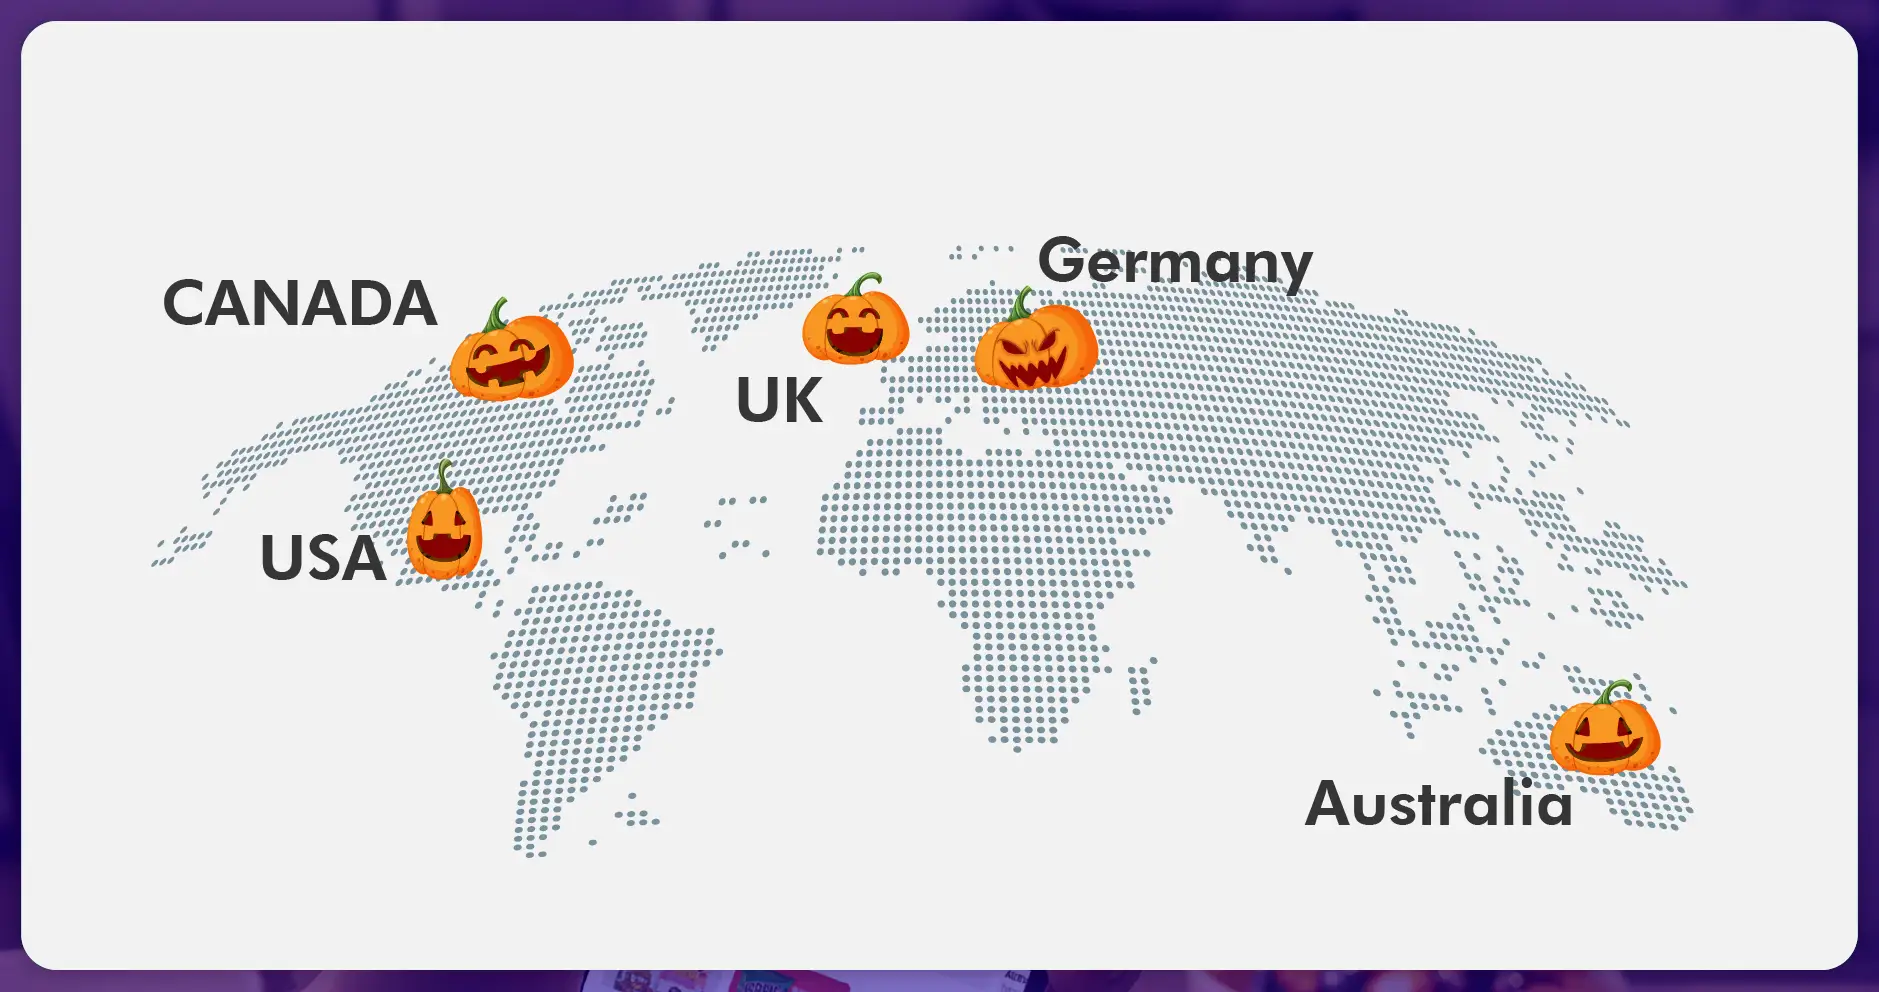
Using scraping-based insights from Food Data Scrape, here are the top 5 global markets where Halloween candy demand peaks the most:
| Rank | Country | Popular Halloween Treats | Key Insights from Scraping |
|---|---|---|---|
| 1 | United States | Reese’s, Snickers, KitKat, Hershey’s | Over $3B in candy sales. Chocolate dominates last-minute orders. |
| 2 | Canada | Coffee Crisp, Mars Bars, Twizzlers | Bulk candy packs rise 20% during Halloween week. |
| 3 | United Kingdom | Cadbury Screme Egg, Aero, Milkybar | Themed “Trick-or-Treat” boxes outperform single bars by 35%. |
| 4 | Australia | KitKat, Maltesers, Skittles | 40% of sales happen through quick commerce platforms like Uber Eats & Deliveroo. |
| 5 | Germany | Haribo, Trolli, Milka | Gummies and sour candies dominate; most orders occur on Oct 30. |
Halloween’s popularity in these regions makes real-time candy sales scraping essential for tracking regional demand, product diversity, and pricing shifts.
How Quick Commerce Apps Shape Halloween Shopping Behavior
Quick commerce platforms have completely transformed consumer habits. Apps like Gopuff (U.S.), Instacart (Canada), Ocado (UK), Deliveroo (Australia), and Amazon Fresh (Germany) now deliver candy and snacks within 15–30 minutes, creating a new level of instant retail gratification. With the help of Quick Commerce Data Scraping API, businesses can continuously track product availability, pricing patterns, and sales surges in real time. Combined with Quick Commerce Data Intelligence Services, retailers and FMCG brands gain a deeper understanding of how consumer demand fluctuates during festive events like Halloween — enabling them to react faster, restock smarter, and optimize promotions across multiple delivery apps.
From Food Data Scrape’s Halloween scraping data, the following consumer behaviors emerge:
- Peak ordering times: Between 5 PM and 10 PM on Halloween Eve.
- Impulse buying patterns: 45% of consumers add extra candy to cart when prompted by “trending now” banners.
- Price sensitivity: 1-in-3 buyers choose bulk packs over single bars when prices are reduced by 10% or more.
- Thematic packaging: “Spooky” or limited-edition wrappers outperform standard designs by 25%.
Such insights extracted through Halloween snack sales scraping allow brands to align pricing, stock, and packaging strategies with consumer psychology.
Sample Scraped Data from Food Data Scrape
Here’s an example of how Food Data Scrape structures scraped candy sales data from multiple countries and platforms:
| Product Name | Platform | Country | Price (Local Currency) | Units Sold | Promotion Type | Category |
|---|---|---|---|---|---|---|
| Snickers Chocolate Bar | Gopuff | USA | $1.50 | 3,200 | Buy 2 Get 1 | Chocolate |
| Sour Patch Kids | Instacart | Canada | $2.00 | 1,450 | 10% Off | Gummies |
| Cadbury Halloween Box | Ocado | UK | £5.00 | 2,200 | Bundle Offer | Mixed Pack |
| KitKat Spooky Edition | Deliveroo | Australia | A$3.50 | 1,700 | Flat 15% Off | Chocolate |
| Haribo Trick Mix | Amazon Fresh | Germany | €4.00 | 2,050 | Free Delivery | Gummies |
This dataset helps retailers compare regional sales velocity, price elasticity, and promotion efficiency, giving them a competitive advantage during the Halloween rush.
The Role of Food Data Scrape in Real-Time Analysis
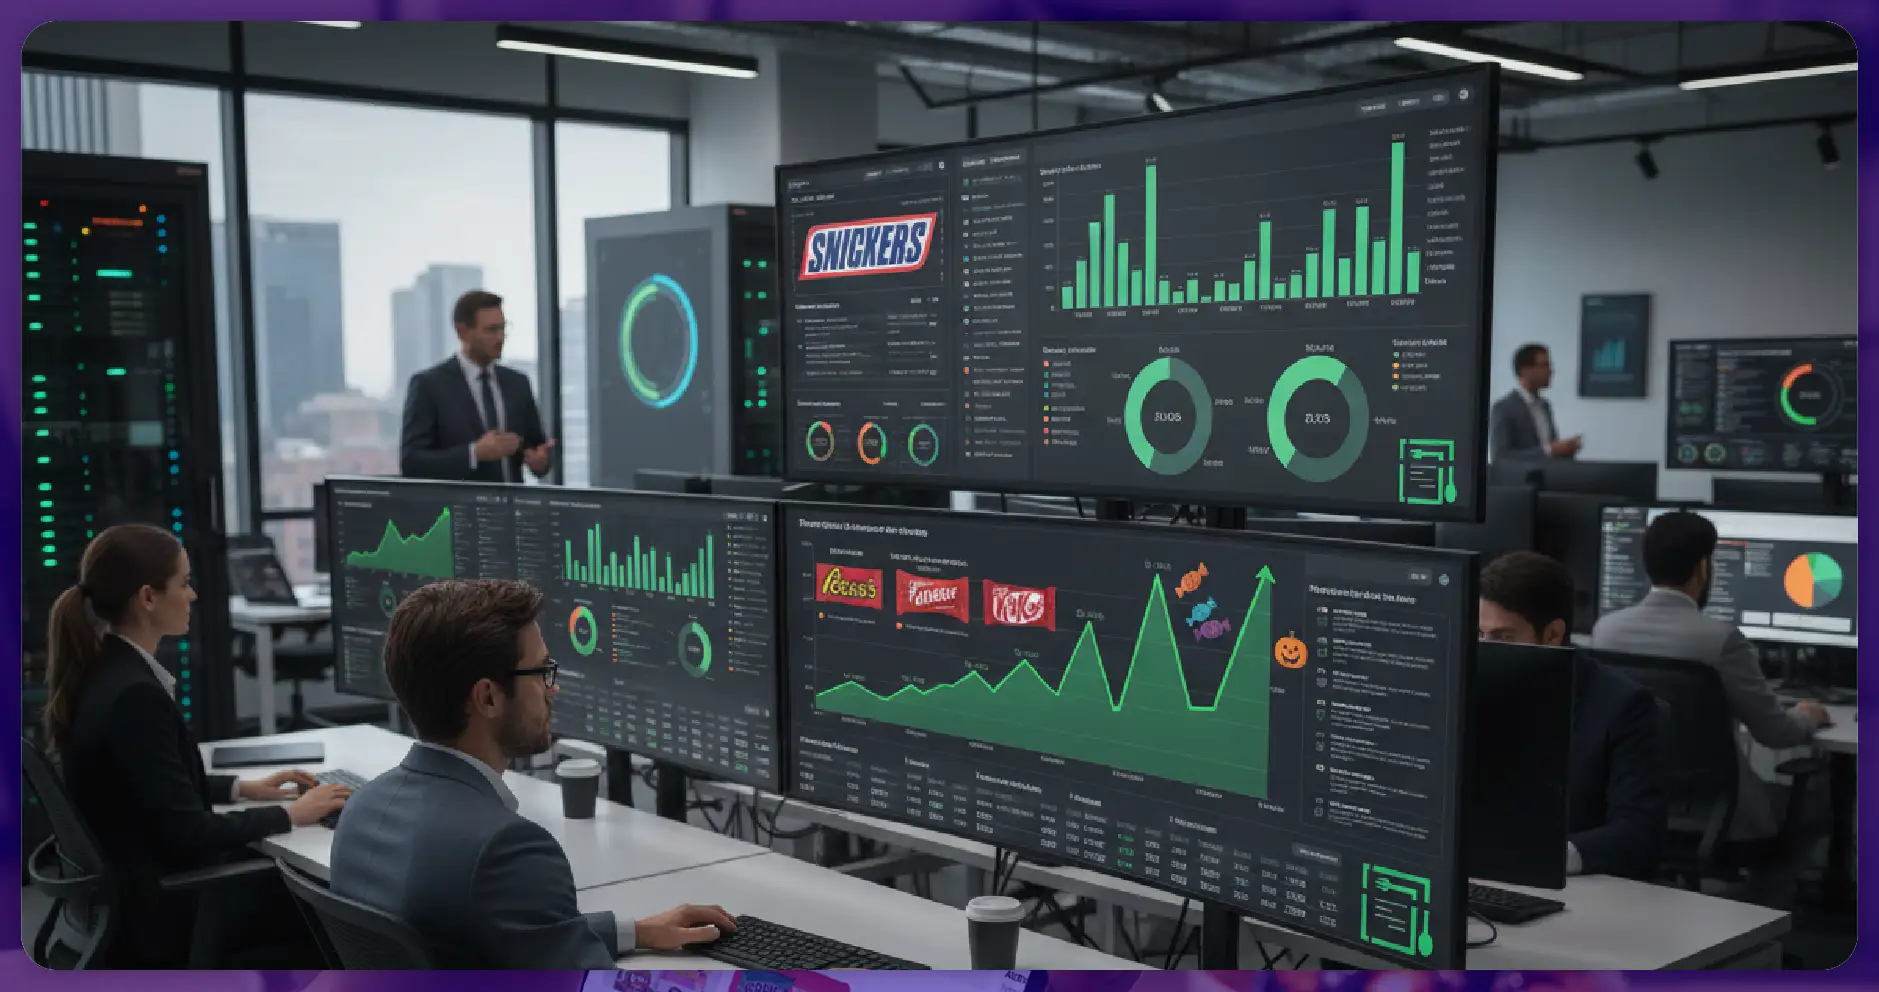
Food Data Scrape enables companies to gain a 360° view of candy and snack sales by:
- Scraping data from multiple platforms (quick commerce, e-commerce, and delivery apps).
- Structuring large datasets to identify sales patterns and time-based demand surges.
- Providing visual analytics dashboards for decision-makers.
- Monitoring reviews and ratings to assess product performance and sentiment.
For instance, during Halloween 2024, scraping data from U.S. apps showed that while Snickers and Reese’s held steady as favorites, Pumpkin Spice KitKats saw a 35% surge due to seasonal hype. Similar sentiment-driven patterns were noted across the UK and Canada.
Consumer Behavior Insights from Scraping Data
Halloween candy sales scraping also reveals how consumer segments differ:
- Families with kids (Ages 5–15): Prefer bundled “Trick-or-Treat” packs.
- Young adults: Choose premium chocolates and novelty snacks.
- Corporate buyers: Bulk-purchase candy for events between Oct 25–30.
By cross-analyzing these behaviors, Food Data Scrape enables personalization in promotions and targeted ads, improving conversion rates for brands and apps alike.
Predictive Analytics Using Halloween Candy Sales Scraping
Halloween candy and snack sales don’t just happen overnight — they follow predictable patterns influenced by geography, demographics, and app behavior. Using predictive data models built from web scraping Halloween sales data, Food Data Scrape helps brands forecast demand and optimize inventory ahead of time.
Key Predictive Insights:
- Candy demand spikes between October 25–31, especially on weekends.
- Urban buyers are 2.3x more likely to order last-minute snacks.
- Discount-driven purchases dominate the evening of October 30.
- Viral trends on TikTok and Instagram lead to 20–25% demand surges for specific candy types.
By integrating scraped e-commerce and quick commerce data, businesses can forecast price elasticity, predict out-of-stock products, and identify top-performing categories in each region.
For instance, scraping Halloween data from 2024 revealed that:
- The U.S. saw Snickers Mini Packs sell out 8 hours before Halloween Eve.
- In Australia, Maltesers Spooky Edition recorded a 40% increase in pre-orders.
- Germany’s Haribo Sour Mix sales doubled in the 48 hours leading up to Halloween.
Such predictive insights, derived from Food Data Scrape’s structured scraping datasets, empower businesses to stay ahead of demand curves.
Price Intelligence Through Web Scraping
Pricing strategy is critical during Halloween when thousands of brands compete for consumer attention. Food Data Scrape’s price scraping tools allow monitoring of:
- Dynamic pricing adjustments on apps like Gopuff, Instacart, and Amazon Fresh
- Regional variations in product costs
- Discount durations and offer cycles
- Competitor price matching behavior
Example: Price Data Snapshot (Halloween Week 2025)
| Product | Platform | Country | Avg. Price | Halloween Price | % Drop | Remark |
|---|---|---|---|---|---|---|
| Reese’s Peanut Butter Cups | Gopuff | USA | $2.25 | $1.80 | 20% | High discount drives bulk orders |
| Cadbury Screme Egg | Ocado | UK | £1.50 | £1.20 | 20% | Price drop triggers 30% sales boost |
| Trolli Sour Worms | Amazon Fresh | Germany | €3.00 | €2.70 | 10% | Demand stable across 3 days |
| KitKat Spooky Edition | Deliveroo | Australia | A$3.50 | A$2.99 | 15% | Discounted late-night orders rise |
| Mars Minis | Instacart | Canada | $4.00 | $3.20 | 20% | “Buy more, save more” drives sales |
This Halloween pricing dataset, scraped and structured by Food Data Scrape, highlights how real-time scraping empowers data-backed price decisions.
Retailers can benchmark against competitors, set optimal discounts, and ensure maximum conversion during peak hours.
Sentiment & Review Data Scraping
Beyond sales and prices, customer sentiment provides a human layer of intelligence. During Halloween, consumers often leave reviews about packaging, flavor variety, and delivery experience.
Food Data Scrape extracts and analyzes this review data from multiple quick commerce platforms, giving brands deep insights into consumer satisfaction.
Sample Review Insights:
| Product | Country | Sentiment | Common Keywords | Improvement Area |
|---|---|---|---|---|
| Reese’s Minis | USA | Positive | “fresh”, “quick delivery”, “tasty” | None |
| Cadbury Halloween Box | UK | Mixed | “cute packaging”, “small size” | Increase portion |
| Haribo Trick Mix | Germany | Positive | “fun flavors”, “good value” | Expand availability |
| KitKat Pumpkin Spice | Australia | Negative | “too sweet”, “limited stock” | Better inventory planning |
These patterns — identified through review data scraping and text analysis — help brands refine flavor launches, promotions, and regional availability for next season.
Unlock actionable insights and boost your Halloween candy sales—start leveraging our advanced data scraping services today!
How Retailers Benefit from Food Data Scrape
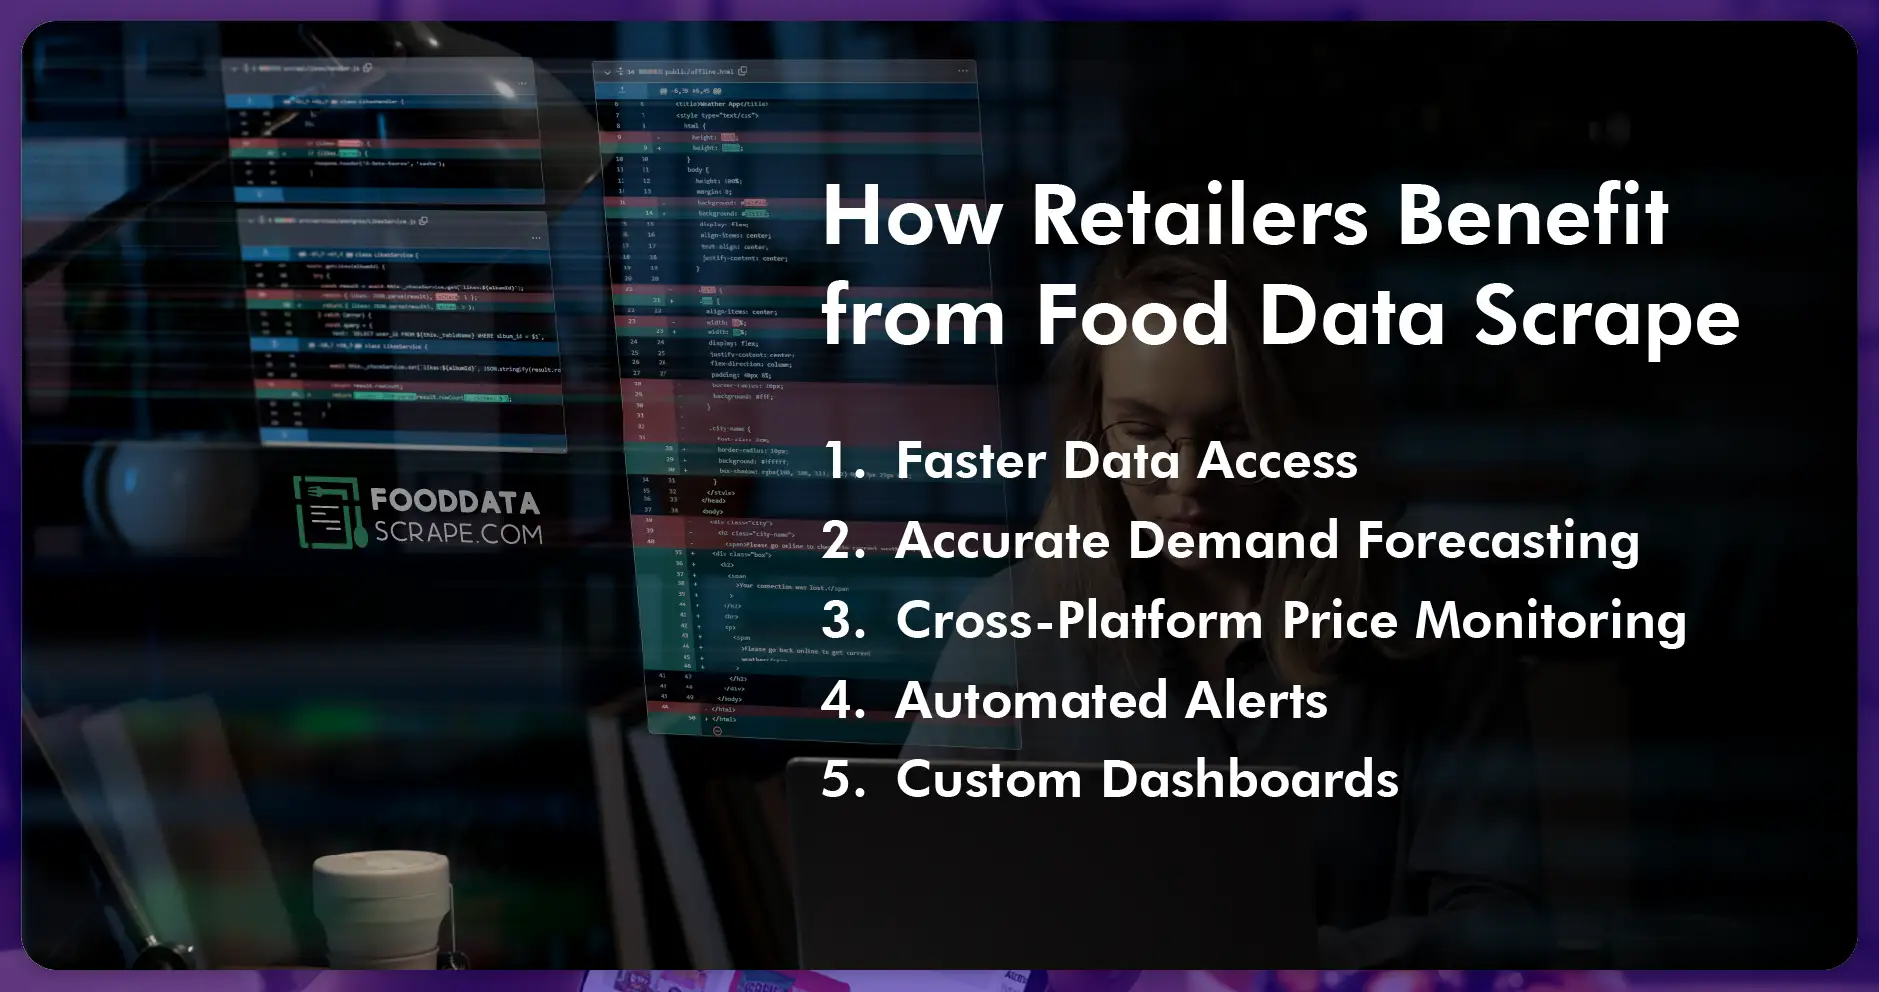
Halloween is a short but high-impact retail window. Using Halloween sales data scraping, Food Data Scrape provides clients with a complete picture of market movement across platforms and countries.
Retailer Benefits:
- Faster Data Access: Get Halloween product data from multiple apps in minutes.
- Accurate Demand Forecasting: Predict candy and snack demand by SKU and location.
- Cross-Platform Price Monitoring: Compare how promotions differ between apps.
- Automated Alerts: Receive updates when competitor pricing or stock changes.
- Custom Dashboards: Visualize Halloween trends using interactive charts.
This approach transforms raw scraped data into actionable insights for better decision-making.
Country-Specific Case Studies from Halloween 2024
-
United States:
- Platforms Tracked: Gopuff, Amazon Fresh, Walmart+
- Food Data Scrape identified a 35% increase in chocolate category sales in the final 72 hours before Halloween. Reese’s and Snickers led the charts, with bulk-buying behavior driven by local flash discounts.
-
United Kingdom:
- Platforms Tracked: Ocado, Deliveroo, Tesco Online
- Trick-or-treat multipacks and Cadbury Halloween boxes topped demand charts. Halloween scraping data showed that themed packaging had a 40% higher click-through rate than generic candy items.
-
Canada:
- Platforms Tracked: Instacart, Metro Online
- Consumers leaned towards value packs. Food Data Scrape’s data revealed that candy bundles with free shipping saw a 28% higher conversion rate.
-
Germany:
- Platforms Tracked: Amazon Fresh, REWE
- Gummy candy brands like Haribo and Trolli dominated the charts. Real-time scraping data revealed that product availability dropped 18% on Halloween day due to under-forecasting.
-
Australia:
- Platforms Tracked: Deliveroo, Woolworths Online
- The spooky-themed KitKat edition sold out 24 hours before Halloween. Halloween scraping data indicated that earlier restocks could have boosted sales by 15%.
Turning Halloween Data into Business Intelligence
Once scraping is complete, Food Data Scrape transforms Halloween datasets into business-ready intelligence. The insights help:
- Manufacturers adjust candy production volumes.
- Retailers plan inventory and regional pricing.
- Quick commerce apps improve delivery and promotion timing.
- Marketing teams identify the right products to push during last-minute orders.
These insights don’t just apply to Halloween — the same scraping framework works for Easter, Christmas, Valentine’s Day, and other seasonal sales peaks.
Conclusion: The Future of Seasonal Sales Analytics
The Halloween 2025 season demonstrates how real-time scraping has redefined retail intelligence. With massive sales driven by quick commerce platforms, tracking, analyzing, and forecasting candy and snack data is no longer optional — it’s essential.
Food Data Scrape enables brands, FMCG companies, and analytics firms to capture every data point — from real-time prices and regional demand to consumer sentiment and product availability.
By leveraging Halloween candy and snack sales scraping, businesses gain an unmatched competitive edge in understanding seasonal buying patterns — not just in the U.S., but across Canada, the UK, Germany, and Australia.
As the world embraces data-driven decision-making, Food Data Scrape stands as the trusted partner for seasonal sales data scraping, price intelligence, and market analytics, turning festive chaos into measurable growth.
Are you in need of high-class scraping services? Food Data Scrape should be your first point of call. We are undoubtedly the best in Food Data Aggregator and Mobile Grocery App Scraping service and we render impeccable data insights and analytics for strategic decision-making. With a legacy of excellence as our backbone, we help companies become data-driven, fueling their development. Please take advantage of our tailored solutions that will add value to your business. Contact us today to unlock the value of your data.

