
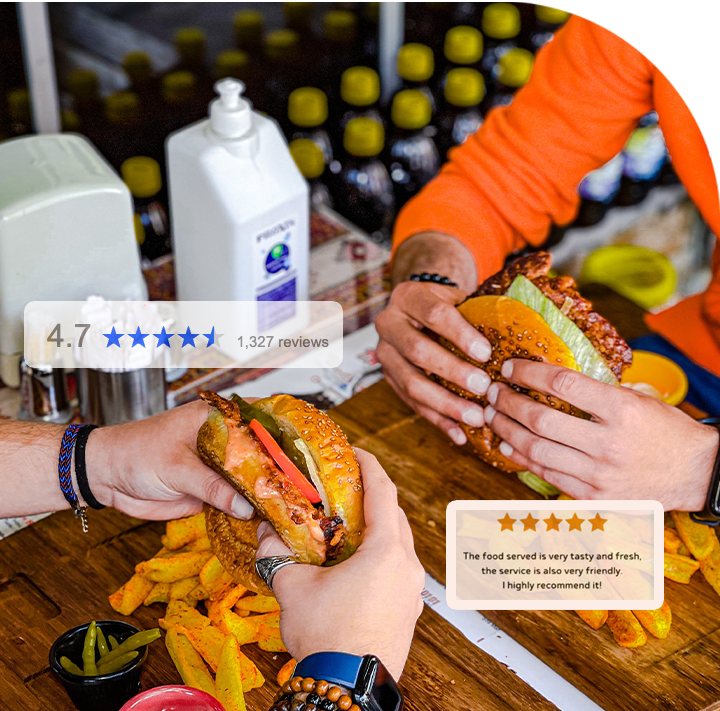
This comprehensive report amalgamates diverse data sources and methodologies, utilizing tools like The Data Store and Google Reviews Scraper. Analyzing the vast dataset of 21,997 fast-food chain locations, including giants like McDonald's, Starbucks, and Chick-fil-A, it employs distributed computing frameworks like Dask to handle the substantial dataset efficiently. The report delves into geographical distribution, sentiment analysis, and state-wise preferences. McDonald's has the highest negative reviews, while Chick-fil-A and Raising Cane's showcase overwhelmingly positive sentiments. The analysis unveils the success strategies of Chick-fil-A and Starbucks, emphasizing staff appreciation, service excellence, and commendations for food and beverage offerings. The report provides transformative insights into the factors shaping the fast-food industry, emphasizing the crucial role of food quality and customer experience.

We amalgamated three products for this purpose: The Data Store, where we acquired a bundle of the Top 10 Food Chains In the USA, Food data scrape for Local Business Information from Google Maps to collect the place-ids of each location, and Google Reviews Scraper to compile the reviews for each location.
The store dataset provided fast-food chain locations, including latitude and longitude. Utilizing Food data scrape, we retrieved the Place ID from Google Maps, seamlessly feeding it into the Reviews Scraper. Though the process was intricate and time-consuming, our restaurant data scraping services simplified it, enabling us to scrape all data effortlessly without coding. For our analysis, we selected prominent fast-food chains, such as McDonald's, Starbucks, Chick-Fil-A, Sonic Drive-In, Dunkin Donuts, Arbys, Waffle House, Buffalo Wild Wings, Raising Cane's, Jimmy John's, Tim Hortons, and Baskin Robbins.
Buffalo Wild Wings, Raising Cane's, Jimmy John's, Tim Hortons, and Baskin Robbins. This comprehensive list provides a diverse array of chains, offering insights into the broad spectrum of the fast-food industry and capturing reviews from individuals with varied tastes. Let's delve into the analysis without further ado and uncover the valuable insights that the data can reveal.
We aggregate the data above into a CSV file, a widely used open standard for datasets. However, there's a caveat: the dataset is substantial, around 12 GB, exceeding the memory capacity of most conventional computers. Fortunately, tools like Dask and Spark come to our rescue. These distributed computing frameworks enable us to distribute our analysis across multiple cores and systems. They facilitate out-of-core computation, eliminating the need to load the entire dataset into RAM and allowing efficient handling of large datasets like ours. While delving into the technicalities isn't our focus today, we aim to highlight the tools for deriving insights from extensive datasets. For this task, we opted for Dask, leveraging its similarity to Pandas' API, allowing us to execute most of our Pandas code with minimal modifications. We initiate Dask in our notebook with the following import statement:

You can now load the CSV file, similar to Pandas, using the read_csv() function.

The initial step upon receiving a dataset is to examine its number of records, where the convenient len() function proves valuable.

Handling around 20 million rows of data can be complex, particularly given the inherent messiness of user-generated content on the internet. Before diving into our analyses after scraping US fast food chains' data, it's crucial to perform data cleaning to sift through the noise and enhance the quality of our results.
Before we proceed, let's examine the table's structure and take stock of the fields available for our analysis.

Since Dask is for distributed processing and massive datasets, it encounters limitations when dealing with CSV files. CSV, being less friendly to extensive data operations, can hinder performance. A more efficient approach to address this involves converting the data to the Parquet file format.
Dask incorporates a concept similar to Apache Spark known as partitions. It involves dividing the data into multiple segments, allowing individual processing on each partition before aggregating the results. This partition-based strategy facilitates scalability by enabling the assignment of each partition's computation to separate cores, enhancing overall performance. Before storing the data as Parquet, it's advisable to leverage Dask's capability to repartition it for optimal processing efficiency.

Convert it

Load the Parquet file using the read_parquet function, and you'll seamlessly harness the advantages of parallel computation for enhanced processing efficiency.

Our initial cleaning step involves removing null rows that lack any data.
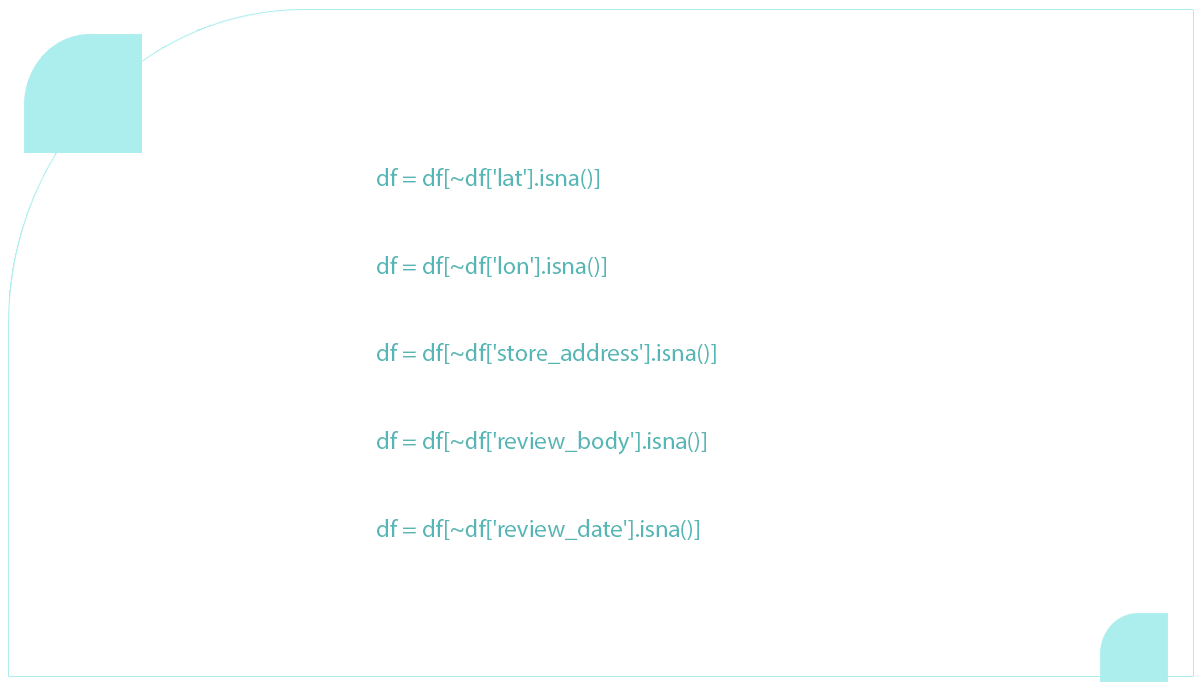
Since this information is vital, we've excluded all rows with NA values in essential fields such as latitude, longitude, store address, review body, and review date. Null values render the data useless to scrape US fast food chains and analyze the collected data.
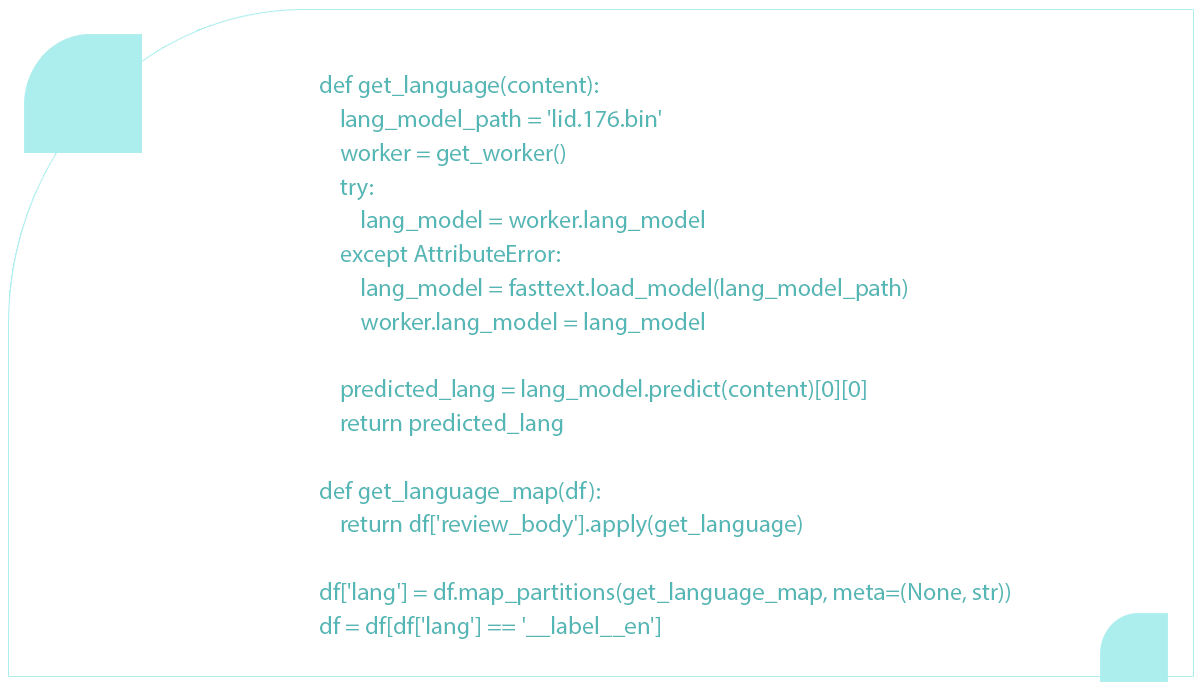
We'll employ Fasttext's language identification model to narrow our focus to English-language reviews. A utility function is for this purpose, and you can seamlessly integrate it as follows.
Next, let's streamline our dataset by filtering out optional columns for our analysis.

If you need to revisit this analysis, you can store this intermediate cleaned data in the Parquet format using the provided functions.
Now, let's explore the number of reviews for each fast-food chain. We can achieve this by grouping the data based on the provider and utilizing the review text field for counting reviews. Subsequently, we can sort the results in descending order.

When visualizing this data, the resulting plot appears as follows: [description of the plot goes here
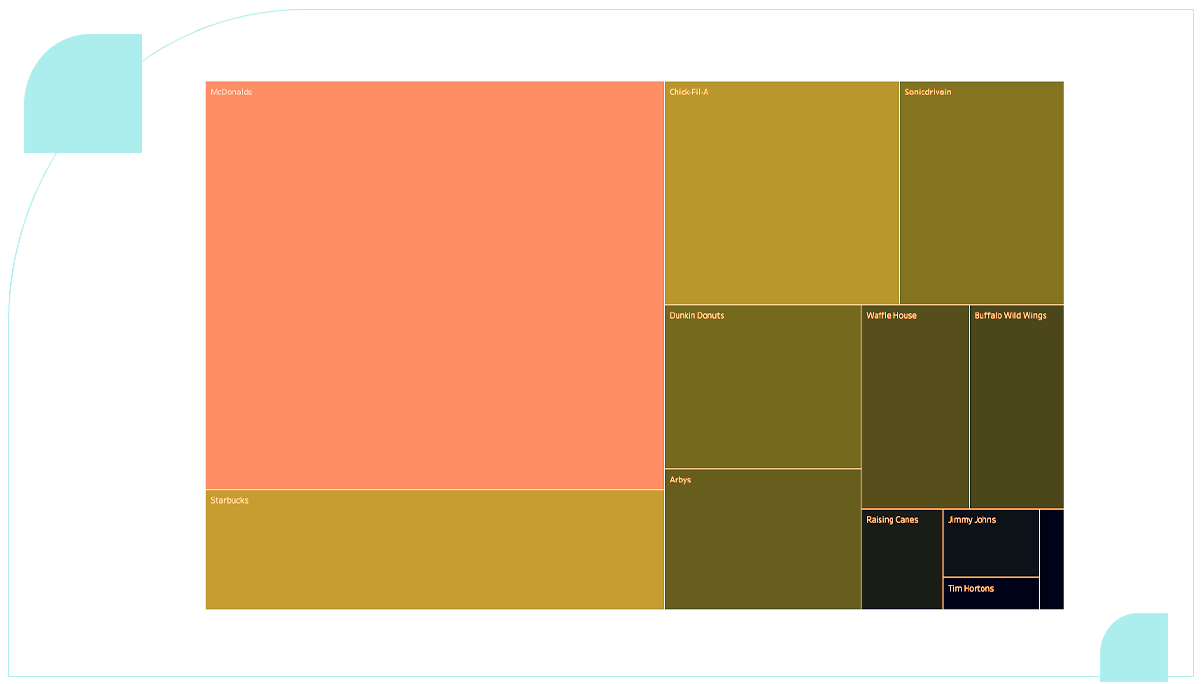
It reveals that McDonald's dominates the review count, indicating its substantial popularity. It surpasses the next contender, Starbucks, by an impressive margin of 5 million reviews.
To explore the geographical distribution of these fast-food restaurants, we can create a map plotting their locations. Since each restaurant may have multiple reviews, we'll group the data by latitude, longitude, and provider to identify unique combinations. Finally, we'll visualize the results on a map.

Executing the computation above yielded a total of 56,288 restaurants across all providers. When visualizing this data on a map, the resulting plot looks like the following: [description of the map visualization goes here.
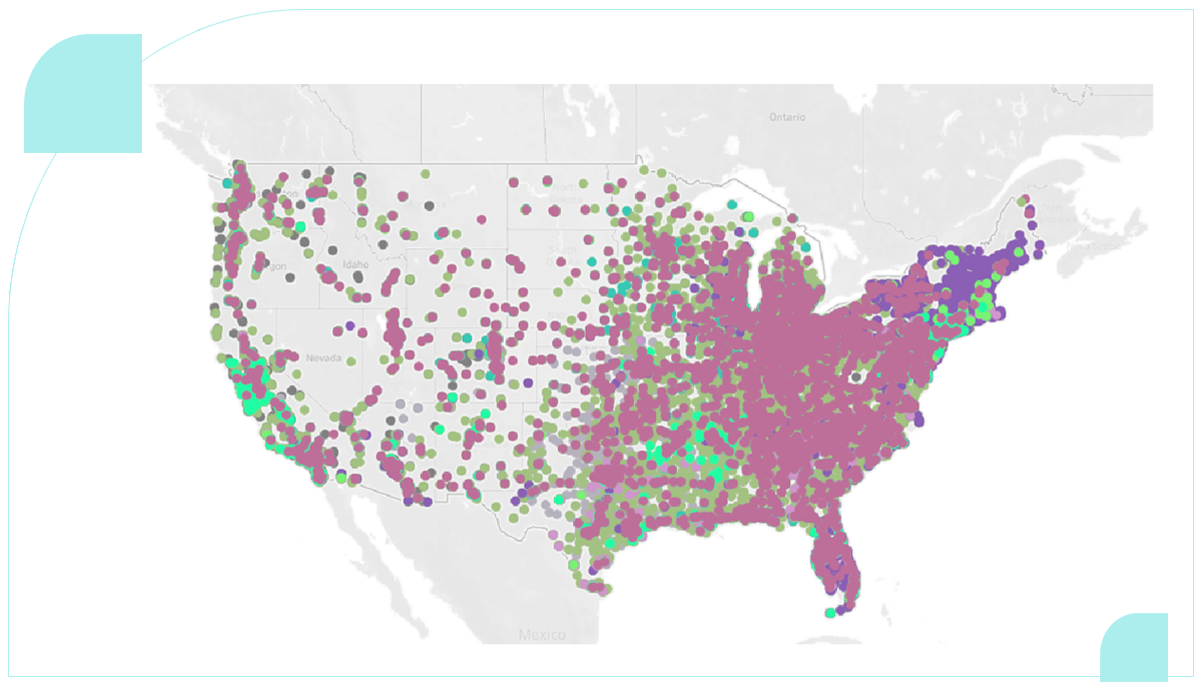
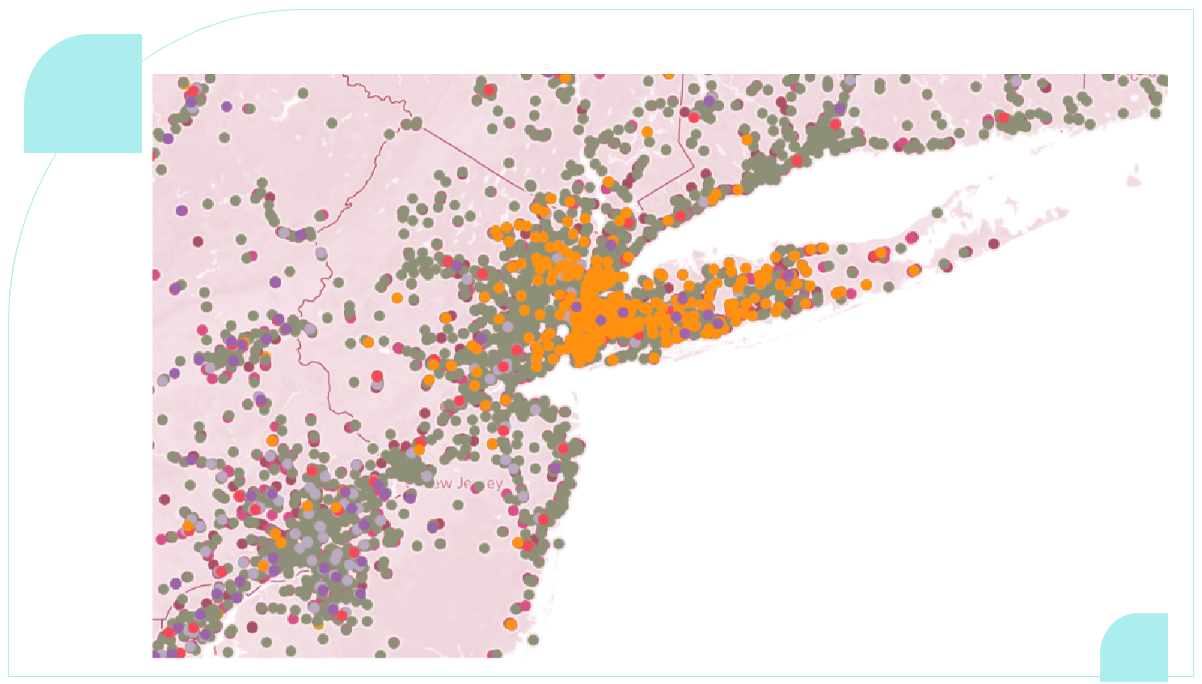
While the map may appear crowded, a notable concentration is evident toward the east coast, aligning with higher population density. Additionally, the fast-food chains are color-graded for clarity. For a more detailed view, let's zoom in to explore the city of New York.
To enhance visualization, we can generate a color-graded map reflecting the distribution of stores. The code snippet below accomplishes this:
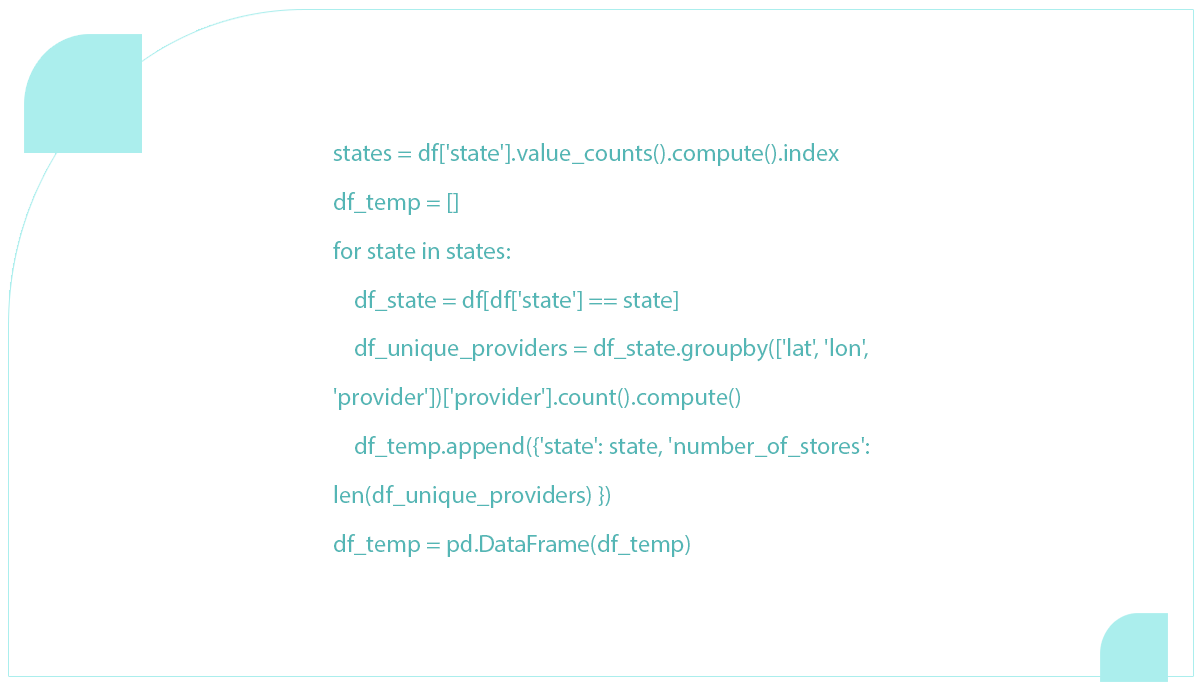
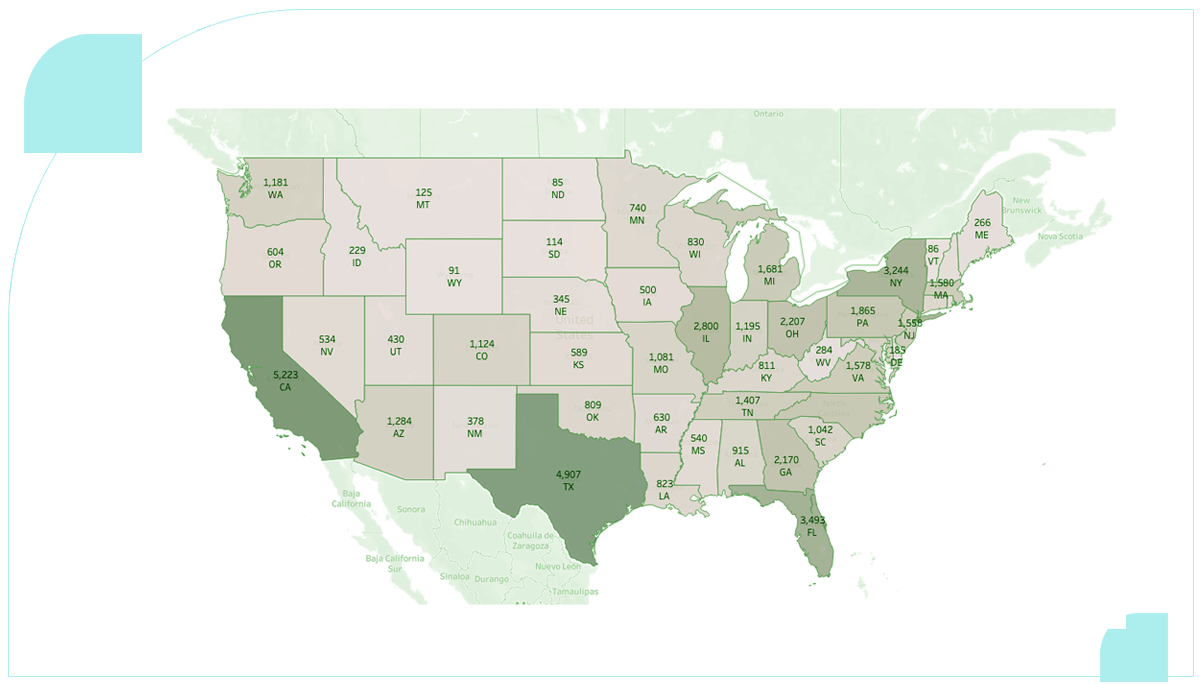
To determine if the pattern observed in the distribution of fast food stores is available in customer reviews, we can investigate by grouping the entire data frame by state. The following code achieves this:

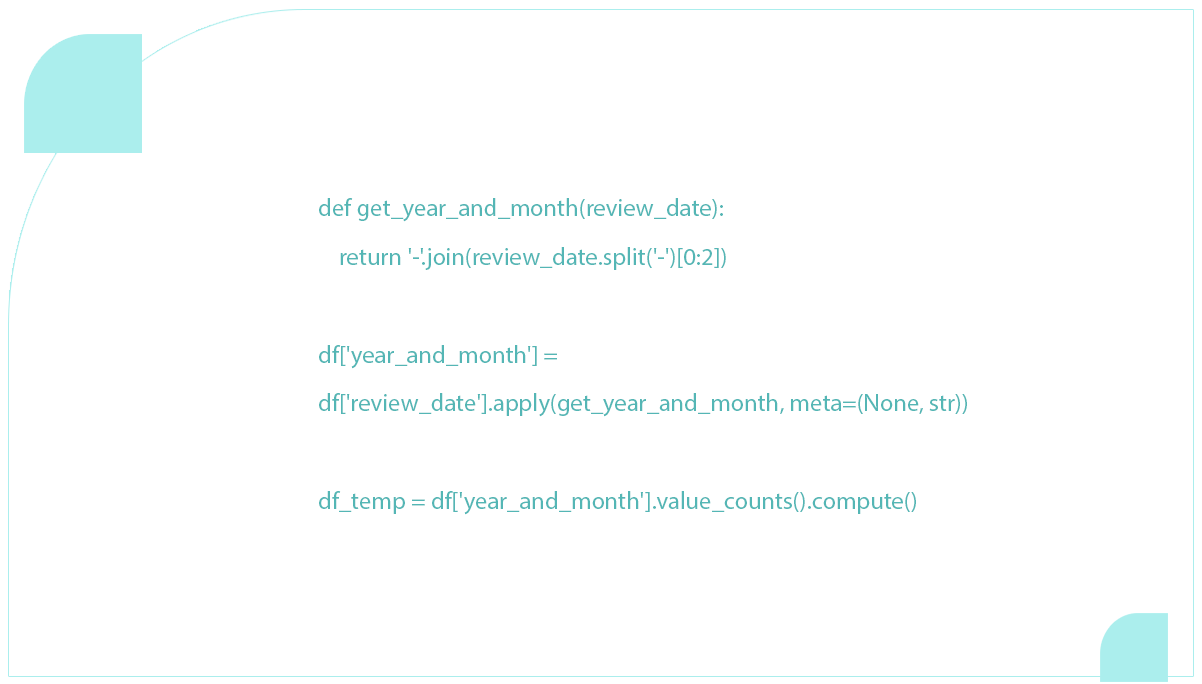
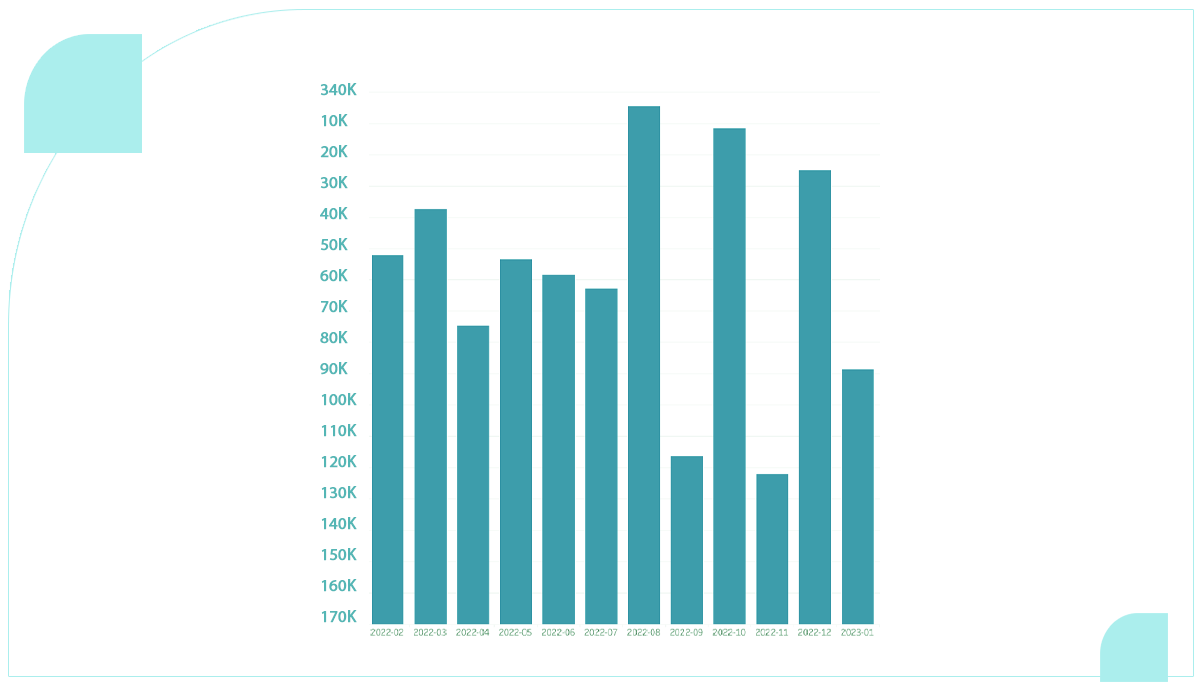
To plot reviews over time starting from February 2022, we can create a utility function to extract the month and date from the review date column. The modified code is as follows:
We determine the number of reviews each month and visualize the results on a graph.
To discern customers' overall sentiment for each fast-food chain, we can compute the mean of the 5-point rating. Here's the adapted code:

We will examine this in the following section to verify if the observed trend in mean review ratings for McDonald's and Chick-fil-A is in the actual review text. Here's the adapted text:
"We will now investigate whether the textual content of reviews aligns with the previously observed trend of McDonald's having a lower mean review rating than Chick-fil-A, which has the highest rating."
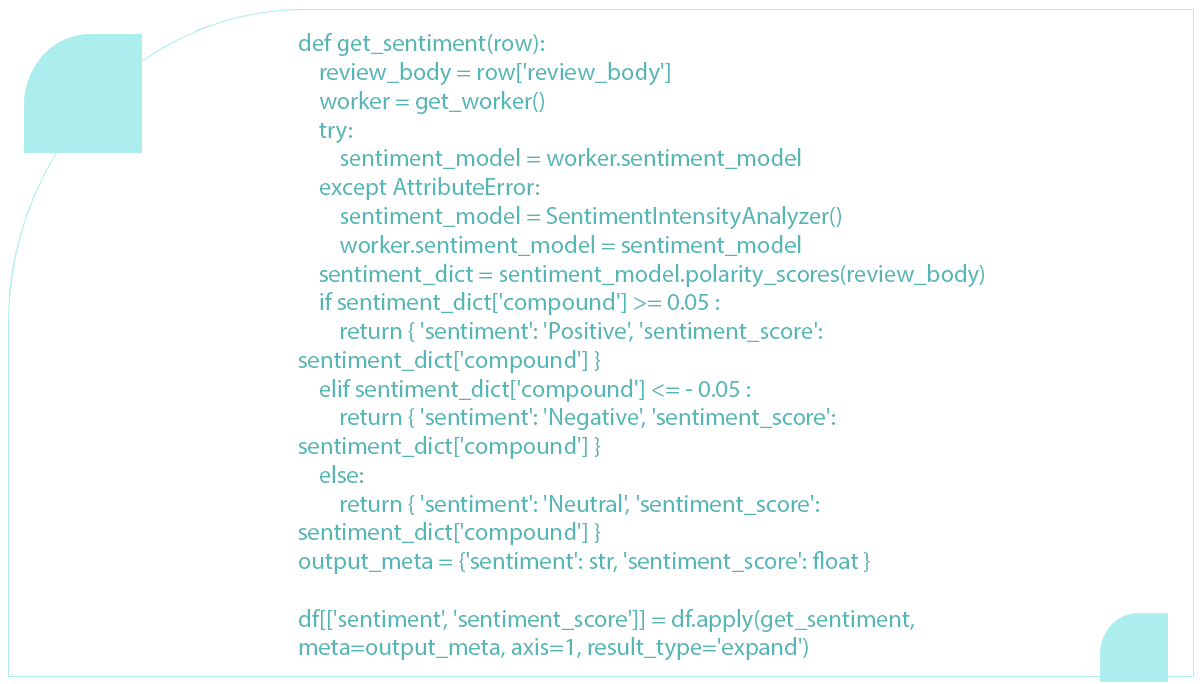
Our next step involves delving into the review text to gain insights into people's sentiments. We'll conduct sentiment analysis on the reviews using the Vader Sentiment analysis library to achieve this. We opted for this library due to its speed and reasonable accuracy. Our function provides sentiment labels (Positive, Negative, Neutral) and corresponding scores.
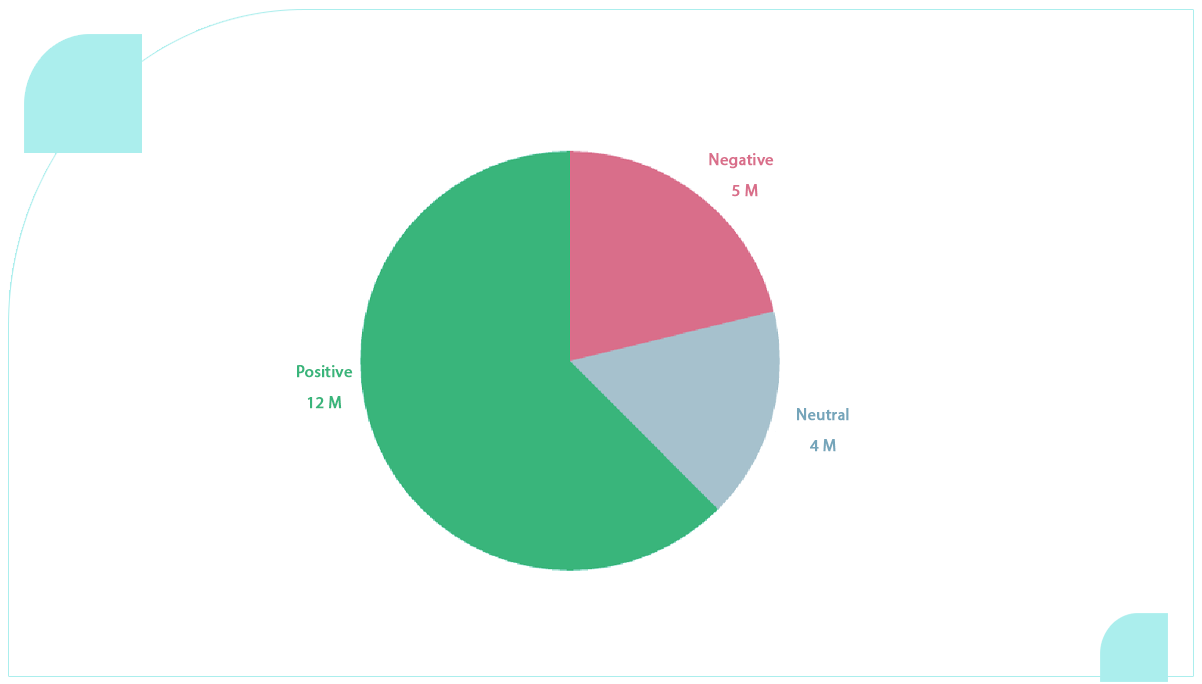
We can determine the counts of positive, negative, and neutral reviews to obtain a comprehensive overview. It will provide insights into the sentiment distribution among the collected reviews.

The analysis reveals a notable predominance of positive reviews, nearly three times the quantity of negative ones.
We'll represent the positive, negative, and neutral ratios to identify the fast-food chains with the highest proportion of negative reviews, considering variations in the total number of reviews for each chain. Let's visualize this information in a plot.

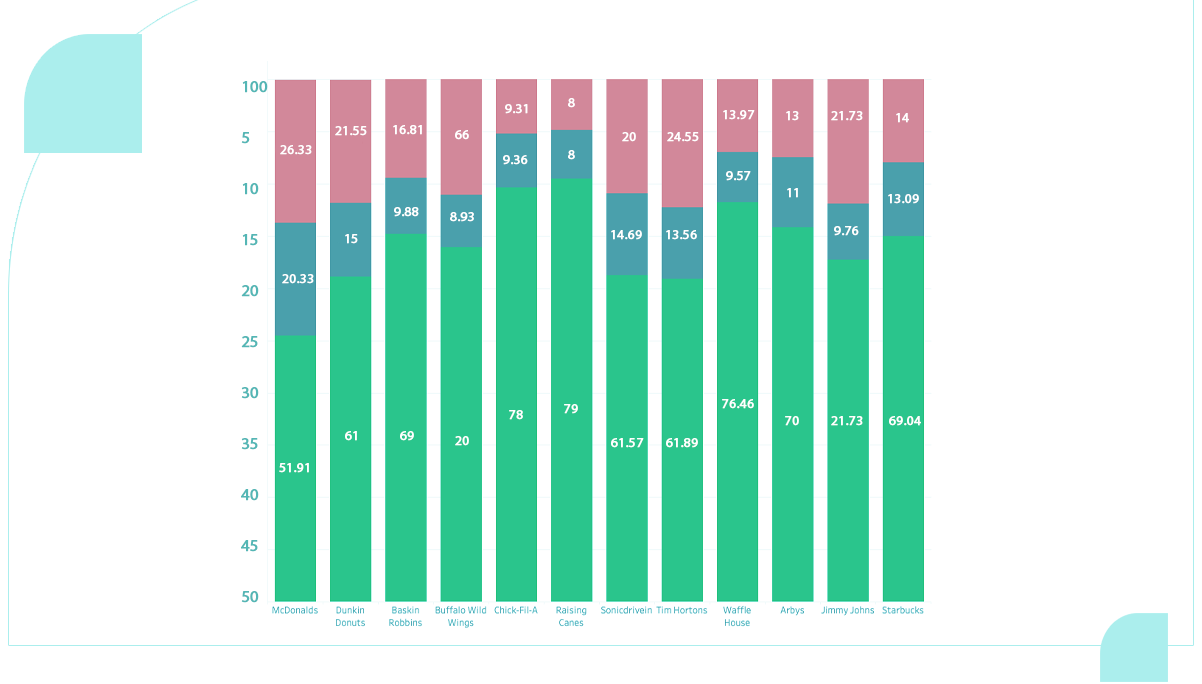
Among the fast-food chains, McDonald's exhibits the highest percentage of negative reviews, accounting for one-third of the total reviews. Conversely, chains like Raising Cane's and Chick-fil-A boast an overwhelmingly positive sentiment, with nearly 80% of their reviews categorized as positive.
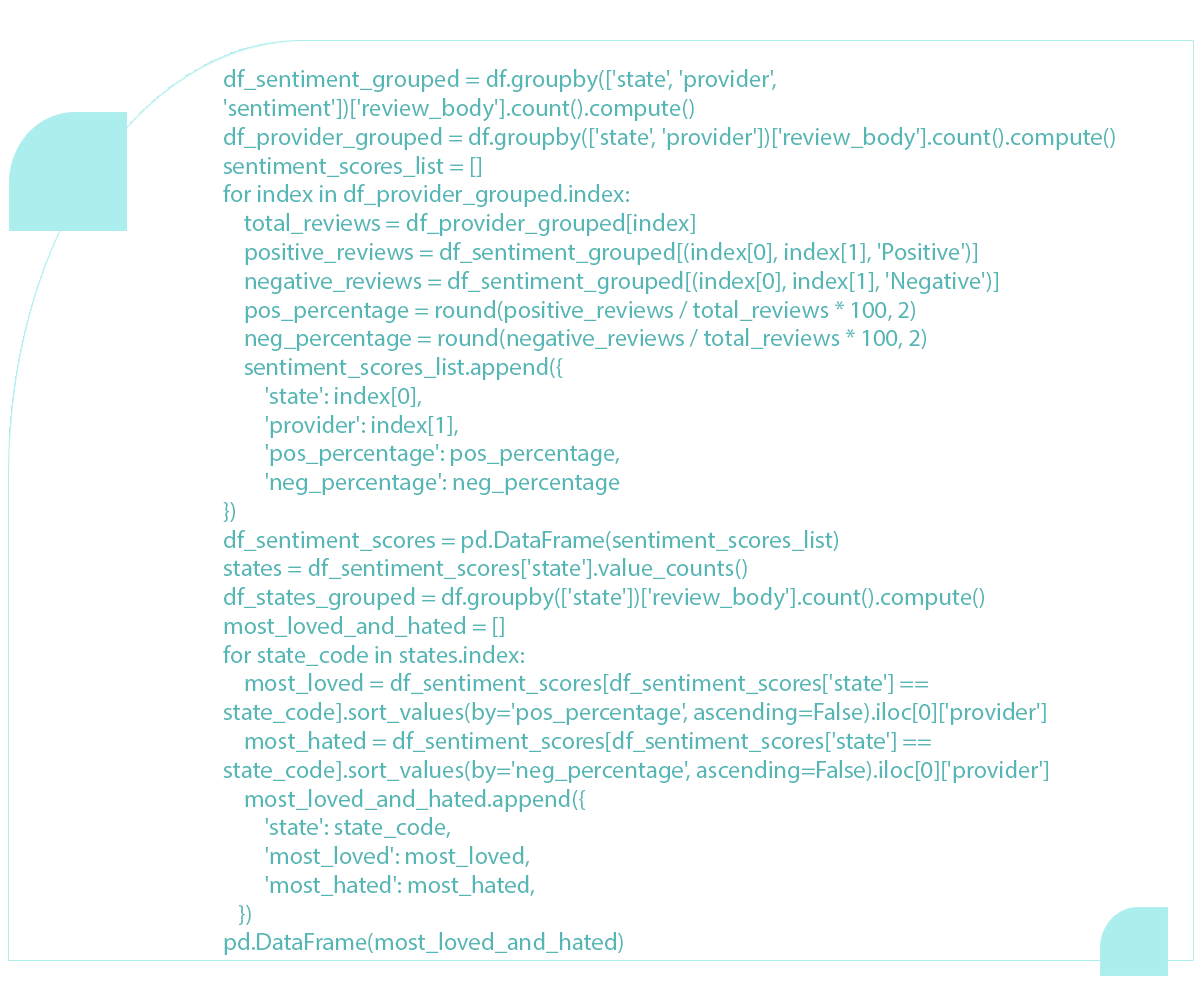
Let's delve further into public sentiment. We will identify the fast-food chains that receive the most and least favorable reviews state by state.
Impressively, Chick-fil-A captures the admiration of a significant portion of the American North, while Raising Cane dominates as the preferred choice in most of the American South. An interesting exception is Florida, where Waffle House emerges as the favored fast-food establishment.
Moving on to the less favored options, let's visualize the fast-food restaurants that receive the most negative reviews on a state-by-state.
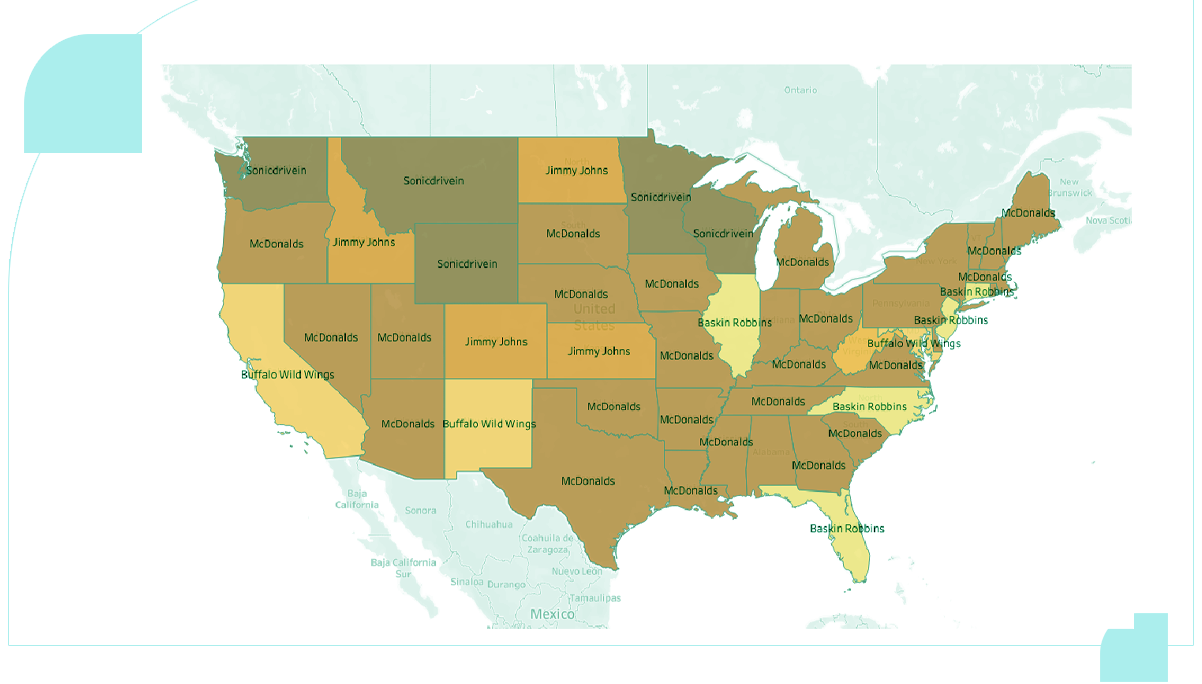
McDonald’s continues to face a lack of favor, and in various states, it shares the spotlight with Buffalo Wild Wings and Baskin Robbins as some of the least positively reviewed fast-food providers.
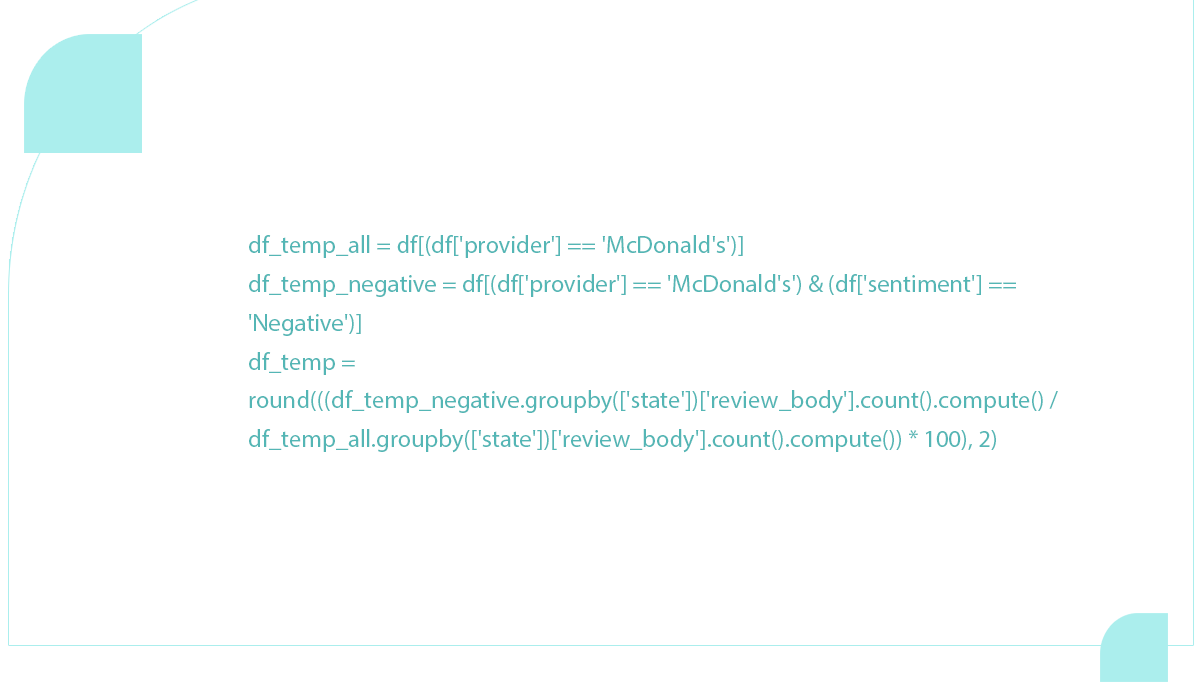
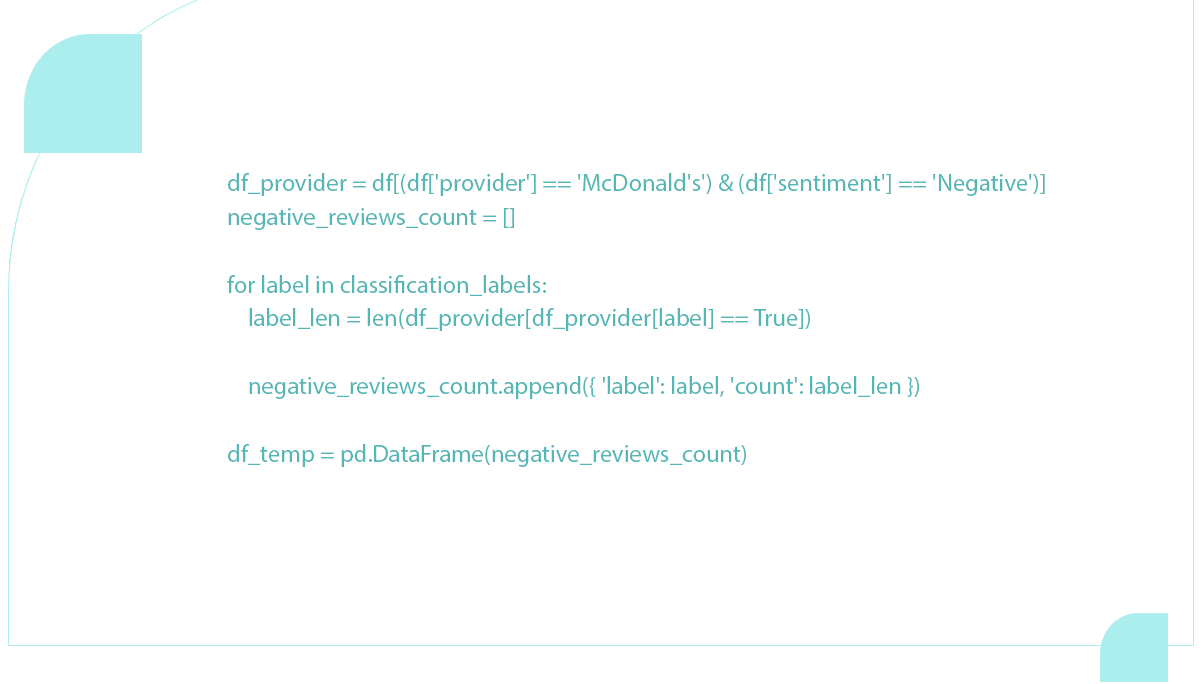
Let's delve into the factors contributing to the abundance of negative reviews for McDonald's. A straightforward approach to visualizing this data is mapping the percentages of unfavorable reviews.
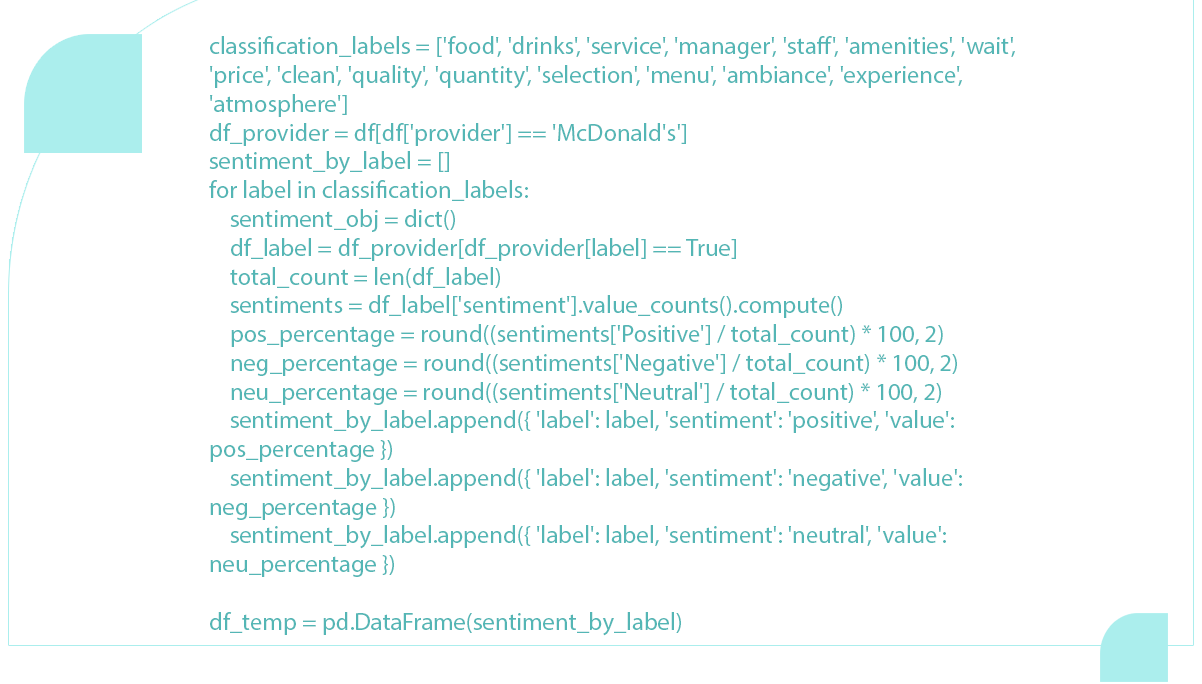
Our next step involves categorizing the reviews according to the nature of the complaints. Analyzing the percentages, we aim to distinguish between negative, positive, and neutral sentiments within these reviews.
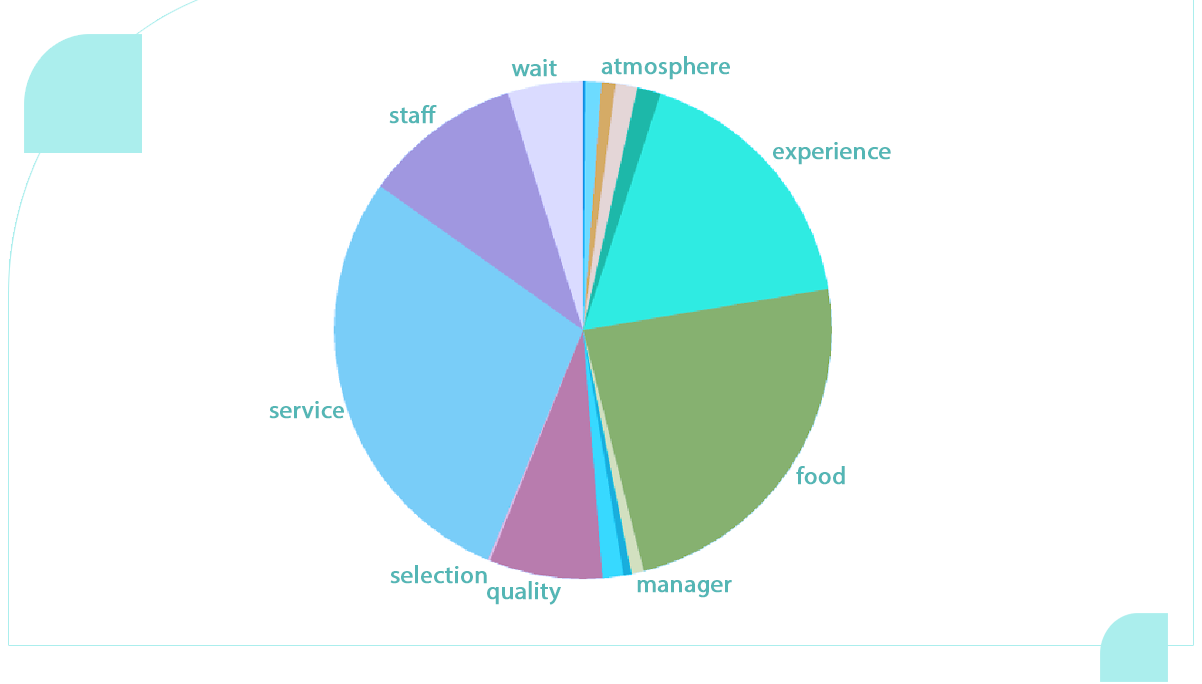
Having categorized the reviews through zero-shot classification into aspects such as Atmosphere, Experience, Service, Staff, Waiting, and more, it's evident that Atmosphere, Experience, Service, and Staff are prone to high percentages of negative reviews. Notably, concerns about Waiting and Service have been recurrent in the feedback. A pie chart highlights the aspects from which most negative reviews emanate to represent this visually.
In this analysis, we delve into the key factors contributing to the success of Chick-fil-A and Starbucks, which boast significantly higher ratings than McDonald's. We will replicate the earlier calculations to unveil the secrets behind the achievements of these two renowned fast-food giants.
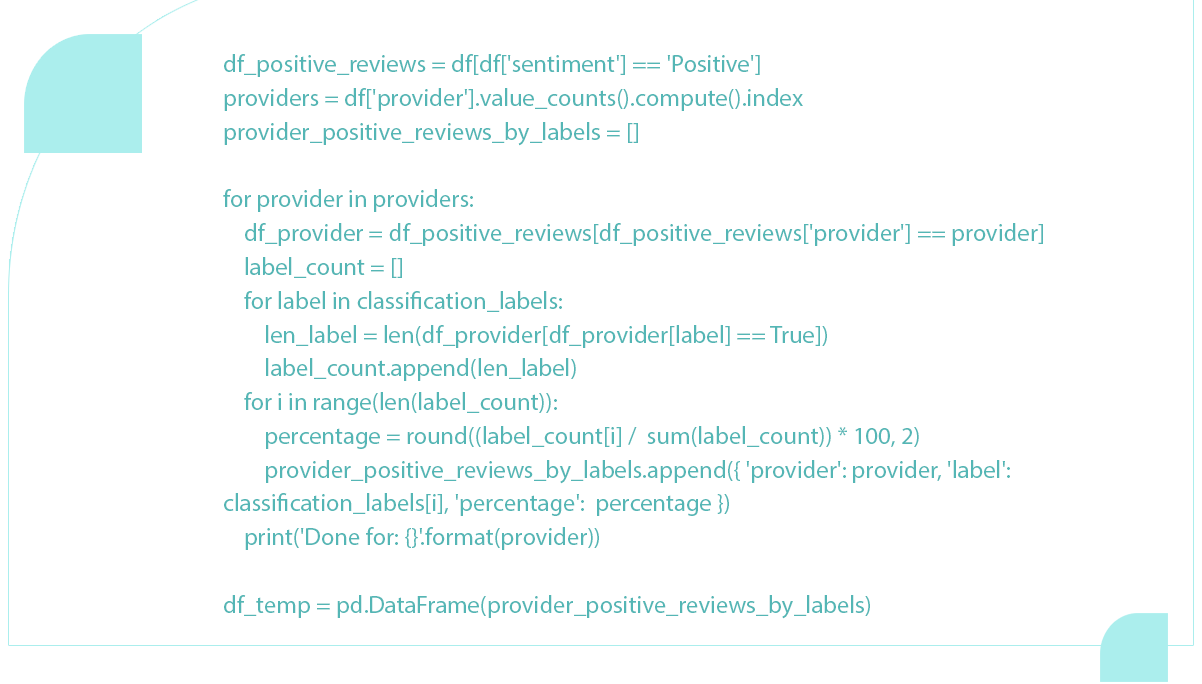
While negative reviews have received ample attention, it's time to shift the focus to the positive side. In this exploration, we aim to identify the key aspects that resonate most with customers in fast-food chains. By analyzing all positive reviews, we'll uncover the elements that make each fast-food chain stand out in the eyes of satisfied customers.
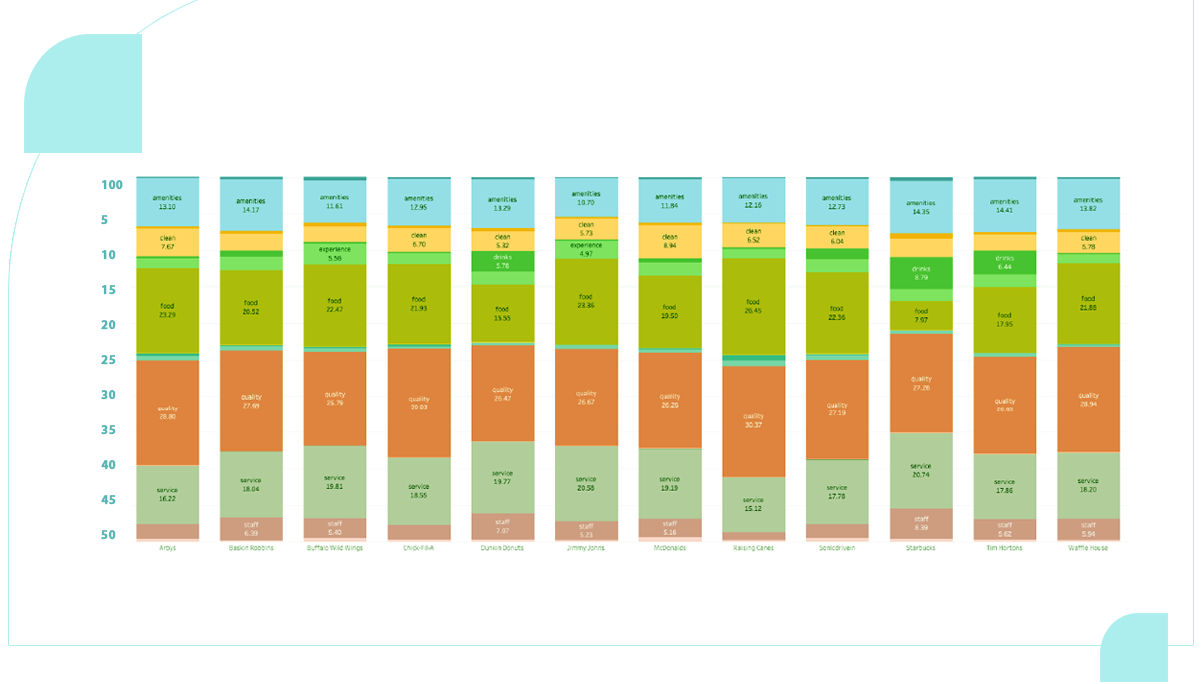
Regarding positive reviews, Dunkin' Donuts and Starbucks emerge as standouts, particularly in staff appreciation. Notably, Jimmy John's and Starbucks excel in service, surpassing the average.
For Raising Cane's, the spotlight is on commendations for its food, showcasing a solid positive trend. On the other hand, Dunkin' Donuts, Starbucks, and Tim Hortons receive notable acclaim for their beverage offerings. This analysis sheds light on the unique strengths that set these fast-food chains apart in the eyes of satisfied customers.
Conclusion: Modern machine learning and analysis techniques empower us to delve into the intricacies of review texts, offering a profound understanding of the factors that elevate a fast-food restaurant's standing. The crucial elements include delivering a superb experience with satisfactory amenities, exemplary service, and tolerable wait times.
Nevertheless, amidst these considerations, consumers remain unequivocal about one aspect – food quality. Restaurants that prioritize and uphold food quality are in the eyes of discerning customers. It underscores the paramount importance of culinary excellence in the fast-food industry.
For in-depth insights, feel free to reach out to Food Data Scrape. Our services encompass Food Data Aggregation and Mobile Restaurant App Scraping, providing extensive data analytics to enhance your decision-making and elevate your business strategies. Get in touch today to unlock a path to success driven by data!

