
The food delivery ecosystem across Southeast Asia is evolving rapidly as restaurants, food aggregators, and QSR brands increasingly rely on data-driven pricing intelligence to understand consumer spending behavior and regional affordability trends. This report highlights how the ShopeeFood Price Index 2026 enables businesses to compare the same dish pricing across Vietnam, Indonesia, Thailand, and Malaysia while monitoring menu price variations, platform discounts, delivery economics, and changing purchasing behaviors. By integrating real-time food delivery analytics, structured pricing datasets, and automated market intelligence, companies can benchmark regional pricing strategies, identify cost disparities, and analyze competitive positioning across multiple countries. The report also explores how platform commissions, promotional offers, local purchasing power, inflation, and operational costs influence food pricing in each market. In addition, it demonstrates the strategic importance of cross-country dish price benchmarking to optimize menu pricing, improve profitability, monitor regional demand shifts, and enhance pricing consistency across international food delivery operations. Overall, the report showcases how food delivery pricing intelligence is becoming essential for smarter decision-making and long-term market competitiveness in Southeast Asia.
ShopeeFood menu pricing varies significantly across Vietnam, Indonesia, Thailand, and Malaysia due to regional purchasing power, operational expenses, platform commissions, and localized pricing strategies.
The same dish often shows price differences across countries because of delivery fees, promotional campaigns, taxes, restaurant competition, and market-specific discounting strategies.
Real-time ShopeeFood Price Index tracking helps restaurants, cloud kitchens, FMCG brands, and delivery platforms benchmark pricing and monitor regional affordability patterns.
Consumer purchasing behavior continues to shift toward affordability-driven meal selections, discount-led ordering, combo meals, and localized promotional campaigns across Southeast Asian food delivery platforms.
The ShopeeFood Price Index 2026 is a cross-country pricing study that tracks how the same dish is priced across the four Southeast Asian markets where ShopeeFood operates with meaningful scale: Vietnam, Indonesia, Thailand, and Malaysia. By selecting a basket of standardized dishes — ones that appear on ShopeeFood in every country — and observing their listed prices across thousands of merchants and dozens of city anchors, the study reveals a structural pattern that no aggregated market report can convey: the same dish can cost nearly twice as much in one country than in another, and the gap reflects deep economic fundamentals, not coincidence.
This report walks through the methodology behind the ShopeeFood Price Index 2026, the dishes selected for cross-country comparison, observed price ranges in both local currency and USD-equivalent, the structural drivers explaining the gaps, and the commercial implications for restaurant brands, franchise operators, FMCG suppliers, cloud kitchen platforms, and investors operating in Southeast Asian food and beverage.
The work is delivered by Food Data Scrape, an infrastructure provider specializing in clean, harmonized food delivery data at regional scale. The Index is refreshed quarterly; the values shown here reflect 2026 Q4 capture across more than 40,000 merchants region-wide.
ShopeeFood occupies a distinct position in Southeast Asian food delivery. As the food vertical of Shopee — itself part of Sea Limited — the platform integrates tightly with the broader Shopee marketplace, ShopeePay wallet, and Shopee rewards ecosystem. This integration gives ShopeeFood a different shopper profile, promotional architecture, and competitive dynamic from GrabFood, foodpanda, or Gojek's GoFood. For brands operating across the region, ShopeeFood pricing data is essential because it reveals a slice of the market that other platforms do not.
A robust ShopeeFood Price Index 2026 unlocks several decisions that single-country or single-platform data cannot answer.
Pricing strategy across markets: When a regional brand prices a signature dish at MYR 18 in Kuala Lumpur but the equivalent dish in Hanoi lists at the USD equivalent of $2.40, the brand needs to decide whether the gap is intentional or accidental. The Index makes the gap visible.
Cross-platform sanity checks: ShopeeFood and GrabFood often coexist in the same city, sometimes with the same merchant operating on both. Comparing ShopeeFood Index data with GrabFood equivalents reveals where ShopeeFood-specific pricing dynamics emerge.
Market entry planning: For brands considering ShopeeFood entry in a specific country, knowing the price-band for comparable dishes is foundational. The Index provides realistic pricing benchmarks for menu design before the first virtual or physical store opens.
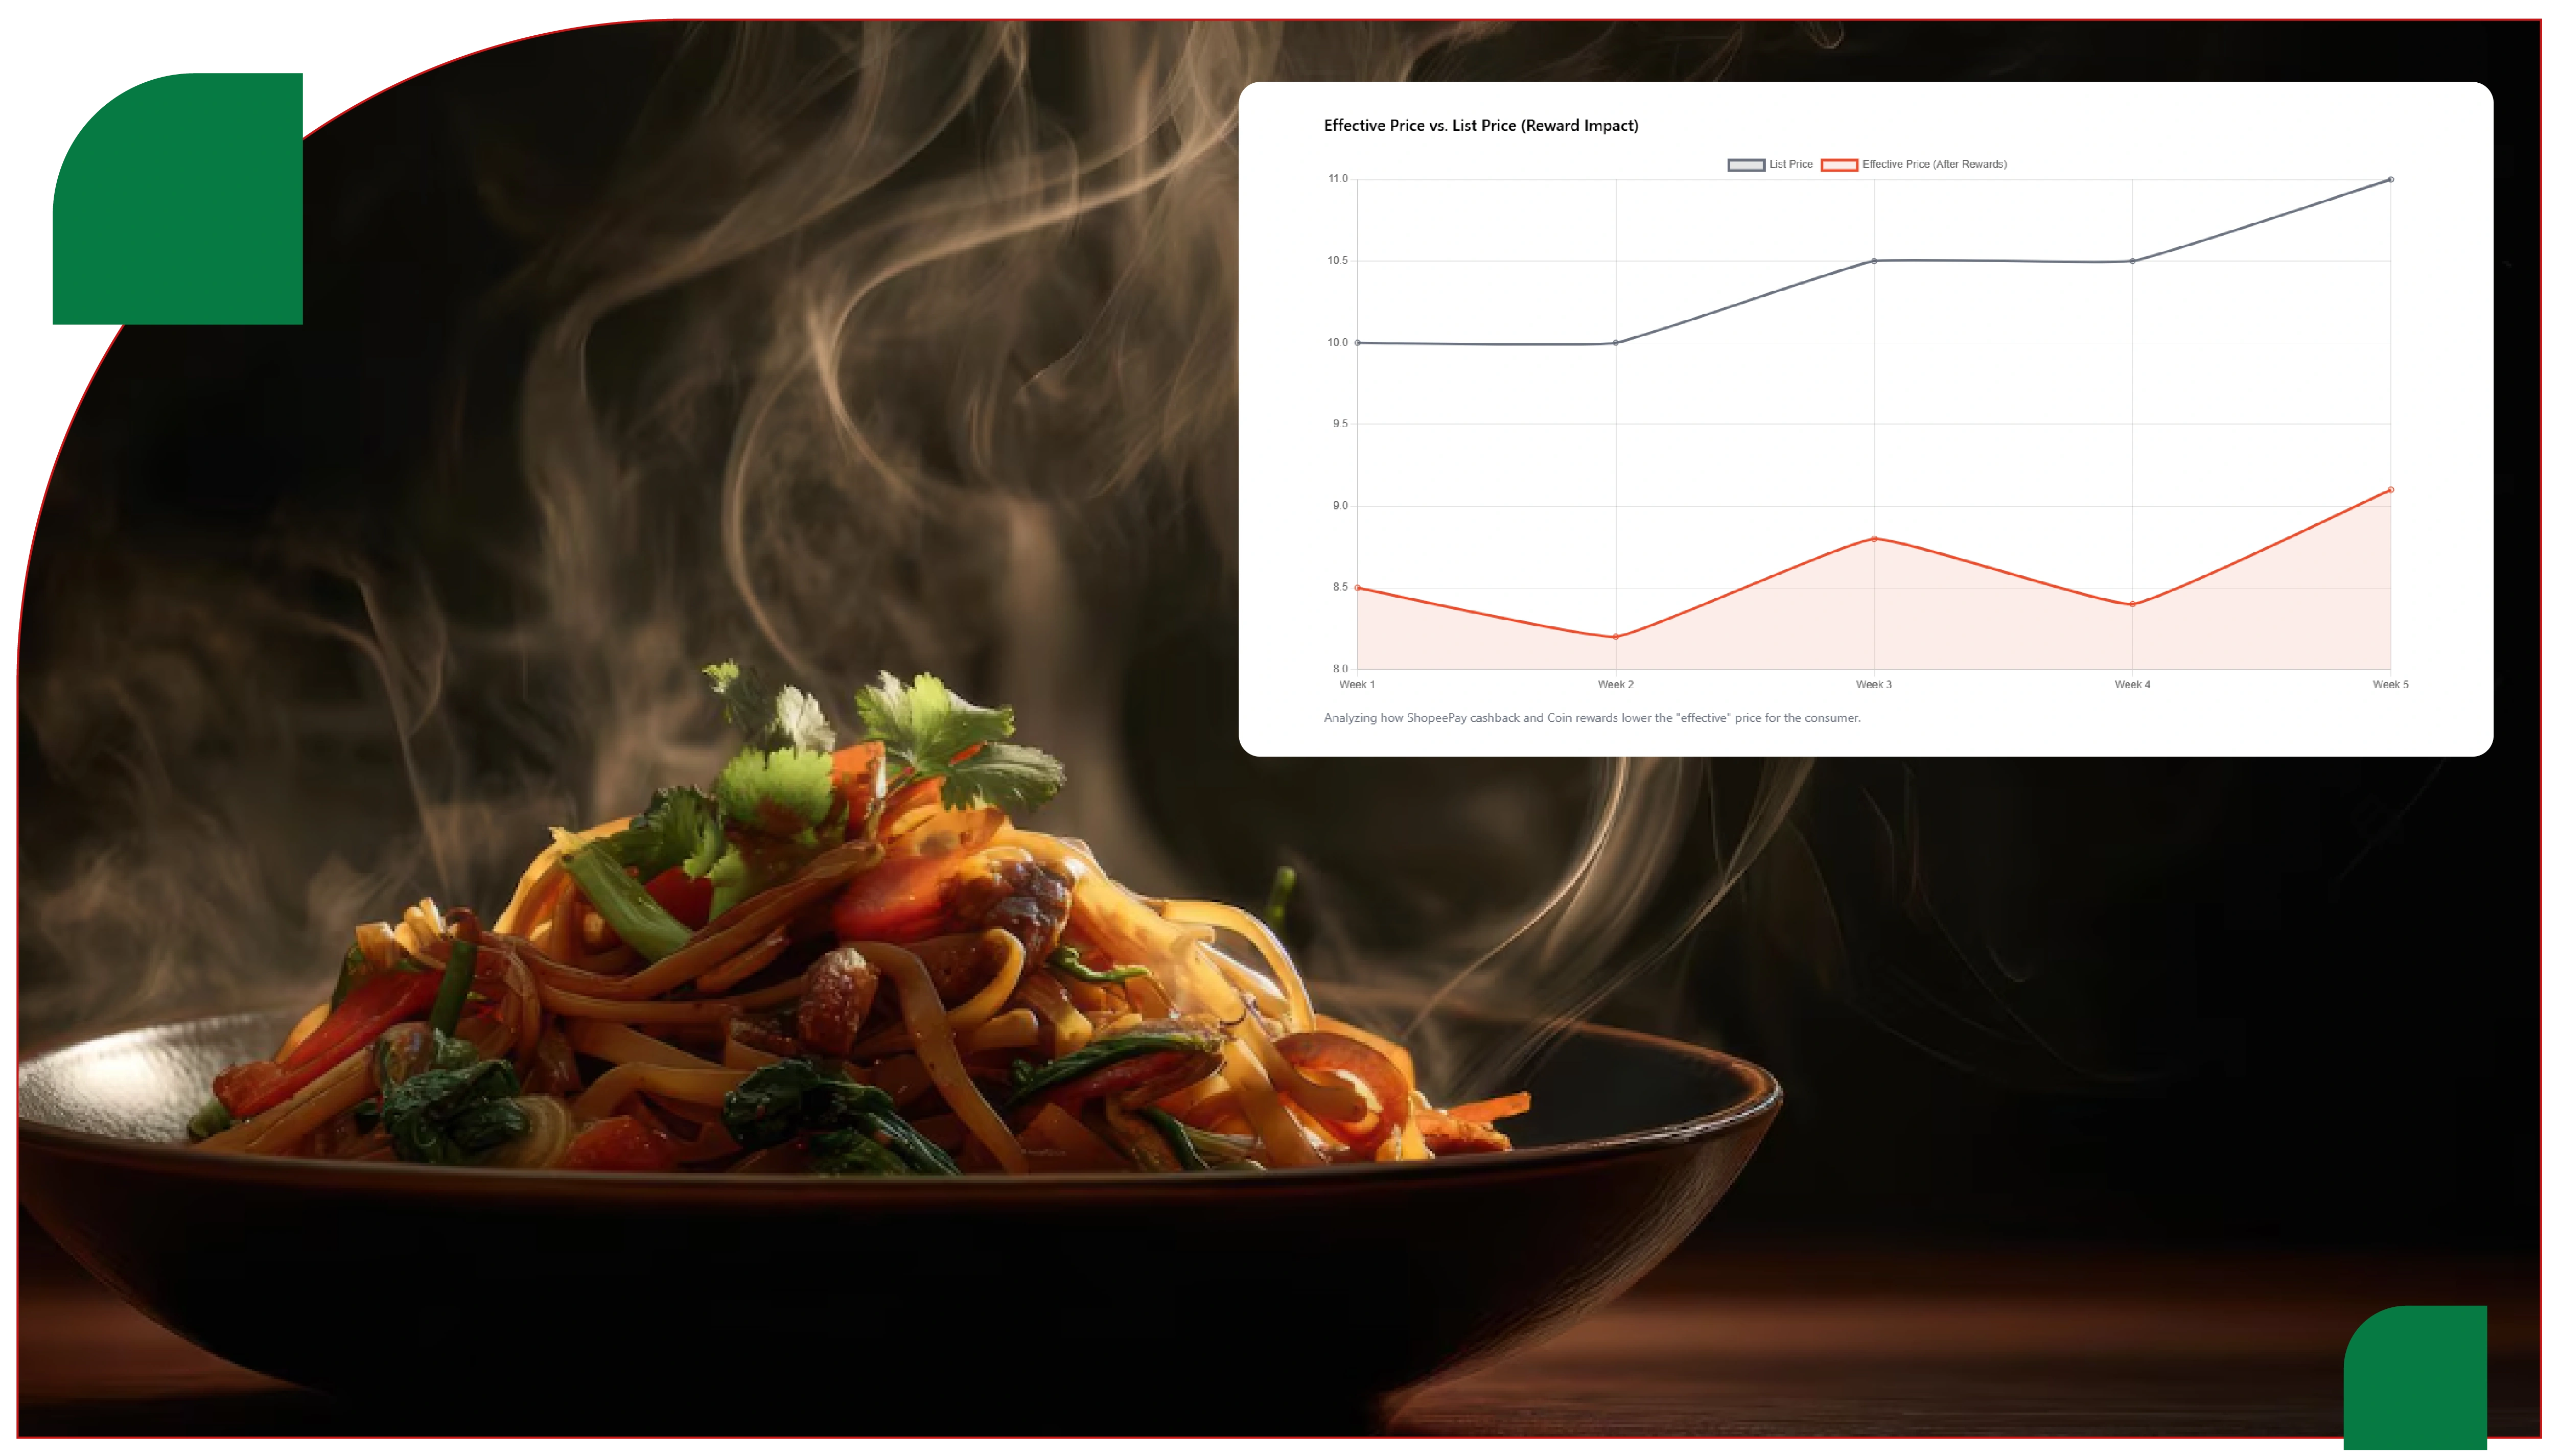
Promotional architecture analysis: ShopeeFood's Shopee-linked vouchers, ShopeePay cashback, and Coin rewards create a different effective-price layer compared with platforms that rely purely on merchant-funded discounts. The Index documents how this affects listed versus realized prices.
Investor due diligence: Investors evaluating Southeast Asian restaurant groups or cloud kitchen operators benefit from hard cross-country data validating revenue-per-order assumptions across ShopeeFood, GrabFood, and other platforms.
The ShopeeFood Price Index 2026 rests on a sampling and harmonization methodology that delivers cross-country comparability while respecting each country's culinary identity.
Dish selection: Six dishes were chosen, each meeting three criteria: meaningful availability on ShopeeFood across all four countries, recognizable consumer profile, and clear definitional boundaries that survive cross-country translation. The selected dishes are Fried Rice with Chicken (standardized portion), Beef Burger Combo Set (mid-tier chain comparable), Pizza Regular Margherita (12-inch equivalent), Iced Milk Tea (large cup), Fried Chicken (2-piece combo), and Vermicelli or Noodle Soup with Beef (standardized portion).
Merchant sampling: Within each country, dishes were sampled across the highest-velocity 500 merchants per dish per metropolitan area. City anchors include Ho Chi Minh City, Hanoi, and Da Nang in Vietnam; Jakarta, Surabaya, and Bandung in Indonesia; Bangkok and Chiang Mai in Thailand; and Kuala Lumpur, Penang, and Johor Bahru in Malaysia.
Currency normalization: Listed prices were captured in local currency (VND, IDR, THB, MYR) and converted to USD using period-average exchange rates. Both currencies are reported in the tables below.
Tax handling: Each country handles VAT or service charges differently. The Index reports tax-inclusive consumer-facing prices, matching what shoppers actually see and pay at checkout.
Outlier filtering: The top and bottom 5 percent of listings by price were excluded to remove anomalies. The remaining 90 percent forms the comparable base.
Refresh cadence: The Index is refreshed quarterly. Within each quarter, top-velocity merchants are captured daily, while long-tail merchants are captured weekly. 2026 Q4 data is presented in this report.
Quality assurance: Every captured record passes schema validation, brand-name disambiguation, dish reclassification, currency normalization, and outlier detection before entering the Index.
The following sample tables represent the core of the 2026 Q4 Index. All prices are tax-inclusive, reflecting what consumers pay at checkout.
| Dish | Vietnam | Indonesia | Thailand | Malaysia |
|---|---|---|---|---|
| Fried Rice w/ Chicken | $2.45 | $2.25 | $2.70 | $3.20 |
| Beef Burger Combo | $4.70 | $4.40 | $4.95 | $5.95 |
| Pizza Margherita 12" | $6.95 | $6.50 | $7.80 | $8.95 |
| Iced Milk Tea (L) | $2.10 | $1.95 | $2.40 | $2.80 |
| Fried Chicken 2-pc | $3.30 | $3.05 | $3.65 | $4.40 |
| Beef Noodle Soup | $2.55 | $2.30 | $2.95 | $3.40 |
| Dish | VND (VN) | IDR (ID) | THB (TH) | MYR (MY) |
|---|---|---|---|---|
| Fried Rice w/ Chicken | 62,500 | 37,000 | 93.00 | 14.50 |
| Beef Burger Combo | 119,000 | 72,000 | 170.00 | 26.90 |
| Pizza Margherita 12" | 176,500 | 107,000 | 268.00 | 40.50 |
| Iced Milk Tea (L) | 53,500 | 32,000 | 82.00 | 12.70 |
| Fried Chicken 2-pc | 84,000 | 50,000 | 125.00 | 19.90 |
| Beef Noodle Soup | 65,000 | 37,500 | 100.00 | 15.40 |
| Dish | Highest | Lowest | Ratio (High/Low) |
|---|---|---|---|
| Fried Rice w/ Chicken | Malaysia ($3.20) | Indonesia ($2.25) | 1.42x |
| Beef Burger Combo | Malaysia ($5.95) | Indonesia ($4.40) | 1.35x |
| Pizza Margherita 12" | Malaysia ($8.95) | Indonesia ($6.50) | 1.38x |
| Iced Milk Tea (L) | Malaysia ($2.80) | Indonesia ($1.95) | 1.44x |
| Fried Chicken 2-pc | Malaysia ($4.40) | Indonesia ($3.05) | 1.44x |
| Beef Noodle Soup | Malaysia ($3.40) | Indonesia ($2.30) | 1.48x |
| Country | Capital City | Secondary City Avg |
|---|---|---|
| Vietnam | $2.55 (HCMC) | $2.30 (Hanoi/Da Nang avg) |
| Indonesia | $2.40 (Jakarta) | $2.05 (Surabaya/Bandung avg) |
| Thailand | $2.85 (Bangkok) | $2.40 (Chiang Mai) |
| Malaysia | $3.30 (KL) | $2.95 (Penang/JB avg) |
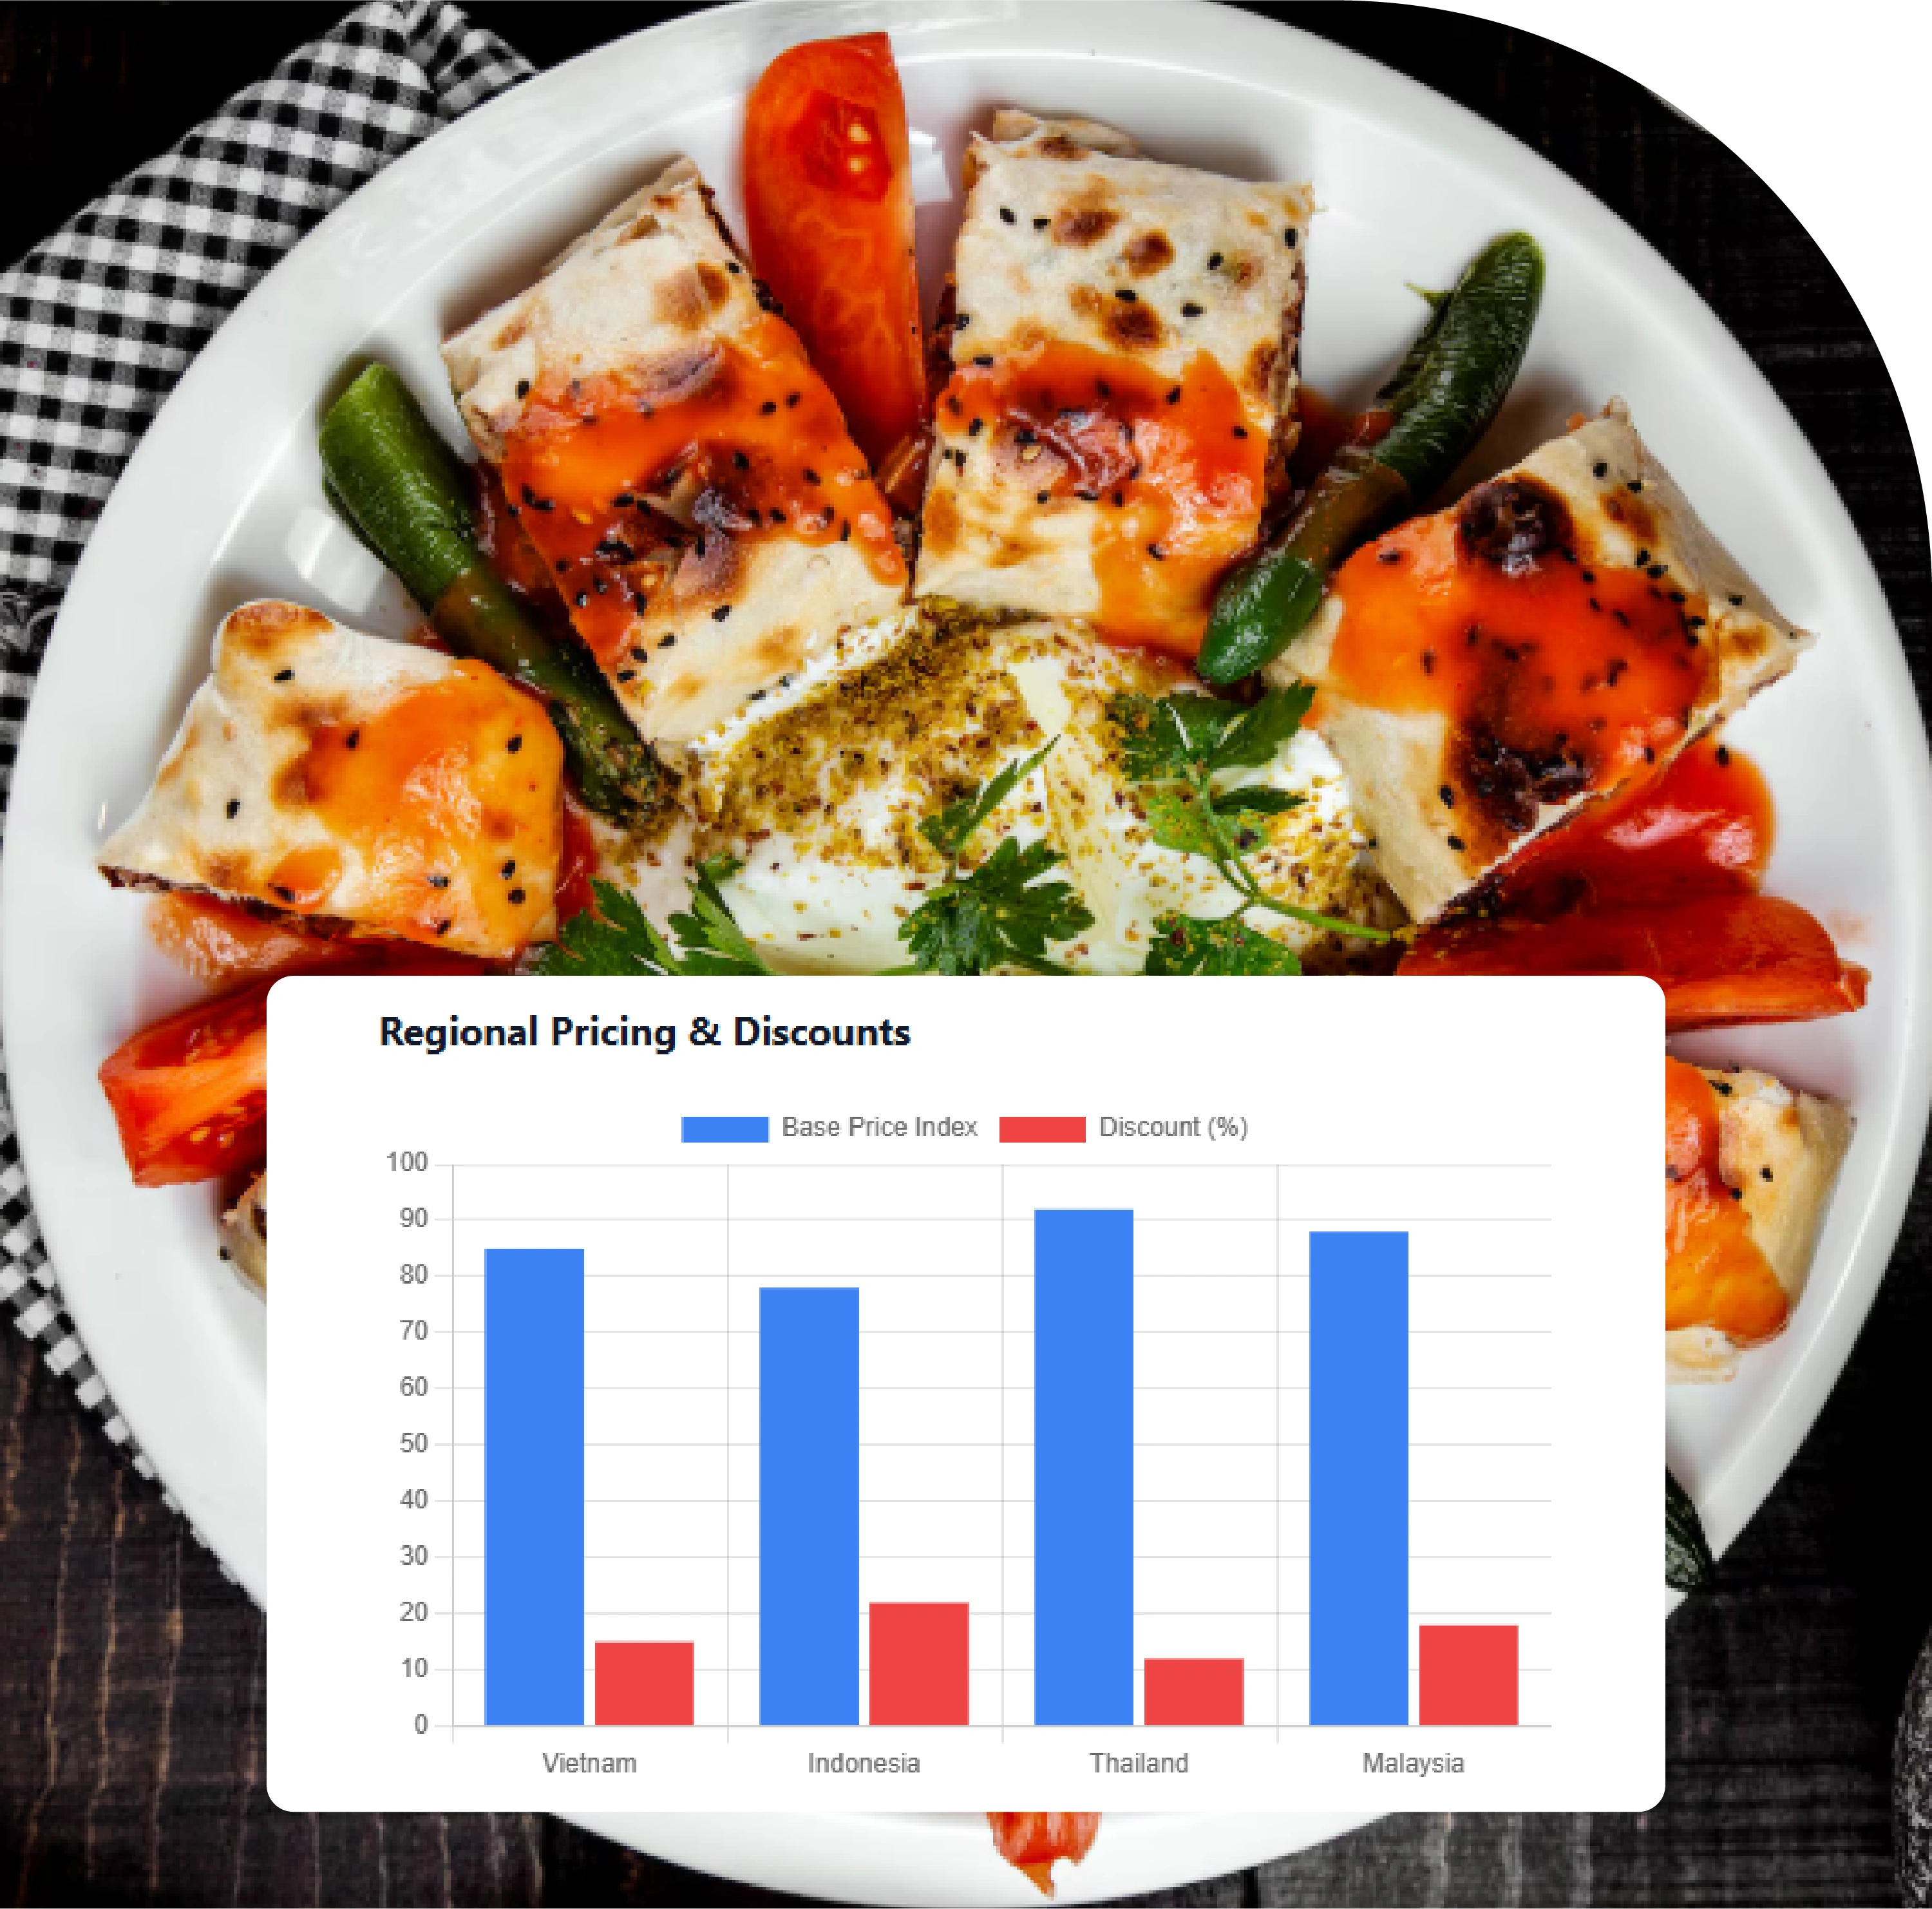
| Country | Share with Active Promo | Avg Promo Discount |
|---|---|---|
| Vietnam | 42% | 19% |
| Indonesia | 51% | 23% |
| Thailand | 36% | 18% |
| Malaysia | 33% | 16% |
These samples represent a small slice of the millions of records captured across the four markets each quarter.
The data tells a coherent story about Southeast Asian food delivery pricing on ShopeeFood. Several findings are particularly important for commercial decision-making.
Malaysia consistently anchors the top of the Index: Across all six dishes, Malaysia registers the highest listed prices in USD equivalent. This reflects Malaysia's higher GDP per capita than the other three markets in the Index, more developed delivery infrastructure with higher commission structures, and stronger urban consumer purchasing power, particularly in Kuala Lumpur and Penang.
Indonesia consistently anchors the bottom: Indonesia delivers the lowest USD-equivalent prices across every dish, reflecting an enormous tail of small warung merchants serving price-sensitive consumers, lower operating costs, and a currency that compresses local pricing in USD terms.
The cross-country gap is tighter than on regional comparisons: Across the four ShopeeFood markets, the highest-to-lowest ratio clusters around 1.35x to 1.48x — narrower than the 2.0x to 2.2x gaps seen when Singapore (significantly higher GDP per capita) is included in regional analysis. This is itself a meaningful insight: among the four ShopeeFood-active markets, economic fundamentals are closer than they would be in a Singapore-inclusive sample.
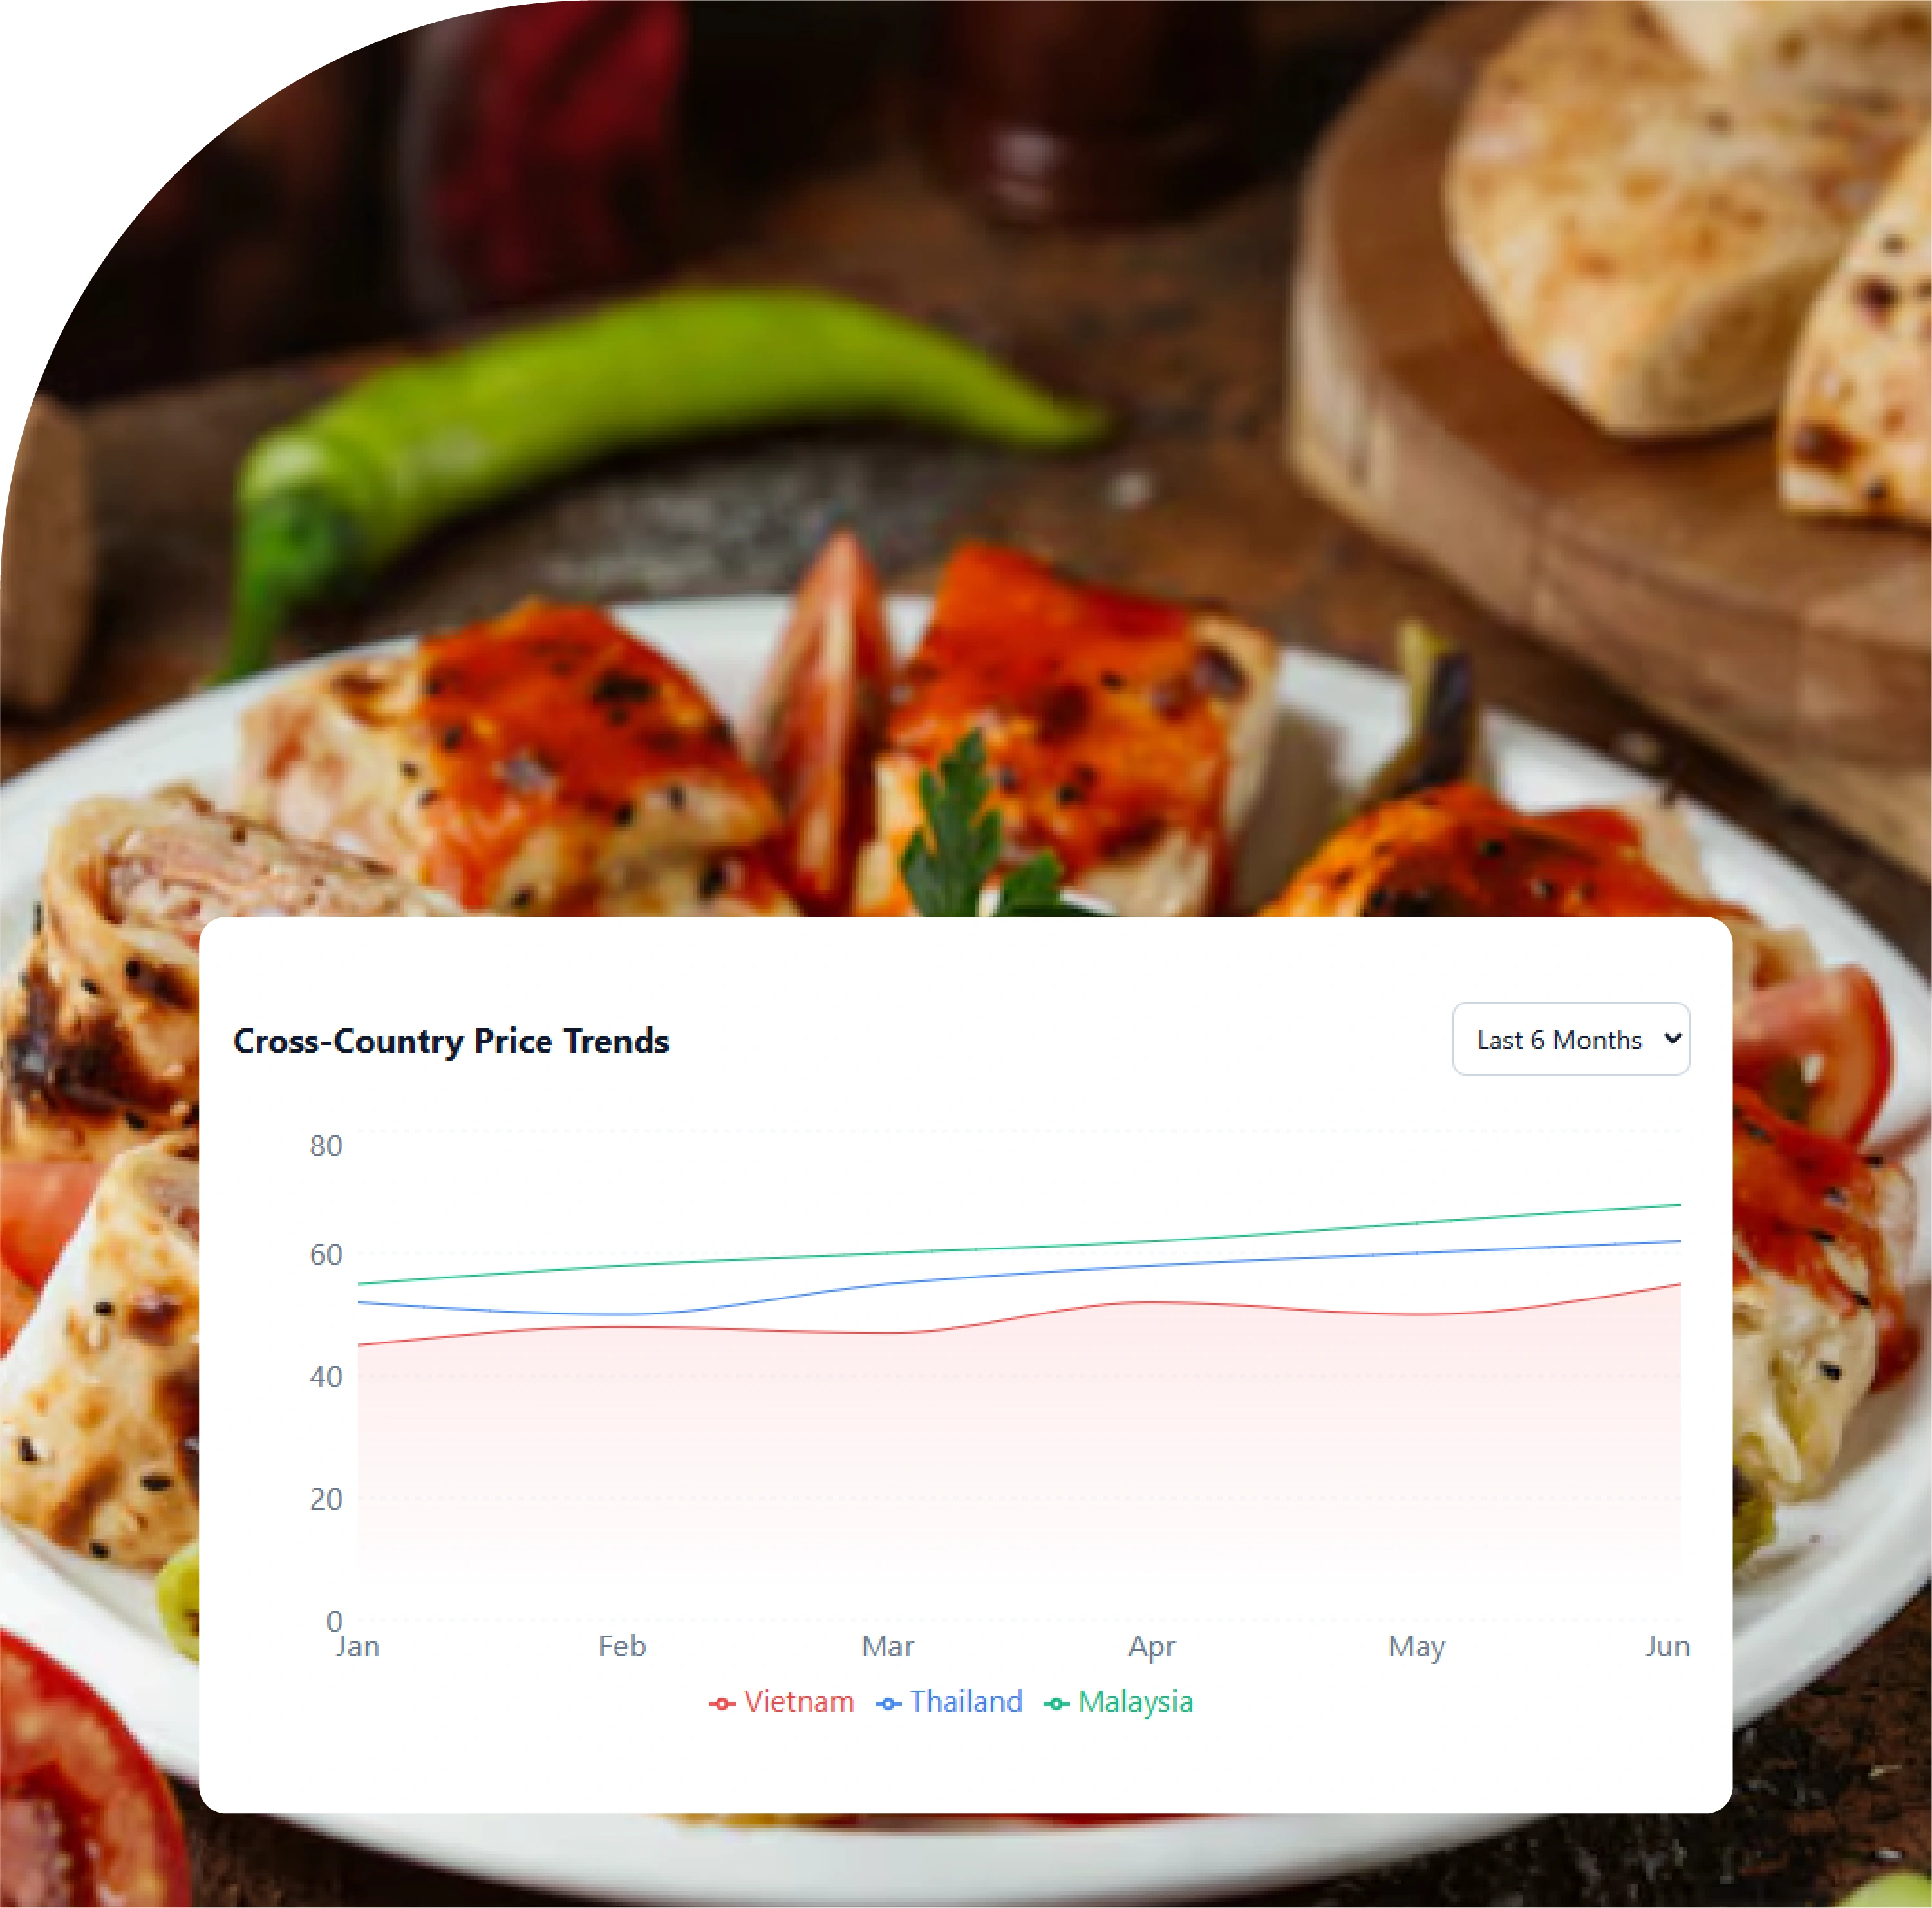
Vietnam and Thailand cluster in the middle: Despite different geographies, currencies, and culinary traditions, Vietnam and Thailand price comparably across most dishes, occupying a distinct mid-tier characterized by strong local cuisine cultures and growing-but-not-yet-saturated delivery markets.
Within-country city variation is meaningful but smaller than cross-country variation: Provincial cities consistently price 10 to 20 percent below capital cities, but the within-country gaps never exceed the cross-country gaps. This validates that the Index is measuring true economic differences, not metropolitan premium effects.
Promotional intensity rises as price level falls: Indonesia shows the highest share of merchants with active promotions at 51 percent, while Malaysia shows the lowest at 33 percent. This pattern indicates that price-sensitive markets compete more heavily on promotion, while higher-income markets compete on quality, brand, and convenience signals.
Pizza shows the widest absolute USD spread: With Malaysia listing at $8.95 and Indonesia at $6.50, pizza shows a $2.45 absolute gap — the largest in the Index. Categories with imported ingredient dependencies (cheese, processed flour, premium tomato bases) tend to amplify cross-country gaps because supply-chain costs do not compress as aggressively as labor costs.
Iced milk tea shows the widest percentage gap: Despite originating as a regional category, milk tea exhibits the largest percentage variation in the Index at 1.44x, partly reflecting that ShopeeFood's milk tea catalog skews toward branded specialty chains in Malaysia (Tealive, Chatime, KOI) versus more independent operators in Indonesia.
Several macro and micro drivers explain the Index pattern.
GDP per capita: Malaysia's GDP per capita is roughly four times higher than Indonesia's. While the dish-level price gap is only about 1.4x, the relationship between income and food spending is non-linear — consumers in lower-income markets allocate a higher share of income to food, partially compensating for lower absolute prices.
Real estate and operating costs: Restaurant rent in central Kuala Lumpur runs meaningfully higher than equivalent space in Surabaya or Bandung. Even before considering labor and ingredients, this baseline cost flows directly into menu pricing.
Labor economics: Minimum and effective wages differ substantially across the four countries, with Malaysia anchoring the higher end and Vietnam and Indonesia at lower levels. Food preparation is labor-intensive; wage gaps translate directly into pricing gaps.
Ingredient supply chain: Categories relying on imported ingredients (cheese, processed meats, premium oils, specialty sauces) show wider cross-country gaps than categories built around locally-sourced raw materials. This is why pizza and burger items show wider gaps than noodle soup and fried rice.
Platform commission structures: ShopeeFood applies different commission structures across countries. While consumer-facing prices reflect all this, merchants in higher-commission environments may price slightly higher to preserve margin.
Currency volatility: Period-to-period changes in exchange rates produce apparent price movement in USD even when local-currency pricing is stable. The 2026 Q4 snapshot reflects exchange rate conditions at the time of capture.
Consumer income elasticity: In lower-income markets, consumers tolerate less price elasticity on food delivery, which constrains how aggressively merchants can price. In higher-income markets, premium positioning is rewarded, allowing wider price differentiation.
Promotional ecosystem integration: ShopeeFood's tight integration with Shopee, ShopeePay, and Coins rewards creates a layered effective-price structure. Merchants in highly promoted markets may list at slightly elevated prices knowing platform-funded vouchers will close the gap for many shoppers.
The ShopeeFood Price Index 2026 has direct implications for several commercial functions.
For regional restaurant brands: A brand operating across ShopeeFood markets should not price the same dish identically across countries unless it has clear strategic reasons. Index data provides realistic pricing benchmarks per country to anchor menu engineering decisions.
For market entrants: A brand considering ShopeeFood entry in any of these four countries can use the Index to size the addressable price band in each target market before signing leases or appointing partners.
For franchise operators: Franchise contracts typically include pricing guidelines. The Index provides defensible benchmarks against which franchisee compliance can be measured. Where franchisees deviate meaningfully from country medians, the Index flags the variance for further investigation.
For FMCG and ingredient suppliers: Suppliers selling into Southeast Asia can use the Index to understand which categories tolerate higher ingredient costs and which compress margins, informing both pricing strategy and product portfolio decisions at country level.
For cloud kitchen platforms: Cloud kitchen operators run multiple virtual brands across delivery-native categories. Knowing the realistic price bands per dish per country helps them calibrate their virtual brand portfolios on ShopeeFood specifically.
For investors and M&A teams: Investors evaluating Southeast Asian F&B businesses can validate revenue-per-order assumptions against Index benchmarks. When a portfolio company claims an average order value that diverges sharply from the country-level Index, the divergence merits investigation.
For consumer-facing comparison apps: Apps building price-comparison or smart recommendation features can use the Index as a reference layer for what consumers should expect to pay in each country.
The 2026 Q4 snapshot captures a moment in a constantly evolving market. Several trends are likely to influence the Index in upcoming quarters.
Indonesia's premiumization curve. Indonesia continues to grow its middle-income consumer base. Cloud kitchen operators and international chains are expanding into Jakarta and secondary cities. Over the next several quarters, expect the Indonesia tier to drift upward, narrowing the gap with Vietnam and Thailand.
Vietnam's accelerating delivery penetration. Vietnam's food delivery market continues to deepen, with ShopeeFood expanding merchant breadth beyond HCMC and Hanoi. As provincial-city merchant counts grow, expect within-country variation to widen modestly before stabilizing.
Malaysia's plateau. Malaysia's ShopeeFood prices have grown more slowly than other markets in recent quarters, reflecting both consumer price sensitivity and intense competition with GrabFood. Expect the Malaysia tier to remain elevated but not to accelerate.
Thailand's evolving promotional architecture. ShopeeFood Thailand's promotional cycles have intensified through 2026. Expect realized prices (after promotion) to drift below listed prices, with the gap widening in dishes with high cross-platform overlap with GrabFood.
Sustainability and healthy-eating premium emergence. Plant-based, sustainable-sourcing, and ethical-supply-chain positioning is starting to command modest price premiums in Kuala Lumpur, Bangkok, and HCMC. The next Index update will track whether this premium becomes statistically meaningful.
Building a regional price index across four Southeast Asian countries on a specific platform is a non-trivial undertaking. It requires sustained engineering investment across multiple languages, careful dish definition and harmonization, currency-period management, ethical and compliant collection at scale, and analyst expertise to translate raw data into commercial insight. Most internal teams lack the resources to do this at the necessary depth and refresh cadence.
We bring managed infrastructure, ethical and compliant data collection practices, and deep domain expertise in Southeast Asian food and beverage. Advantages include compliance-first architecture, scalable extraction across millions of public pages daily, harmonized dish and cuisine taxonomies, near-real-time refresh on priority merchants, currency and tax-normalized output, dedicated analyst support familiar with each country's market dynamics, and out-of-the-box dashboards highlighting cross-country and within-country patterns. The team has supported regional restaurant chains, cloud kitchen operators, FMCG suppliers, investors, and research consultancies — bringing the practical experience of how scraped data drives real commercial outcomes.
The ShopeeFood Price Index 2026 confirms what experienced regional operators have suspected: even within the four ShopeeFood-active markets, structural pricing differences of roughly 1.4x exist between the highest and lowest countries. These gaps are not random — they reflect economic fundamentals, supply chain realities, and consumer dynamics that persist across categories. Brands, distributors, suppliers, and investors who recognize this structural pattern and price accordingly will outperform those who treat the region as a single market.
The Index also surfaces a second-order insight that experienced regional operators quietly recognize: cross-platform pricing dynamics matter as much as cross-country dynamics. The same merchant operating on both ShopeeFood and GrabFood often prices differently across the two platforms, reflecting different commission structures, different shopper demographics, and different promotional ecosystems. A serious commercial decision in Southeast Asian food and beverage benefits from a multi-platform view, not just a multi-country one. As ShopeeFood continues to deepen its merchant base and expand its promotional architecture, expect this cross-platform divergence to widen, creating both opportunity (for brands that price intentionally) and risk (for brands that allow pricing to drift unmanaged).
The Index will continue to be refreshed quarterly, with future editions adding new dishes, expanding city coverage, tracking how cross-country gaps evolve over time, and where relevant, adding ShopeeFood-versus-GrabFood comparison layers within the same metropolitan areas. The brands and investors who succeed in Southeast Asian food and beverage in the years ahead will be those who build their strategy on structured, refreshed, cross-country and cross-platform data rather than country-by-country anecdote.
If you are ready to act on real Southeast Asian pricing intelligence instead of generalizations, get in touch with our team today.

