Introduction
December and January are the two most price-active months in grocery. December brings holiday demand spikes, promo-heavy weekly ads, and rapid stock movement. January follows with reset pricing, post-holiday clearance, and aggressive promotions to win back routine shoppers. If you are a retailer, brand, distributor, marketplace seller, or analytics team, this is the season where price intelligence becomes less “nice to have” and more “you either track it daily or you miss it.”
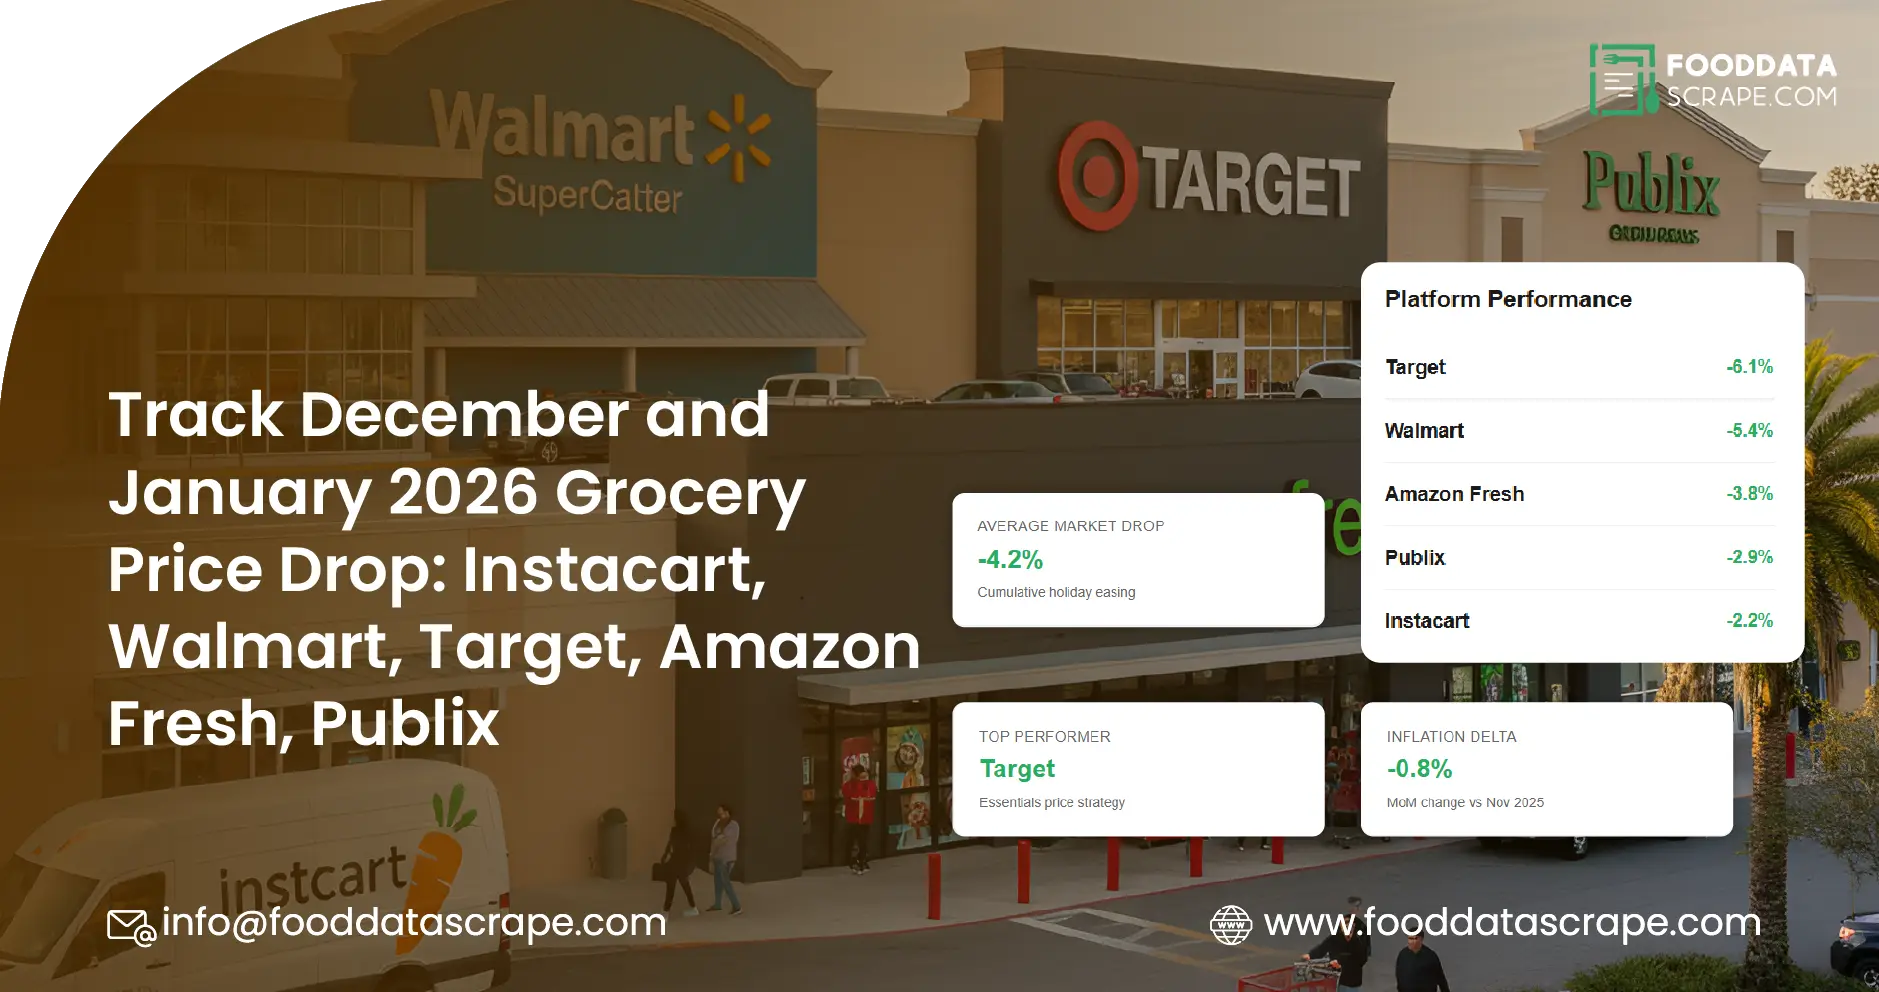
That’s exactly where Food Data Scrape helps. We collect and structure grocery pricing signals across Instacart, Walmart, Target, Amazon Fresh, and Publix so you can track price drops, discounts, promo types, and availability changes across key categories. Instead of manually checking products or relying on inconsistent screenshots, you get clean, analysis-ready data and alerts that show what changed, when it changed, and where it changed.
This blog explains how to track grocery price drops during December and January 2026, what data fields matter, how to build a monitoring workflow, and what sample outputs can look like.
Why December and January Price Drop Tracking Matters
Promo velocity is highest
In December, prices can shift multiple times per week due to:
- Holiday promotions (BOGO, “buy more save more”, bundle offers)
- Seasonal category pushes (baking, snacks, beverages, frozen foods)
- Short-lived app-only discounts (especially on Instacart)
In January, pricing shifts again due to:
- Post-holiday markdowns
- New-year health promotions (protein, produce, zero sugar, low carb)
- Category resets and supplier-funded promos
Tracking only “current price” is not enough. You need price history + promo context to understand real drops versus temporary discounting.
Competitive matching happens fast
If Walmart drops the price of a high-velocity SKU, other channels react. If Target runs a multi-buy promo, Instacart baskets change. Without monitoring, you see changes after the market already moved.
Availability changes can hide real price signals
A price drop often coincides with:
- Out-of-stock events
- Substitution behavior (Instacart)
- Delivery window restrictions (Amazon Fresh)
- Store-level inventory differences (Publix)
A robust tracker captures price + stock + fulfillment context together.
Platforms Covered and What Makes Each One Different
Instacart price tracking
Instacart is a critical layer because pricing is tied to:
- Store selection
- Delivery/pickup mode
- Local geography and demand
- Sometimes an in-app price vs in-store price note
To track price drops on Instacart correctly, you must capture:
- Retailer/store name
- Location (city/ZIP or store ID)
- Regular price and promo price
- Promo badge or promo type (if visible)
- Size/pack details (to compare correctly)
- Availability and substitution flags
Walmart grocery price monitoring
Walmart is often the baseline for competitive grocery pricing. Key aspects include:
- Rollbacks, clearance, and “deal” labels
- Price changes at SKU level
- Pickup vs delivery context (sometimes differs)
- Variations by store/region
Target grocery price intelligence
Target’s promotions often show as:
- Circle offers (Target Circle)
- Multi-buy promotions
- Category seasonal promotions and weekly ad cycles
A strong system should capture:
- Offer type and conditions
- Promo start/end signals (when visible)
- Regular vs discounted pricing
Amazon Fresh pricing and availability tracking
Amazon Fresh adds complexity due to:
- Delivery window constraints
- Brand substitutions
- Fresh produce weight-based pricing
- Frequent availability and assortment changes
So you track:
- Unit price and weighted price basis
- Availability and delivery slot flags
- Pack/size normalization
Publix grocery price drop monitoring
Publix is known for promo mechanics like:
- BOGO
- Weekly ad cycles
- Price changes aligned with local store promos
Monitoring must include:
- Store-level context (where applicable)
- Promo labels (BOGO/multi-buy)
- Timing of weekly ad refreshes
What to Track: The “Must-Have” Data Fields for Price Drop Detection
A solid grocery price drop tracker needs a consistent schema across platforms. At minimum:
Core product identifiers
- Product name (cleaned)
- Brand
- Category and subcategory
- Size/weight and unit of measure
- UPC/EAN where available (or internal ID)
- Platform SKU / product ID
- Product URL
Price fields
- List price (regular price)
- Current selling price
- Promo price (if separate)
- Per-unit price (price per oz/lb/each)
- Currency
Promotion and deal fields
- Promo type (rollback, clearance, BOGO, multi-buy, coupon, membership offer)
- Promo text / badge
- Promo condition (e.g., “2 for $6”)
- Promo start/end when visible (or inferred from change history)
Availability and fulfillment
- In-stock / out-of-stock
- Delivery vs pickup availability
- Store/fulfillment location context (store ID, ZIP, city)
- Substitution allowed (where relevant)
Time and tracking fields
- Timestamp (UTC + local)
- Crawl run ID / batch ID
- Data confidence flags (optional)
These fields let you separate a true price drop from a packaging mismatch or location issue.
How Food Data Scrape Tracks December–January Price Drops
Here is a practical workflow that many teams use.
Step 1: Choose your basket (SKU set)
You can track:
- Your own brand SKUs
- Key competitor SKUs
- Category leaders (top 50–500 products per category)
- Promo-sensitive SKUs (snacks, beverages, frozen foods)
- Price-locked essentials (milk, eggs, bread, rice)
In December–January, we often recommend a split:
- 60% core basket (always-on essentials)
- 40% seasonal/volatile basket (holiday + January reset items)
Step 2: Set locations and stores
Price drops vary widely by geography. A good monitoring plan includes:
- 5–15 high-demand metros (for national view)
- A few “control” locations (stable pricing zones)
- Store-level variation where the platform supports it
Step 3: Define your drop rules (what counts as a “drop”)
Examples:
- Absolute drop: price reduced by at least $0.50
- Percentage drop: at least 10% decrease
- Unit price drop: at least 8% per-unit decrease
- Promo activation: regular → promo price, even if small
- Clearance detection: presence of “clearance” label
Step 4: Run daily or twice-daily captures
During December and early January, daily is the minimum. For high volatility categories, twice daily can be valuable.
Step 5: Alerting + dashboards
Food Data Scrape outputs can power:
- Slack/email alerts for drops
- Weekly “top movers” reports
- Price gap dashboards (you vs competitors)
- Promo calendar overlays (what changed on what day)
Use Cases: Who Benefits From Dec–Jan Grocery Price Drop Monitoring
CPG brands and category managers
- Detect competitor discounting early
- Track promo impact on price positioning
- Identify retailers that are undercutting MAP or agreed pricing
Retail and eCommerce teams
- Monitor price competitiveness across channels
- Identify high-impact items to match or protect margin
- Compare platform price consistency (Walmart vs Instacart vs Amazon Fresh)
Revenue and performance marketing teams
- Align campaigns with real-time price drops
- Improve ROAS by promoting SKUs when prices are most attractive
- Reduce wasted spend when SKUs are out-of-stock
Data science and analytics teams
- Build demand models with price elasticity signals
- Create promo impact attribution
- Forecast category price index changes for Q1 planning
Best Practices for Accurate Price Drop Tracking
Normalize pack sizes
A “price drop” is meaningless if you compared:
- 12 oz vs 16 oz
- 6-pack vs 12-pack
- single item vs multipack
Always normalize using:
- size
- unit price
- pack count
Capture unit price wherever possible :
Unit price is the fairest cross-platform comparison because absolute pricing can vary due to pack variations.
Separate “promo price” from “regular price” :
Some platforms show both. If you only keep one field, your history becomes confusing when promos end.
Track out-of-stock and substitutions :
A drop might happen at the same time an item becomes scarce. That changes the business meaning of the drop.
Store and location context is non-negotiable :
Two different ZIP codes can show different prices on the same day. Store IDs or location labels should be part of the dataset.
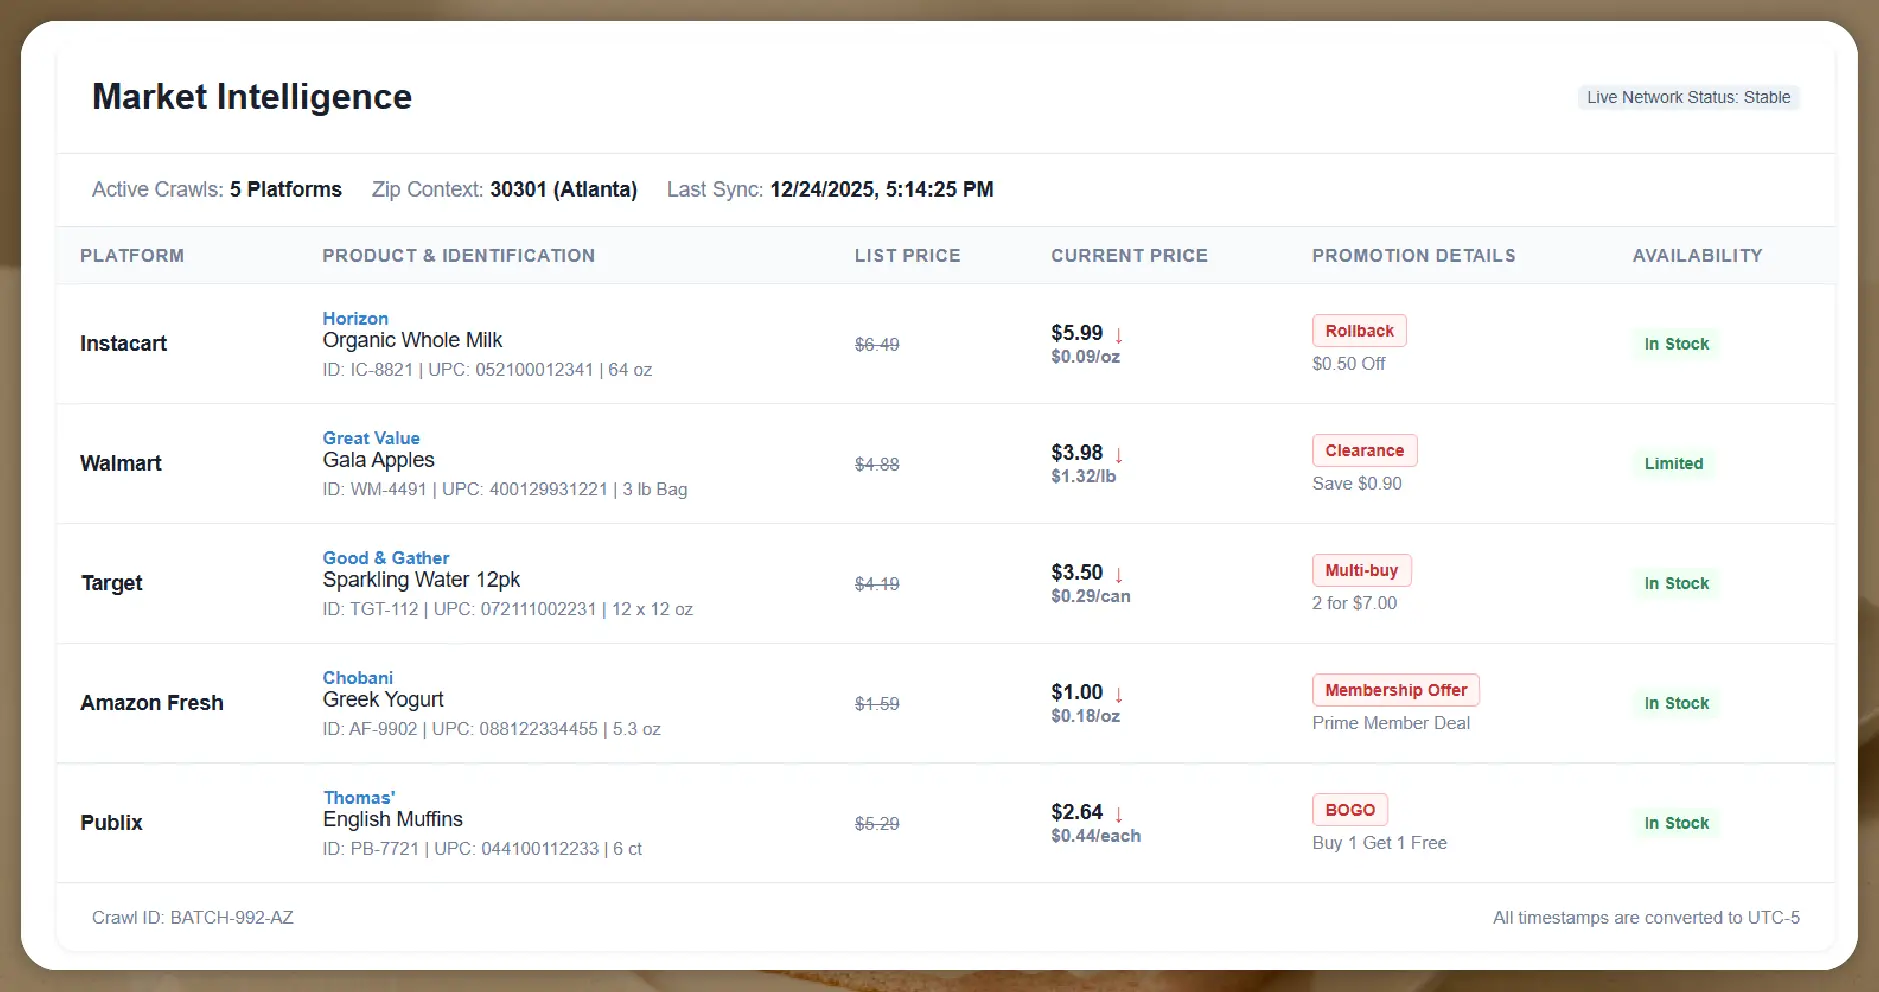
Sample Data Examples (Clean Tables)
Below are example tables that show how Food Data Scrape outputs may look. These are illustrative samples for December and January tracking.
Price Drop Event Log (Cross-Platform)
| Date (Local) | Platform | Retailer/Store | Location | Product | Size | Regular Price | Current Price | Drop % | Promo Type | In Stock |
|---|---|---|---|---|---|---|---|---|---|---|
| 2026-12-05 | Walmart | Walmart Store #2145 | Dallas, TX | Cheerios Original | 18 oz | 5.48 | 4.98 | 9.12% | Rollback | Yes |
| 2026-12-18 | Target | Target | Chicago, IL | Starbucks Ground Coffee | 12 oz | 9.99 | 7.99 | 20.02% | Circle Offer | Yes |
| 2026-12-28 | Instacart | Publix | Miami, FL | Coca-Cola Classic | 12x12 oz | 8.99 | 7.49 | 16.69% | Multi-buy | Yes |
| 2027-01-06 | Amazon Fresh | Amazon Fresh | Seattle, WA | Boneless Chicken Breast | 1 lb | 5.99 | 4.99 | 16.69% | Deal | Limited |
| 2027-01-14 | Publix | Publix Store #118 | Orlando, FL | Philadelphia Cream Cheese | 8 oz | 4.49 | 3.49 | 22.27% | BOGO | Yes |
(If you prefer, we can keep the year as “2026-12” and “2027-01” for strict calendar accuracy. Many teams label it as “Dec–Jan season” operationally.)
Daily Price History (Single SKU Example)
| Date | Platform | Location | Product | Current Price | Unit Price | Promo Badge | Stock Status |
|---|---|---|---|---|---|---|---|
| 2026-12-01 | Walmart | Dallas, TX | Tide Liquid Detergent 92 oz | 19.94 | 0.217/oz | — | In Stock |
| 2026-12-08 | Walmart | Dallas, TX | Tide Liquid Detergent 92 oz | 18.94 | 0.206/oz | Rollback | In Stock |
| 2026-12-15 | Walmart | Dallas, TX | Tide Liquid Detergent 92 oz | 17.94 | 0.195/oz | Rollback | In Stock |
| 2026-12-22 | Walmart | Dallas, TX | Tide Liquid Detergent 92 oz | 19.94 | 0.217/oz | — | In Stock |
| 2027-01-05 | Walmart | Dallas, TX | Tide Liquid Detergent 92 oz | 18.44 | 0.200/oz | Deal | In Stock |
Promo Comparison Snapshot (Same Day, Same Metro)
| Date | Metro | Platform | Product | Price | Unit Price | Promo Type | Notes |
|---|---|---|---|---|---|---|---|
| 2026-12-20 | New York, NY | Target | Doritos Nacho Cheese 9.25 oz | 5.79 | 0.626/oz | Multi-buy | “2 for $10” |
| 2026-12-20 | New York, NY | Walmart | Doritos Nacho Cheese 9.25 oz | 5.48 | 0.592/oz | — | Everyday price |
| 2026-12-20 | New York, NY | Instacart | Publix | Doritos Nacho Cheese 9.25 oz | 5.99 | 0.648/oz | App Promo |
| 2026-12-20 | New York, NY | Amazon Fresh | Doritos Nacho Cheese 9.25 oz | 5.69 | 0.615/oz | Deal | Delivery slot required |
Top Price Drops by Category (Weekly)
| Week | Category | Product | Platform | Location | Old Price | New Price | Drop % |
|---|---|---|---|---|---|---|---|
| 2026-W50 | Dairy | Greek Yogurt 4-pack | Target | Austin, TX | 5.99 | 4.99 | 16.69% |
| 2026-W51 | Beverages | Orange Juice 52 oz | Walmart | Phoenix, AZ | 4.48 | 3.98 | 11.16% |
| 2026-W52 | Snacks | Mixed Nuts 16 oz | Amazon Fresh | Boston, MA | 11.99 | 9.99 | 16.68% |
| 2027-W01 | Frozen | Pizza 2-pack | Instacart | Atlanta, GA | 12.99 | 10.99 | 15.40% |
| 2027-W02 | Pantry | Pasta 1 lb | Publix | Tampa, FL | 1.79 | 1.49 | 16.76% |
Alert Output (What Your Team Receives)
| Alert Time | Trigger | Platform | Product | Location | Change |
|---|---|---|---|---|---|
| 2026-12-18 09:10 | Price drop ≥ 15% | Target | Coffee 12 oz | Chicago, IL | 9.99 → 7.99 |
| 2026-12-28 14:05 | Promo activated | Instacart | Soda 12-pack | Miami, FL | Promo tag appeared |
| 2027-01-06 08:40 | Unit price drop | Amazon Fresh | Chicken breast | Seattle, WA | 5.99/lb → 4.99/lb |
What You Get With Food Data Scrape
Food Data Scrape provides structured grocery price datasets and tracking outputs designed for:
- Daily price monitoring
- Price drop detection and alerts
- Promo tracking and promo type labeling
- Location-based analysis
- Competitive benchmarking
- Data delivery that fits your workflow
Delivery options can include:
- CSV files for quick analysis
- Database-ready outputs (structured tables)
- API-style feeds for integration (if needed)
- Scheduled exports for dashboards
How to Turn Price Drops Into Decisions
Here are practical actions teams take in December–January based on tracked drops:
Competitor response planning
When a competitor drops price on a hero SKU, decide:
- match price
- protect margin and shift promo to a substitute SKU
- bundle with complementary products
Promo calendar optimization
See what promo types are most common by platform:
- Walmart: rollback-style drops
- Target: membership/circle style offers
- Publix: BOGO cycles
- Instacart: app/store-driven promo bursts
- Amazon Fresh: deal tags and availability-driven changes
Category price index reporting
Create category-level views:
- average unit price per week
- price volatility score
- number of drop events per platform
- top 20 SKUs driving most variance
Assortment and availability strategy
If the cheapest competitor is frequently out-of-stock, that’s not a stable price signal. Use stock context to prioritize real threats.
Common Challenges and How Food Data Scrape Solves Them
“Prices look different for the same product”
We address this with:
- size and pack normalization
- unit price capture
- store/location mapping
“Promos are hard to interpret”
We structure promo indicators into:
- promo type labels
- promo text capture
- separation of regular vs promo price in the schema
“We need this for multiple locations”
We support multi-location tracking and store targeting so the dataset is consistent for analysis.
“We want something that analytics can trust”
Outputs are designed for:
- schema consistency
- deduplication logic
- structured IDs
- timestamped history
Final Takeaway
If you want to track December and January grocery price drops across Instacart, Walmart, Target, Amazon Fresh, and Publix, you need more than a one-time scrape. You need a repeatable monitoring system that captures price, promo context, location, and availability with clean history.
Food Data Scrape makes this practical: you define your basket and locations, we track and structure the data, and you get outputs that help you spot true price drops early and act before the market shifts again.
If you are seeking for a reliable data scraping services, Food Data Scrape is at your service. We hold prominence in Food Data Aggregator and Mobile Restaurant App Scraping with impeccable data analysis for strategic decision-making.

