
The USA online grocery market continues to grow exponentially, driven by increasing consumer preference for convenience, evolving shopping habits, and the expansion of e-commerce grocery platforms. Online grocery shopping now accounts for a significant portion of retail food sales, making data-driven insights critical for businesses to remain competitive. Real-time tracking of product availability, SKUs, and pricing trends has become essential for retailers, FMCG brands, and supply chain managers to optimize inventory, adjust marketing strategies, and respond promptly to market fluctuations. With multiple platforms offering varied product assortments and pricing models, cross-platform comparison becomes indispensable. This report leverages data intelligence to provide insights into SKU-level performance, product pricing trends, and cross-platform assortment mapping. It equips stakeholders with the tools to make informed decisions, capture emerging trends, and enhance operational efficiency, ultimately boosting profitability and customer satisfaction in the dynamic US grocery market landscape.


1. Comprehensive SKU Coverage: Mapped over 200,000 SKUs across leading platforms to provide a detailed product-level view.
2. Real-Time Pricing Insights: Dynamic price tracking identified promotions, discounts, and fluctuating trends affecting key categories.
3. Cross-Platform Assortment Analysis: Uncovered overlaps and gaps in product offerings to inform strategic assortment planning.
4. Demand Forecasting: Identified high-demand categories and seasonal peaks to enable data-driven inventory management.
5. Actionable Business Intelligence: Provided insights to optimize pricing, marketing, and product positioning strategies.
The USA Online Grocery Product Mapping Report provides an in-depth analysis of product availability, SKU distribution, and pricing trends across leading online grocery platforms in the United States. As e-commerce grocery adoption accelerates, retailers, brands, and supply chain managers increasingly rely on structured data intelligence to remain competitive and make informed operational decisions. By leveraging the ability to Scrape Online Grocery Product Data in the USA, businesses can collect real-time insights on product assortment, pricing variations, stock levels, and promotional activities across multiple platforms. This enables a comprehensive understanding of market dynamics, consumer preferences, and competitive positioning. Furthermore, Real-Time USA Online Grocery Product Mapping allows organizations to monitor inventory fluctuations, identify gaps in product availability, and quickly adjust pricing or marketing strategies. These insights empower businesses to optimize assortment planning, enhance customer satisfaction, and improve profitability by aligning offerings with real-time consumer demand and emerging market trends.
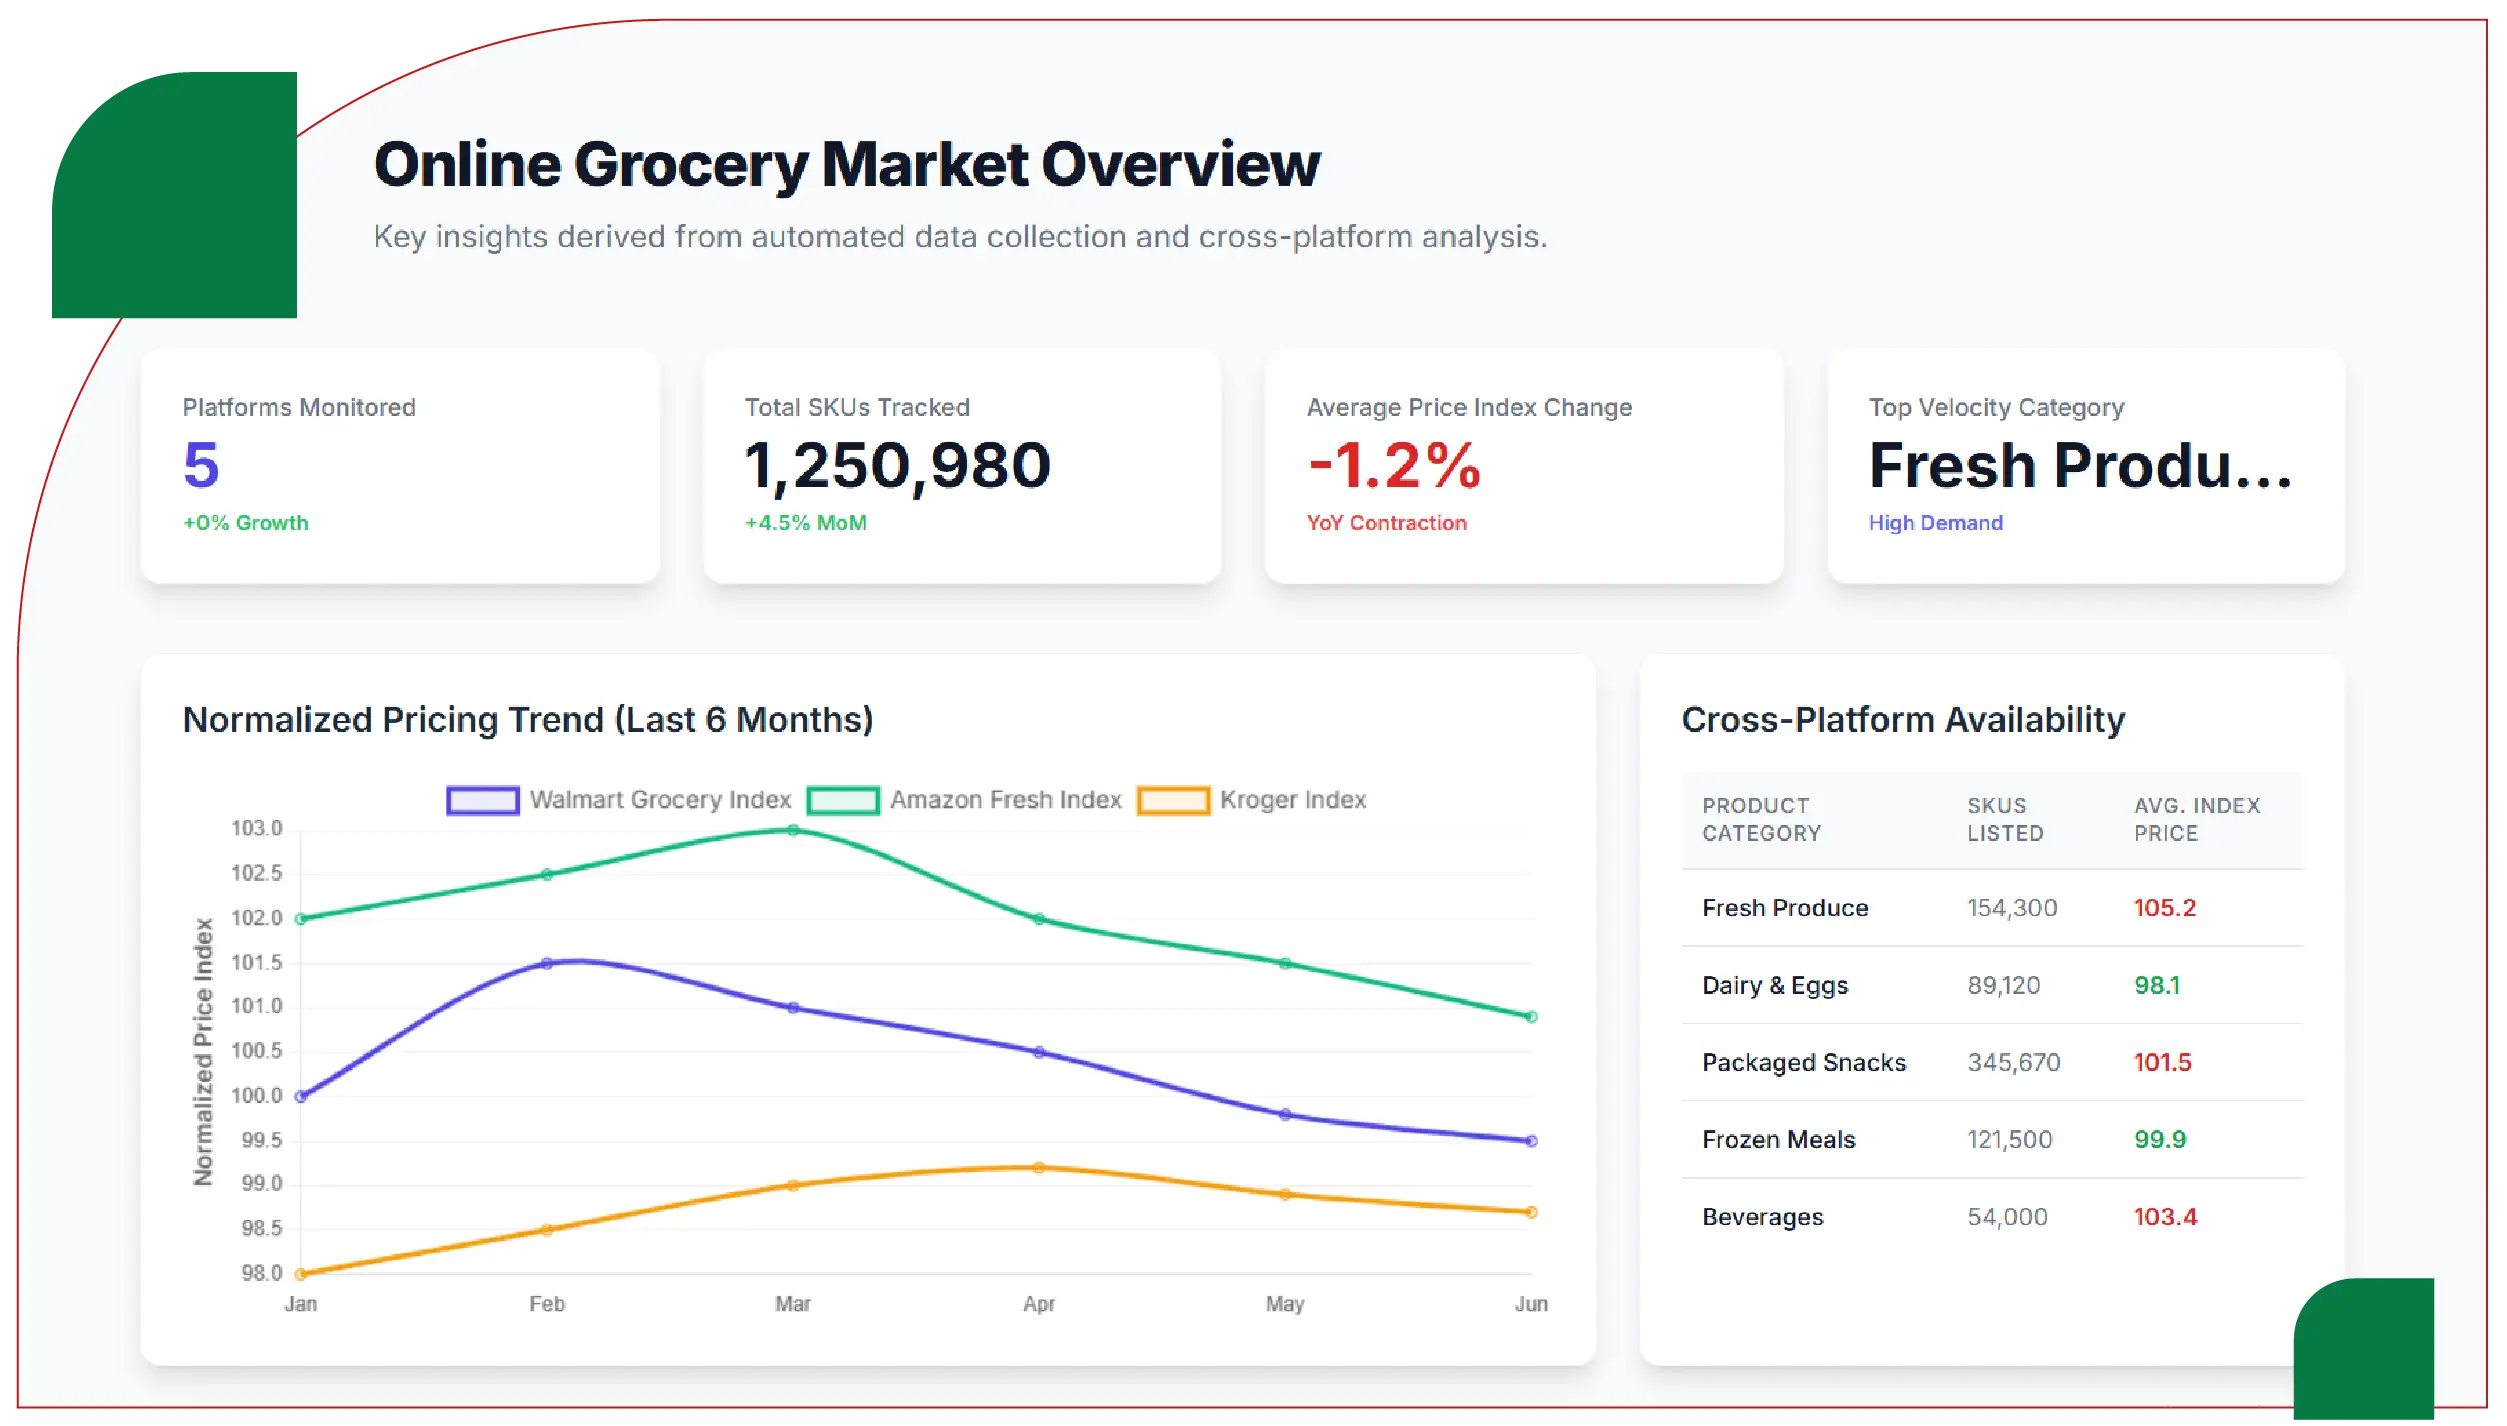
The study employed a combination of automated web scraping, API integrations, and structured data pipelines. The methodology focused on collecting, normalizing, and analyzing data from top grocery platforms, including Walmart Grocery, Amazon Fresh, Kroger, Instacart, and Target. Key steps included:
These techniques enable stakeholders to Extract USA Online Grocery Product Prices & SKUs efficiently and generate actionable insights for inventory, marketing, and competitive analysis.
The US online grocery sector covers a wide range of categories including fresh produce, beverages, packaged foods, dairy products, and household essentials. SKU distribution and average prices vary across platforms, reflecting differences in regional availability and platform-specific pricing strategies.
| Category | Walmart Grocery SKUs | Amazon Fresh SKUs | Kroger SKUs | Instacart SKUs | Target SKUs | Average Price (USD) |
|---|---|---|---|---|---|---|
| Fresh Produce | 12,500 | 10,800 | 11,200 | 9,500 | 10,000 | 4.25 |
| Packaged Foods | 25,300 | 27,000 | 24,500 | 22,800 | 23,500 | 6.75 |
| Beverages | 10,200 | 12,500 | 11,000 | 9,800 | 10,400 | 3.50 |
| Dairy & Eggs | 8,500 | 9,200 | 8,800 | 7,900 | 8,300 | 5.20 |
| Household Essentials | 15,000 | 16,500 | 14,800 | 13,700 | 14,200 | 7.10 |
Insights:
Through USA Online Grocery SKU Mapping & Market Insights, high-demand products and critical SKUs were identified. This provides businesses with insights into sales velocity, stock availability, and pricing strategies for each platform.
| Walmart Grocery | Amazon Fresh | Kroger | Instacart | Target | |
|---|---|---|---|---|---|
| Organic Bananas (1lb) | ✓ | ✓ | ✓ | ✓ | ✓ |
| Almond Milk (32oz) | ✓ | ✓ | ✓ | ✓ | ✓ |
| Whole Wheat Bread | ✓ | ✓ | ✓ | ✓ | ✓ |
| Bottled Water (24-pack) | ✓ | ✓ | ✓ | ✓ | ✓ |
| Greek Yogurt (6-pack) | ✓ | ✓ | ✓ | ✓ | ✓ |
Key Takeaways:
Grocery Cross-Platform Product Mapping Analysis USA provides businesses with critical insights into SKU distribution, overlapping products, and potential market opportunities across leading online grocery platforms. By analyzing product assortments, retailers can identify unique SKUs that differentiate their offerings, optimize inventory, and capture untapped market segments.
Grocery Industry Product Mapping and Price Tracking USA empowers businesses to make informed decisions on assortment planning, promotional campaigns, and pricing strategies, while also enabling accurate revenue forecasting and data-driven performance evaluation at the SKU level.
Advanced platforms utilize Grocery App Data Scraping services to efficiently collect structured product and pricing information from online grocery apps. Additionally, Grocery Delivery Scraping API Services enable automated extraction of delivery, SKU, and availability data across multiple platforms. Applications include:
The report conducted an in-depth analysis of price dynamics across key product categories within the US online grocery market, providing insights into trends that influence both consumer behavior and retailer strategies.
The USA online grocery market is becoming increasingly competitive, where insights on pricing, product availability, and SKU-level data play a crucial role in strategic decision-making. Businesses that leverage Real-Time USA Online Grocery Product Mapping can monitor inventory fluctuations, identify emerging trends, and respond swiftly to changing consumer demand. Cross-platform comparisons enable retailers to benchmark performance, spot product gaps, and optimize assortment planning. Automated data extraction helps streamline operations, reduce manual effort, and maintain up-to-date market intelligence. By integrating a Grocery Price Tracking Dashboard, organizations gain a centralized view of pricing trends, while Grocery Pricing Data Intelligence supports informed pricing and promotional strategies. Access to comprehensive Grocery Store Datasets further empowers retailers and brands to enhance efficiency, improve competitiveness, and maximize profitability in a dynamic digital grocery landscape.
Are you in need of high-class scraping services? Food Data Scrape should be your first point of call. We are undoubtedly the best in Food Data Aggregator and Mobile Grocery App Scraping service and we render impeccable data insights and analytics for strategic decision-making. With a legacy of excellence as our backbone, we help companies become data-driven, fueling their development. Please take advantage of our tailored solutions that will add value to your business. Contact us today to unlock the value of your data.

