
The Brief: National Expansion Without National Data
The client — a casual-dining chain with strong regional presence and aggressive growth ambitions — faced a familiar problem at national scale. Their existing markets were well understood, but their target expansion markets were not. Across 30 states, they could not answer basic but critical questions. How many direct and indirect competitors operated in each trade area? Where were the white-space pockets — neighborhoods underserved by both chains and independents? What pricing benchmarks were realistic in each metro? Which GPS-coordinate clusters indicated strong restaurant demand, and which were declining? Where did chain saturation push independents toward closure?
Standard broker reports offered macro-level market sizing but no parcel-level resolution. National chain directories listed locations but ignored independents, menus, and GPS precision. Existing internal databases were stale, partial, and inconsistent across regions. Without nationwide, ground-truth intelligence, every expansion decision would be a guess dressed up as analysis.
The chain's executive team made the call: they needed a comprehensive USA restaurant database — every outlet, every menu, every GPS point — built and refreshed by a specialist data partner rather than assembled piecemeal from incompatible sources. The brief was specific: at minimum 500,000 outlets, complete menu data where available, GPS coordinates accurate enough for trade-area analysis, chain attribution where applicable, and a refresh cadence fast enough to keep pace with industry churn. By leveraging Restaurant Data Intelligence, the organization aimed to create a single source of truth for market analysis, competitive benchmarking, site selection, and strategic growth planning across the US restaurant landscape.
Methodology: How the 500K-Outlet Database Was Built

The database rested on a multi-source, GPS-validated, continuously refreshed methodology designed to deliver the scale, accuracy, and depth the client required.
- Multi-source aggregation: No single source covers the full US restaurant market. The methodology combined public restaurant listings, chain corporate directories, food delivery platform listings, mapping service data, and review platform records into a single harmonized layer. Each source was tagged, allowing analysts to trace any record back to its origin.
- Outlet-level deduplication: Aggregation across multiple sources creates duplication. A four-stage deduplication pipeline matched outlets by name similarity, address parsing, GPS proximity within a defined radius, and operating-hours overlap. The pipeline collapsed multi-source duplicates into a single canonical outlet record per physical location.
- GPS coordinate validation: Restaurant coordinates from different sources frequently disagree. Each outlet's GPS was cross-validated against parcel data and geocoding services, with confidence scoring applied to every coordinate. Low-confidence records were flagged for manual review rather than silently published.
- Menu capture: -restaurant-data-scraping Where menu data was publicly available, dish-level records — name, description, price, category, dietary flags — were captured and linked to the parent outlet. Menu refresh was prioritized for top-velocity merchants and chain locations where menu standardization mattered.
- Chain attribution: A chain-recognition layer matched outlets to known restaurant chains using brand-name normalization, logo detection, and corporate directory cross-referencing. Independent outlets — the long tail — were tagged as such, enabling chain-versus-independent analysis.
- Cuisine taxonomy: Every outlet was mapped into a harmonized cuisine taxonomy spanning American, Italian, Mexican, Chinese, Japanese, Korean, Indian, Thai, Vietnamese, Mediterranean, Middle Eastern, fast-casual, fine dining, quick service, cafes, bakeries, dessert specialists, and emerging categories.
- Refresh cadence: Top-velocity outlets and recent openings were refreshed weekly; the long tail was refreshed monthly. New openings and closures triggered near-real-time updates where signal strength allowed.
- Quality assurance: Every record passed schema validation, address normalization, GPS confidence scoring, menu-link verification, and outlier detection before reaching client systems.
Sample Data: What the Database Captured
The following sample tables illustrate the structure and depth of the US Restaurant Database.
Sample 1: Restaurant Density by State (Top 10)
| State | Total Outlets | Chains | Independents | Chain Share |
|---|---|---|---|---|
| California | 84,200 | 28,500 | 55,700 | 33.8% |
| Texas | 62,800 | 23,400 | 39,400 | 37.3% |
| Florida | 49,600 | 17,800 | 31,800 | 35.9% |
| New York | 47,100 | 12,900 | 34,200 | 27.4% |
| Illinois | 28,900 | 10,200 | 18,700 | 35.3% |
| Pennsylvania | 26,400 | 9,800 | 16,600 | 37.1% |
| Ohio | 24,100 | 9,400 | 14,700 | 39.0% |
| Georgia | 23,700 | 9,100 | 14,600 | 38.4% |
| North Carolina | 22,300 | 8,500 | 13,800 | 38.1% |
| Michigan | 20,800 | 7,900 | 12,900 | 38.0% |
Sample 2: Cuisine Distribution Nationwide
| Cuisine Category | Active Outlets | Share of Total |
|---|---|---|
| American Casual / QSR | 162,400 | 31.8% |
| Mexican | 58,700 | 11.5% |
| Italian / Pizza | 54,200 | 10.6% |
| Chinese | 41,800 | 8.2% |
| Cafe / Coffee | 38,500 | 7.5% |
| Asian Fusion | 27,300 | 5.4% |
| Japanese / Sushi | 24,900 | 4.9% |
| Indian | 14,200 | 2.8% |
| Mediterranean | 13,100 | 2.6% |
| Other | 75,800 | 14.7% |
Sample 3: Regional Pricing Benchmarks (Casual-Dining Entree Average)
| Region | Average Entree | Median Combo Set | Independent Premium |
|---|---|---|---|
| Northeast | $18.40 | $24.90 | +14% |
| West (CA, WA, OR) | $19.80 | $26.20 | +16% |
| Midwest | $14.60 | $19.80 | +9% |
| South | $15.20 | $20.40 | +10% |
| Mountain | $16.10 | $21.60 | +11% |
Sample 4: Chain vs Independent Split, Sample Metros
| Metro Area | Chains | Independents | Chain Share |
|---|---|---|---|
| Los Angeles | 9,800 | 22,400 | 30.4% |
| Chicago | 7,200 | 12,900 | 35.8% |
| Houston | 6,400 | 9,800 | 39.5% |
| Phoenix | 4,800 | 7,100 | 40.3% |
| Atlanta | 5,200 | 7,800 | 40.0% |
| Seattle | 3,900 | 7,600 | 33.9% |
| Boston | 3,600 | 7,100 | 33.6% |
Sample 5: GPS Coordinate Confidence Distribution
| Confidence Tier | Share of Records | Use Case |
|---|---|---|
| Parcel-precise | 78% | Trade-area analysis, isochrone modeling |
| Block-precise | 16% | District-level density, mapping |
| Street-precise | 5% | General locator, low-stakes mapping |
| Low confidence | 1% | Flagged for review, excluded from analytics |
These tables represent a portion of the full dataset, which captured outlet, menu, GPS, and chain attribution detail across all 500,000-plus US restaurant records.
Key Findings
The database surfaced several findings that directly shaped the client's expansion strategy.
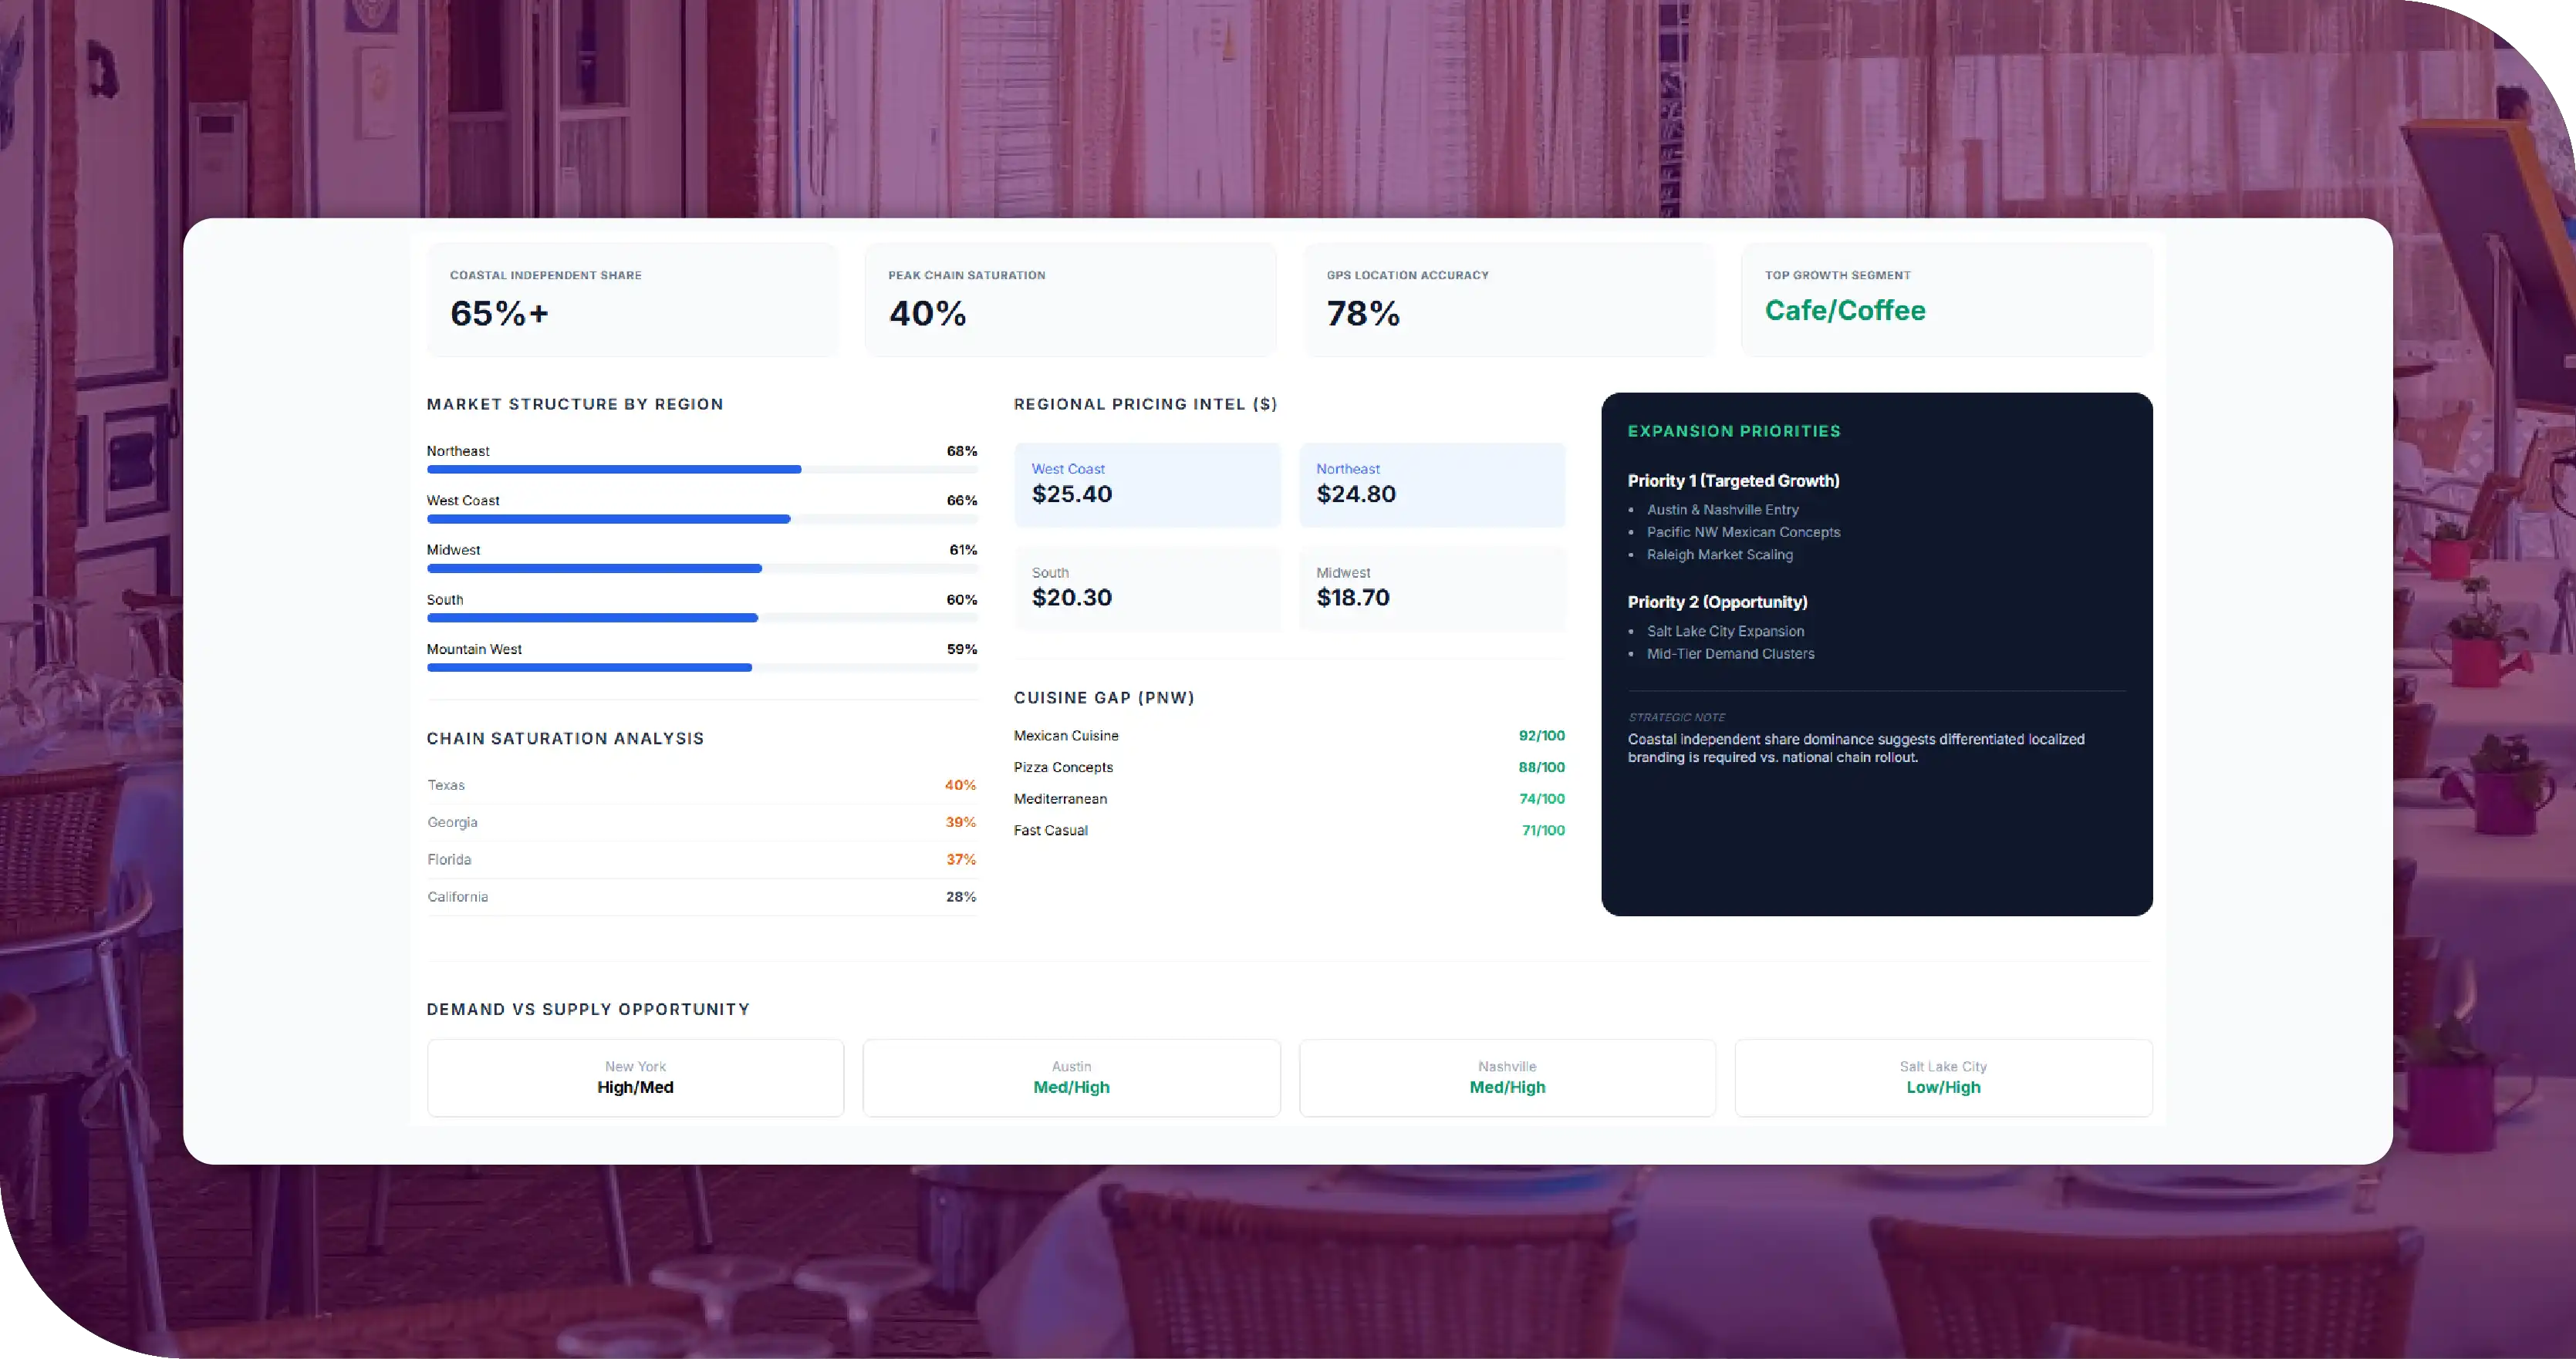
- Independent restaurants dominate the long tail in coastal metros: New York, Los Angeles, and the San Francisco Bay Area showed independent shares above 65 percent — meaningfully higher than national average. For a chain entering these metros, independents formed the real competitive set, not other chains.
- Chain saturation is highest in the South and Mountain West: States like Texas, Georgia, and Arizona showed chain shares of 38 to 40 percent, with several metros above 45 percent at the trade-area level. New entrants in these regions faced harder competitive economics than coastal-metro equivalents.
- Pricing tiers cluster regionally: The West and Northeast priced casual-dining entrees 25 to 35 percent above Midwest equivalents. Independents commanded an additional 9 to 16 percent premium over chain pricing across every region — a structural pattern the client could use directly in menu engineering.
- Mexican and pizza categories under-index in the Pacific Northwest: Despite strong national share, both categories were notably less dense in Washington and Oregon than in California or Texas. The client identified these as potential cuisine gaps for partner brands in its portfolio.
- Cafe and coffee specialists are growing fastest by net new openings: Year-over-year, cafe and coffee specialists showed the highest rate of net new outlets, concentrated in mid-tier metros where independent operators competed effectively against chains. The pattern signaled where independent disruption was strongest.
- Outlet-density does not equal demand: The database surfaced several metros where outlet count was high but review velocity per outlet was relatively low, suggesting over-supply. Conversely, several mid-tier metros showed lower outlet counts paired with strong per-outlet review velocity — clear white-space signals for the client.
- GPS-precise data enables true trade-area analysis: With 78 percent of records parcel-precise, the client could run accurate isochrone analysis around candidate locations — something approximate location data could not support reliably.
How the Client Used the Findings
Armed with the US Restaurant Database, the client made three concrete decisions.
First, they re-sequenced expansion priorities. Instead of launching first in saturated Southern metros — where chain density was highest and competitive economics were tightest — they shifted opening priority toward mid-tier metros in the Mountain West and Pacific Northwest, where the database identified genuine white space at the trade-area level.
Second, they built region-specific menu pricing. Rather than a single national price list, the client designed five regional pricing tiers aligned to the database's regional benchmarks. The new pricing protected margin in higher-cost regions and maintained competitiveness in value-tier markets, replacing a single national assumption with five evidence-based ones.
Third, they targeted independent-heavy trade areas with a positioning that differentiated against independents rather than chains. The database revealed that in many coastal metros, the real competitive set was the independent long tail — not the obvious chain competitors. The client built marketing and menu messaging that competed on the strengths chains hold over independents (consistency, loyalty programs, digital ordering) rather than imitating independents.
The result was an expansion plan grounded in parcel-level, menu-level, and pricing-level evidence rather than broker-level assumption — exactly the outcome the engagement was designed to deliver.
Why the Data Approach Mattered
The alternative to a comprehensive database would have been the traditional approach: broker reports, a handful of site visits, and intuition extrapolated from existing markets. That approach would have led the client toward saturated metros that looked superficially attractive and away from genuinely under-served mid-tier markets that demanded harder analytical work to identify.
The USA Restaurant Database changed the decision entirely. By providing 500,000-plus outlets with menus, GPS precision, and chain attribution, the database identified opportunities and risks no amount of intuition would have surfaced. This is the core value of comprehensive restaurant data: it replaces confident guesses with evidence.
Lessons for Other Markets
While this engagement focused on the US, the methodology and its lessons transfer directly to any national or regional restaurant expansion.
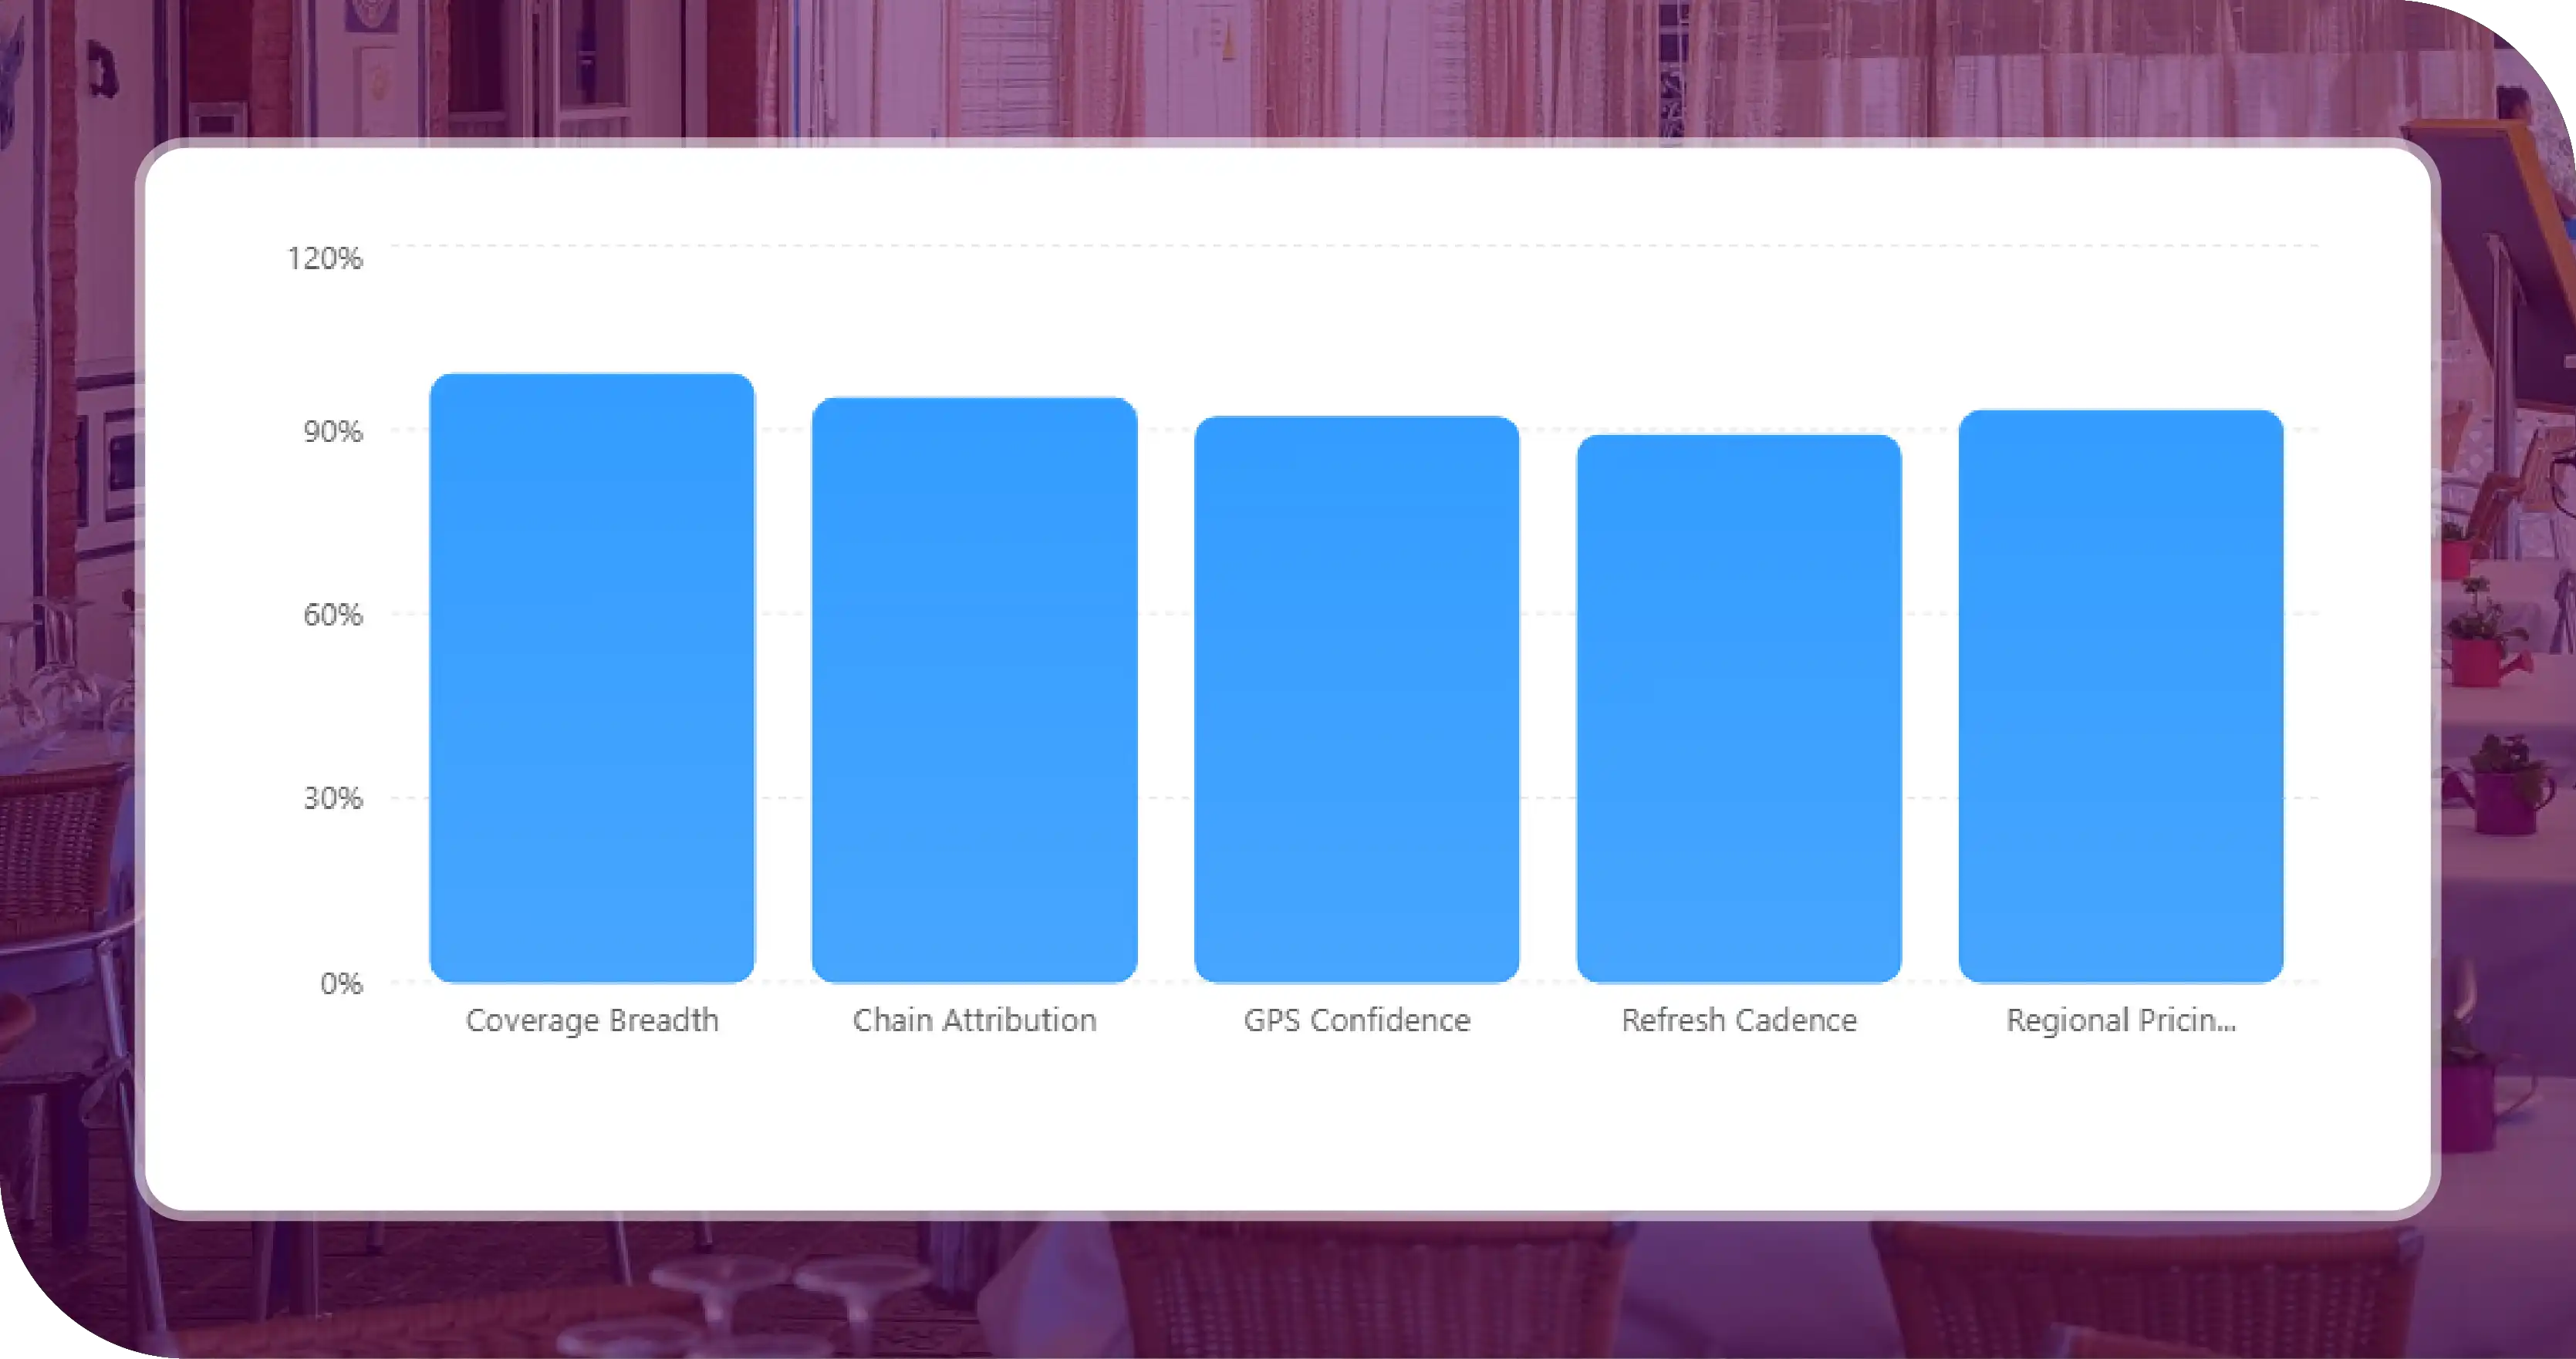
- Coverage breadth determines decision quality: Partial coverage produces partial answers. A database that ignores independents, lacks GPS precision, or misses menu data will systematically mislead expansion planning. Comprehensive coverage is non-negotiable for serious territory planning.
- Chain attribution changes the competitive picture: Treating all outlets as undifferentiated competitors misses the structural difference between chains and independents. Chain-versus-independent analysis routinely reveals competitive sets that look very different from the assumed picture.
- GPS confidence is a hidden quality dimension: Many restaurant datasets carry GPS coordinates of mixed quality without flagging it. A trade-area model built on low-confidence coordinates can produce confidently wrong recommendations. Confidence scoring is essential.
- Refresh cadence determines decision currency: US restaurant industry churn is meaningful. A six-month-stale database has already lost a measurable share of openings and closures. Refresh cadence should match the speed of decision-making.
- Pricing tiers are stable within regions, not within countries: US regional pricing differences are large and predictable. National-average pricing is almost always misleading; regional benchmarks are almost always more useful.
These lessons illustrate why comprehensive, GPS-validated, menu-linked, chain-aware restaurant data repays its cost many times over.
Engagement Outcomes at a Glance
The table below summarizes the measurable outcomes the client attributed to the database within the first year of the expansion program.
| Outcome Area | Before the Database | After Acting on the Database |
|---|---|---|
| Target metro selection | Intuition-led (Southern bias) | Data-led (Mountain West, PNW priority) |
| Pricing structure | Single national list | Five regional tiers |
| Competitive analysis | Chain-focused | Chain + independent + cuisine-gap-aware |
| Trade-area modeling | Approximate location data | Parcel-precise GPS modeling |
| Expansion confidence | Broker-report dependent | Evidence-anchored decision-making |
The engagement converted a high-stakes, intuition-led expansion program into a disciplined, data-led rollout — and gave the client an ongoing reference dataset for every future market decision.
Why Choose Food Data Scrape
Building a 500,000-outlet US restaurant database is a significant undertaking. It requires multi-source aggregation across public listings, chain directories, delivery platforms, and mapping services; rigorous deduplication; GPS validation and confidence scoring; menu capture and linkage; chain attribution logic; harmonized cuisine taxonomy; and sustained refresh capacity to keep pace with industry churn. Most internal teams lack the engineering infrastructure and analyst depth to deliver this at the necessary scale and quality. Leveraging comprehensive Food Dataset enables businesses to gain a unified view of the restaurant landscape, supporting market analysis, competitive benchmarking, and expansion planning.
We bring managed infrastructure, ethical and compliant data collection practices, and deep domain expertise in restaurant and food-service data. Advantages include compliance-first architecture, scalable extraction across millions of public pages daily, harmonized cuisine and chain taxonomies, GPS validation and confidence scoring, fully customizable refresh cadence, dedicated analyst support familiar with US restaurant market dynamics, and out-of-the-box dashboards highlighting density, white space, pricing tiers, and chain-versus-independent patterns. Our Food Delivery Scraping API supports large-scale, automated data acquisition from publicly available restaurant and delivery sources, ensuring consistent and reliable coverage across markets.
The team has supported national restaurant chains, franchise groups, FMCG suppliers, real estate developers, investors, and research consultancies—bringing the practical experience of how comprehensive restaurant data drives real commercial outcomes. Through advanced Food Delivery Intelligence, organizations can uncover market trends, monitor competitive activity, identify growth opportunities, and make data-driven decisions with confidence.
Final Outcome
The USA Restaurant Database Case Study demonstrates how comprehensive, GPS-validated, menu-linked restaurant data transforms a high-stakes national expansion decision. By providing 500,000-plus outlets across every state, the database revealed where competition concentrated, where the client's concept had genuine white space, what pricing was realistic by region, and where independents — not chains — formed the real competitive set. The client launched its expansion with a plan built on ground-truth evidence, not broker-level assumption.
For any national restaurant chain, franchise group, real estate developer, or investor evaluating US restaurant markets, the lesson is consistent: structured, comprehensive, parcel-precise restaurant data turns expansion from a series of guesses into a disciplined commercial program.
If you are ready to base your next expansion decision on a 500,000-outlet ground-truth view of the US restaurant market, get in touch with our team today.

