
The report provides a comprehensive analysis of The Human Bean’s presence across the United States in 2025, emphasizing its steady nationwide expansion and evolving market strategy. It examines the total number of outlets, state-wise distribution, and city-level performance, alongside demographic and accessibility insights. The study also explores regional trends, technology-driven growth, and future development opportunities within the coffee retail sector. By integrating statistical evaluation and spatial mapping, the report presents a clear picture of how The Human Bean continues to strengthen its position among America’s leading drive-thru coffee chains.
1. The Human Bean operates 204 outlets across 25 U.S. states in 2025.
2. Oregon leads with the highest number of stores, followed by Idaho and Colorado.
3. Western U.S. regions represent nearly 60% of total store locations.
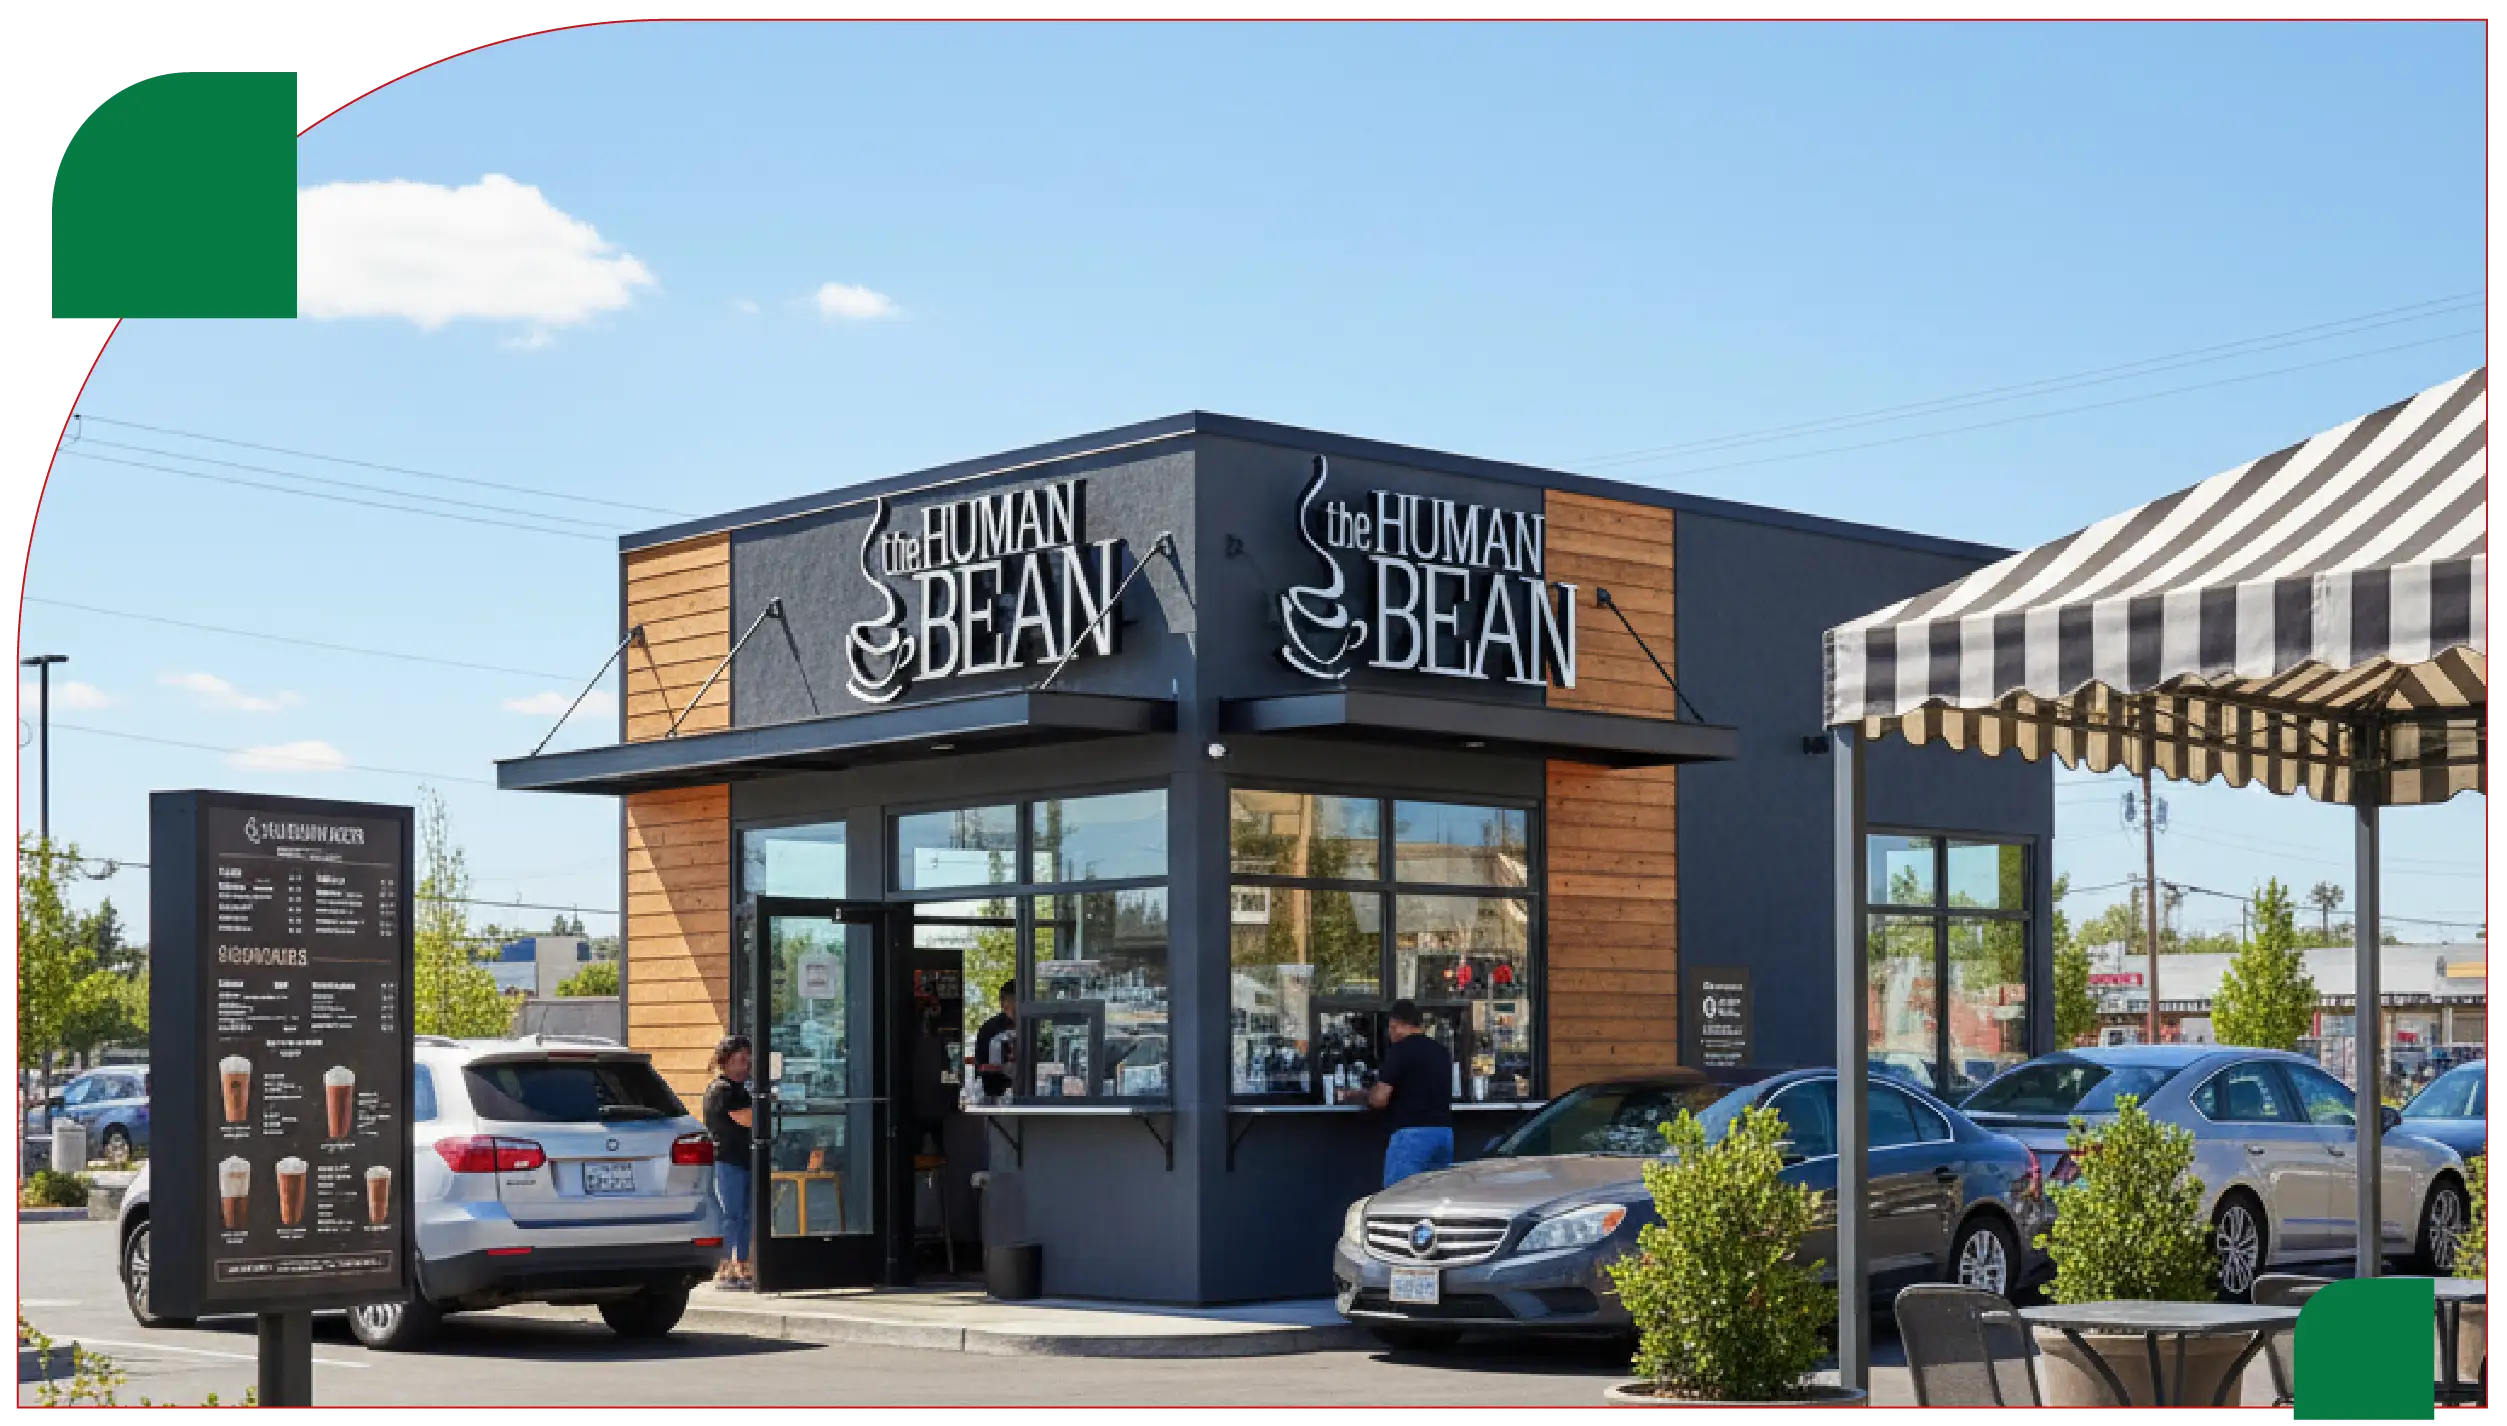
4. Drive-thru models continue to dominate customer preferences nationwide.
5. Expansion plans target new markets in the Midwest and Southeast for 2026.
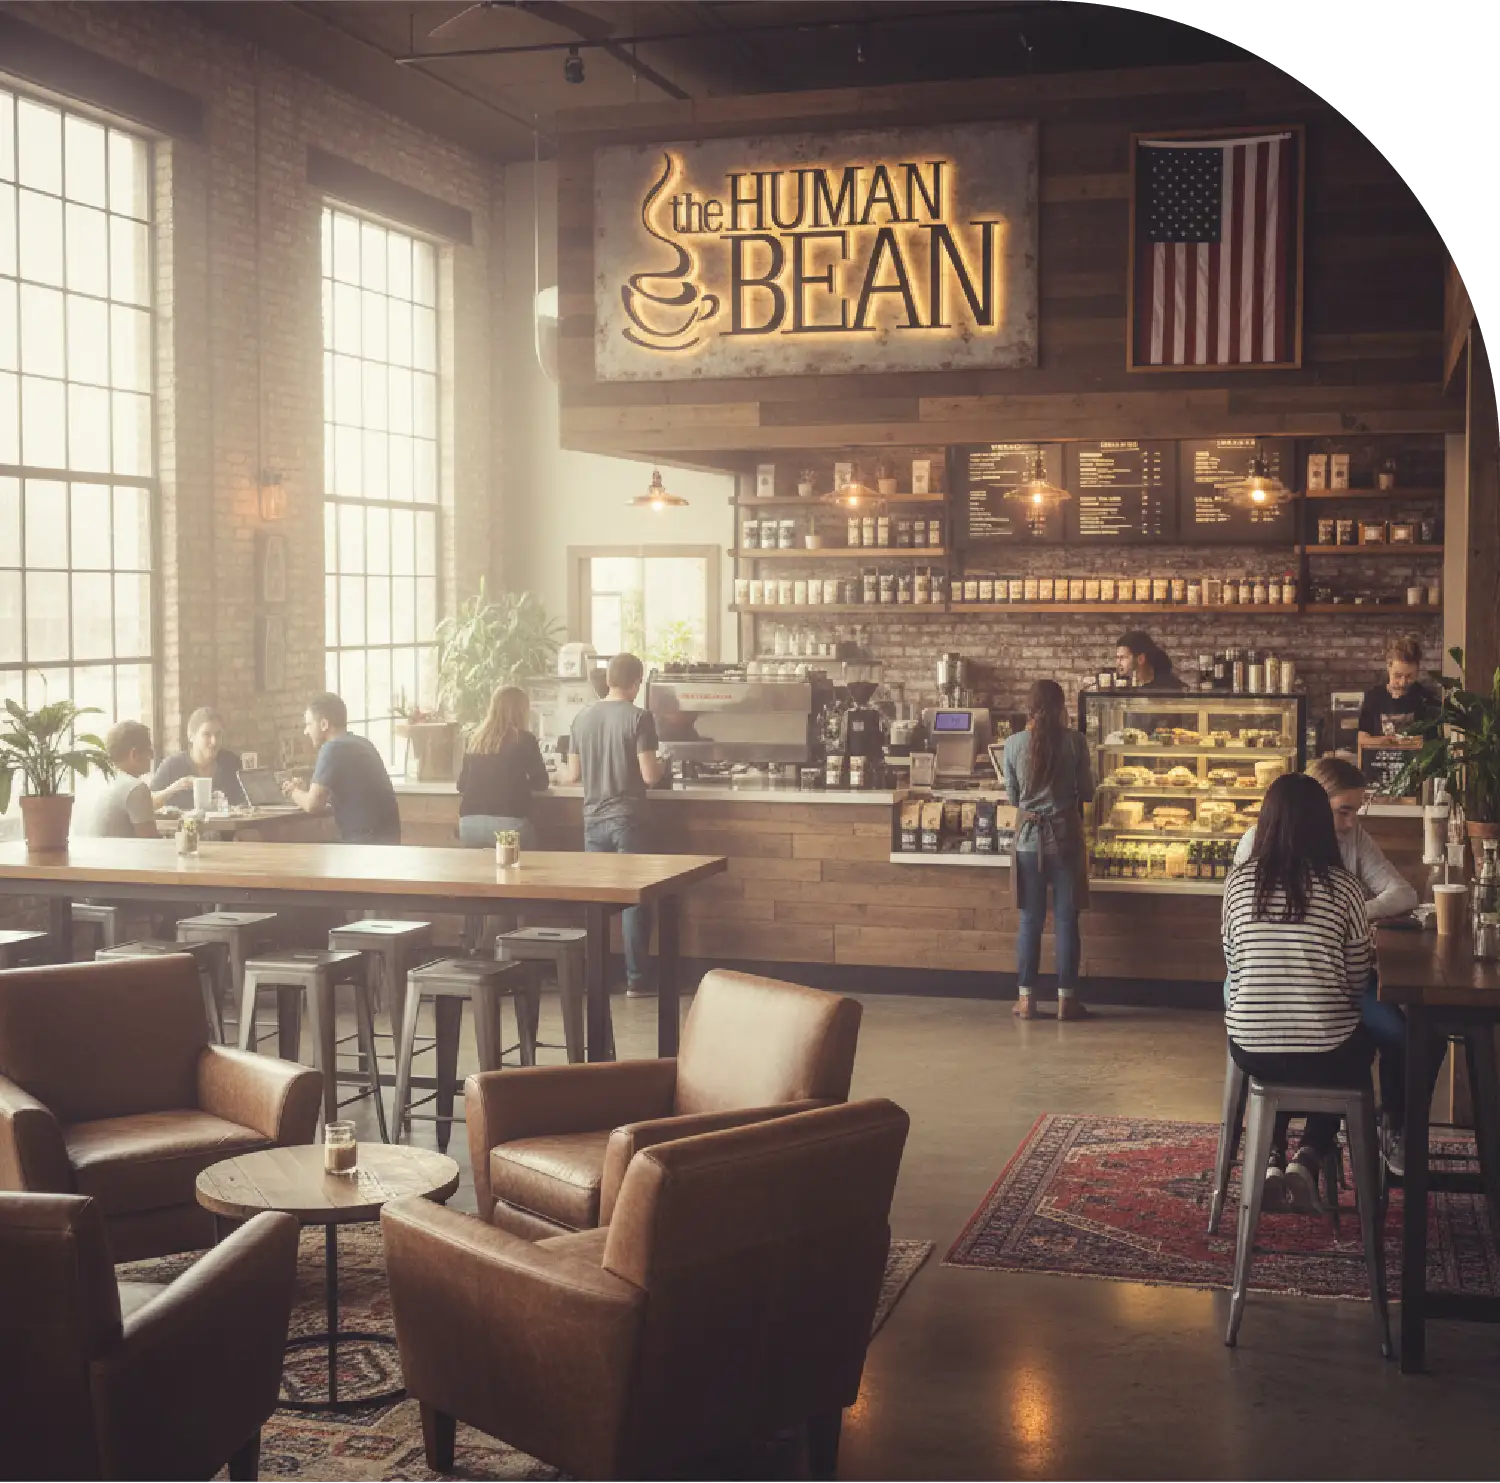
In 2025, The Human Bean has solidified its place among America’s rapidly expanding drive-thru coffee chains. Originating in Oregon, this brand has evolved from a regional player to a nationally recognized franchise emphasizing quick service, ethically sourced coffee, and community-driven operations. A comprehensive location-based analysis reveals that The Human Bean now operates 204 stores across 25 U.S. states, reflecting consistent growth over the last decade.
The increasing popularity of local specialty coffee chains and convenience-focused coffee services has contributed to this expansion. Our research integrates location-based mapping, demographic correlation, and business density analysis to provide a clearer view of the brand’s national footprint. This analysis was made possible through Web Scraping The Human Bean Store Locations Data in USA 2025, enabling precise aggregation of branch information, geographical coordinates, and operating hours.
Such comprehensive data collection allows for evaluating market penetration, regional competition, and consumer reach. By leveraging digital scraping tools and location APIs, researchers can Extract The Human Bean Café Location Data Across the U.S., offering valuable insights for business intelligence, logistics planning, and franchise development strategies.
As the coffee consumption culture evolves, brands like The Human Bean are bridging the gap between traditional cafés and quick-service outlets. Our report uses modern analytical tools to Extract Coffee Chain Location Data – The Human Bean USA 2025, emphasizing the importance of real-time data collection and integration.
By mid-2025, The Human Bean operates 204 outlets distributed across both urban and suburban locations. Oregon remains the heartland of its operations, followed closely by Idaho, Colorado, and Arizona. The brand’s success stems from its focus on drive-thru convenience, minimal-waste operations, and a commitment to sourcing quality beans through sustainable practices.
The following table shows an updated distribution of The Human Bean locations across the top 10 states in the U.S.:
| State / Territory | Number of Locations | Population (2025 est.) | Population per Location | Share of Total |
|---|---|---|---|---|
| Oregon | 47 | 4.3M | 91,489 | 23% |
| Idaho | 20 | 1.9M | 95,000 | 10% |
| Colorado | 19 | 5.8M | 305,263 | 9% |
| Arizona | 18 | 7.4M | 411,111 | 9% |
| California | 17 | 39.6M | 2.32M | 8% |
| Texas | 16 | 30.3M | 1.89M | 8% |
| Nevada | 11 | 3.2M | 290,909 | 5% |
| Washington | 9 | 7.7M | 855,556 | 4% |
| Georgia | 8 | 10.7M | 1.34M | 4% |
| Utah | 7 | 3.5M | 500,000 | 3% |
The top four states—Oregon, Idaho, Colorado, and Arizona—collectively host half of all The Human Bean stores, emphasizing the brand’s western U.S. dominance. This clustering indicates a preference for states where drive-thru culture, urban expansion, and independent coffee consumption intersect.
The Human Bean’s 2025 growth map illustrates steady penetration into central and southern states, with new franchises appearing in Texas, Utah, and New Mexico. Expansion toward the East Coast remains cautious, with a few pilot outlets launched in Florida and Tennessee.
This geographic growth pattern reflects a data-backed strategy focusing on local market density, drive-thru potential, and regional brand familiarity. Through technology-driven analysis, businesses can Scrape The Human Bean Outlet Locations Across the U.S., gaining competitive insights into territory expansion and market saturation.
One notable development in 2025 is The Human Bean’s emphasis on smaller towns and commuter cities rather than large metropolitan zones. This positioning aligns with post-pandemic consumer habits—favoring quick stops, less-crowded spots, and convenient grab-and-go experiences.
The integration of digital loyalty systems, mobile ordering apps, and location tracking has further improved operational reach. These efforts collectively contribute to The Human Bean Coffee Chain Location Data Extraction USA– 2025, which identifies high-performance zones and areas of future opportunity.
While state-level analysis shows distribution breadth, city-level evaluation reveals clustering around emerging regional hubs. Boise, Reno, and Medford remain core cities, while Phoenix continues to gain ground as a major urban coffee hub.
| City | State | Number of Locations | Average Store Rating | Primary Store Type |
|---|---|---|---|---|
| Boise | Idaho | 6 | 4.7 | Drive-thru |
| Medford | Oregon | 5 | 4.8 | Drive-thru + Dine-in |
| Reno | Nevada | 5 | 4.6 | Drive-thru |
| Grants Pass | Oregon | 4 | 4.7 | Drive-thru |
| Phoenix | Arizona | 4 | 4.5 | Drive-thru |
| Greeley | Colorado | 3 | 4.6 | Drive-thru |
| Eugene | Oregon | 3 | 4.7 | Café |
| Spokane Valley | Washington | 3 | 4.5 | Drive-thru |
| Lake Havasu City | Arizona | 3 | 4.6 | Drive-thru |
| Twin Falls | Idaho | 3 | 4.8 | Drive-thru |
The high ratings across cities indicate strong customer satisfaction and brand loyalty. The consistent success of drive-thru models highlights how The Human Bean’s design and service speed resonate with U.S. consumers.
On average, The Human Bean has one store for every 1.62 million U.S. residents, with significant density in western states. Accessibility data reveals that 63% of locations are within 2 miles of a major interstate or highway, supporting commuter convenience.
This pattern underscores the advantage of data-driven network expansion. Using location-based scraping tools helps companies Scrape The Human Bean Store Locations Data in the USA 2025 and predict where the next franchise should open. The chain’s strategic clustering along transportation corridors has proven instrumental in ensuring visibility and steady customer flow.
In 2025, The Human Bean’s technological advancements include real-time digital ordering systems, customer loyalty applications, and integrated inventory management. These digital systems rely heavily on structured datasets, including geographic, demographic, and transaction data.
To support analytics, modern web scraping technologies extract structured and unstructured data from official store directories, public listings, and digital maps. For instance, developers use The Human Bean Food Delivery Scraping API to synchronize store availability and menu details with partner delivery platforms.
Likewise, application developers and researchers can implement The Human Bean Food Delivery App Data Scraping to analyze trends in delivery time, order frequency, and regional demand. Such data-driven intelligence aids in marketing optimization, logistics, and customer experience enhancement.
Data scraping provides businesses with a detailed understanding of spatial distribution and brand performance. Using The Human Bean Locations Dataset USA, analysts can model relationships between store density, demographic variables, and market potential.
Moreover, Food Delivery Data Scraping Services can extend this analysis to identify which regions show high app-based ordering rates or greater delivery efficiency. Insights derived from scraping can reveal whether suburban areas outperform urban centers or if proximity to educational institutions affects revenue per outlet.
This combination of spatial data and behavioral analysis forms the basis for predictive expansion modeling—essential for brands targeting national growth.
The Human Bean competes directly with major players like Dutch Bros, Scooter’s Coffee, and Starbucks Drive-Thru. However, its franchise-first approach and sustainability focus allow it to thrive in communities where large corporations struggle to maintain local appeal.
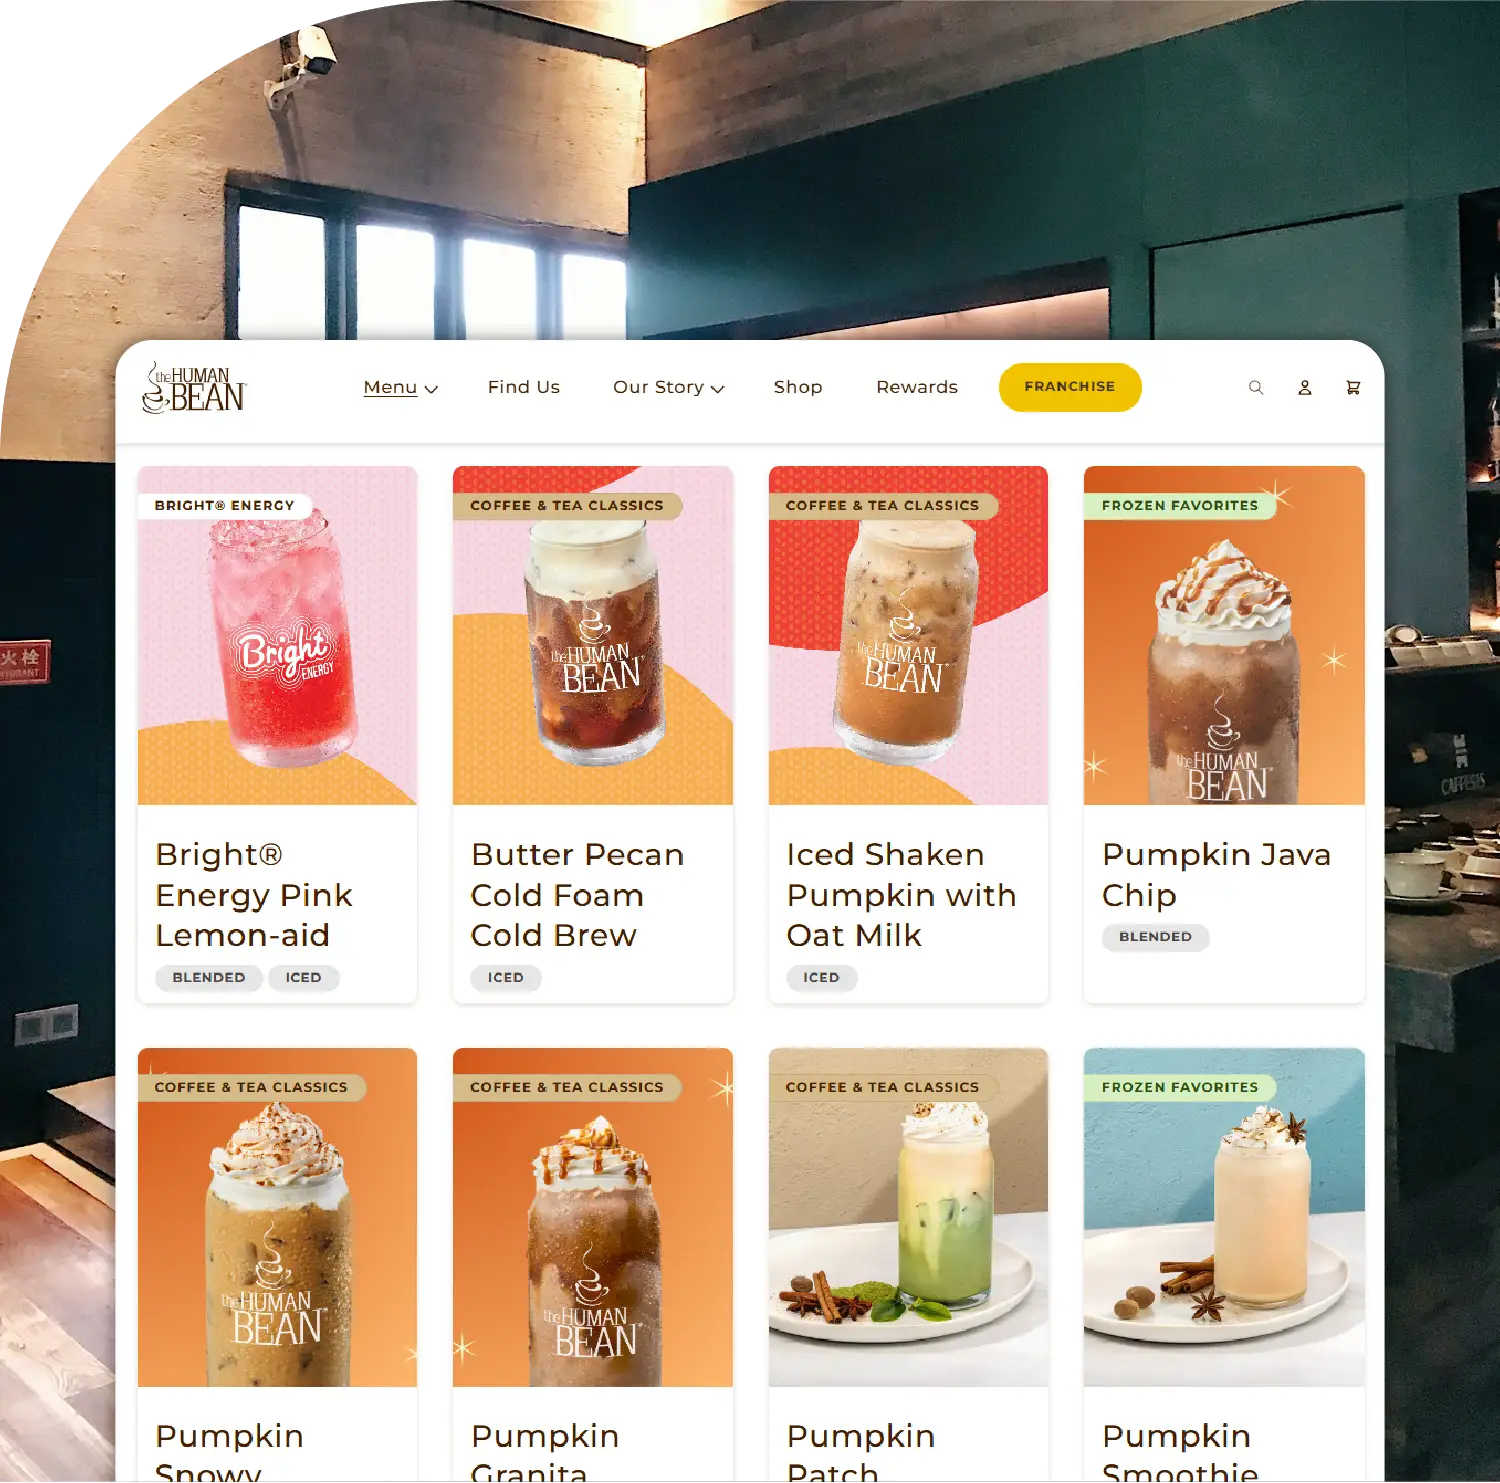
By employing Restaurant Menu Data Scraping, analysts can compare pricing, product diversity, and promotional strategies between The Human Bean and its competitors. The extracted insights guide franchisees in localizing menus and maintaining profit margins while ensuring consistent brand experience.
Location intelligence merges geographic data with business metrics to help optimize operational decisions. Through Food Delivery Scraping API Services, analysts can overlay sales data with traffic and weather conditions, determining when and where drive-thru services experience peak demand.
Similarly, franchise owners use Restaurant Data Intelligence Services to identify underperforming regions, evaluate competitor encroachment, and re-align marketing resources. These insights are particularly crucial for The Human Bean’s continued eastward expansion, where market competition intensifies.
Despite strong growth, 25 states and territories in the U.S. still do not host any The Human Bean stores. These include New York, Michigan, Louisiana, North Carolina, South Carolina, Wisconsin, and Pennsylvania. The absence in these markets suggests either low franchise interest or logistical limitations, such as supply chain distance or brand recognition challenges.
As The Human Bean refines its distribution logistics and brand awareness campaigns, entering these regions may become a mid-term strategic goal.
By 2026, The Human Bean aims to surpass 230 locations nationwide, with new outlets planned in Florida, Illinois, and Tennessee. Growth will continue to rely on franchise partnerships, data analytics, and sustainable practices.
Data scraping and digital mapping tools are expected to play a vital role in forecasting profitable areas. Ongoing collaboration with digital data intelligence services ensures that expansion aligns with consumer behavior patterns and local demand indicators.
With the coffee chain industry projected to grow 6% annually through 2027, The Human Bean is well-positioned to capitalize on consumer shifts toward quick-service, specialty coffee models.
The expansion of The Human Bean across the United States in 2025 illustrates a blend of regional dominance and technological adaptability. With 204 outlets across 25 states, the brand continues to grow through drive-thru innovation, sustainability efforts, and community-based franchising.
The use of scraping tools and APIs—such as Food delivery Intelligence services—has revolutionized the way location-based insights are collected and analyzed. These tools enable continuous monitoring of market performance, allowing brands to adapt in real-time to changing consumer trends.
Furthermore, digital solutions like Food Price Dashboard provide visual insights into pricing patterns, sales growth, and delivery optimization across states. Combined with Food Delivery Datasets, these resources ensure that businesses can benchmark performance, streamline operations, and plan future expansions effectively.
In summary, the story of The Human Bean’s 2025 footprint is not only about the number of locations—it represents how data intelligence, strategic geography, and consumer understanding converge to define modern retail coffee success in America.
If you are seeking for a reliable data scraping services, Food Data Scrape is at your service. We hold prominence in Food Data Aggregator and Mobile Restaurant App Scraping with impeccable data analysis for strategic decision-making.

