Introduction
The Costco US Grocery Market Analysis Report provides a comprehensive, data-driven evaluation of Costco’s grocery operations, geographic distribution, revenue efficiency, and competitive positioning across the United States. This study combines location intelligence, financial benchmarking, and service-level analysis to uncover how Costco Wholesale Corporation dominates the grocery retail segment through operational precision rather than store volume.
In addition, this research delivers actionable Costco United States Grocery Market Intelligence for businesses seeking to understand store density, expansion patterns, and revenue concentration in high-performing regions. The findings also demonstrate how to Extract Costco US Grocery Market Data to evaluate footprint growth, regional saturation, and service availability across states.
Costco’s Grocery Footprint Across the United States
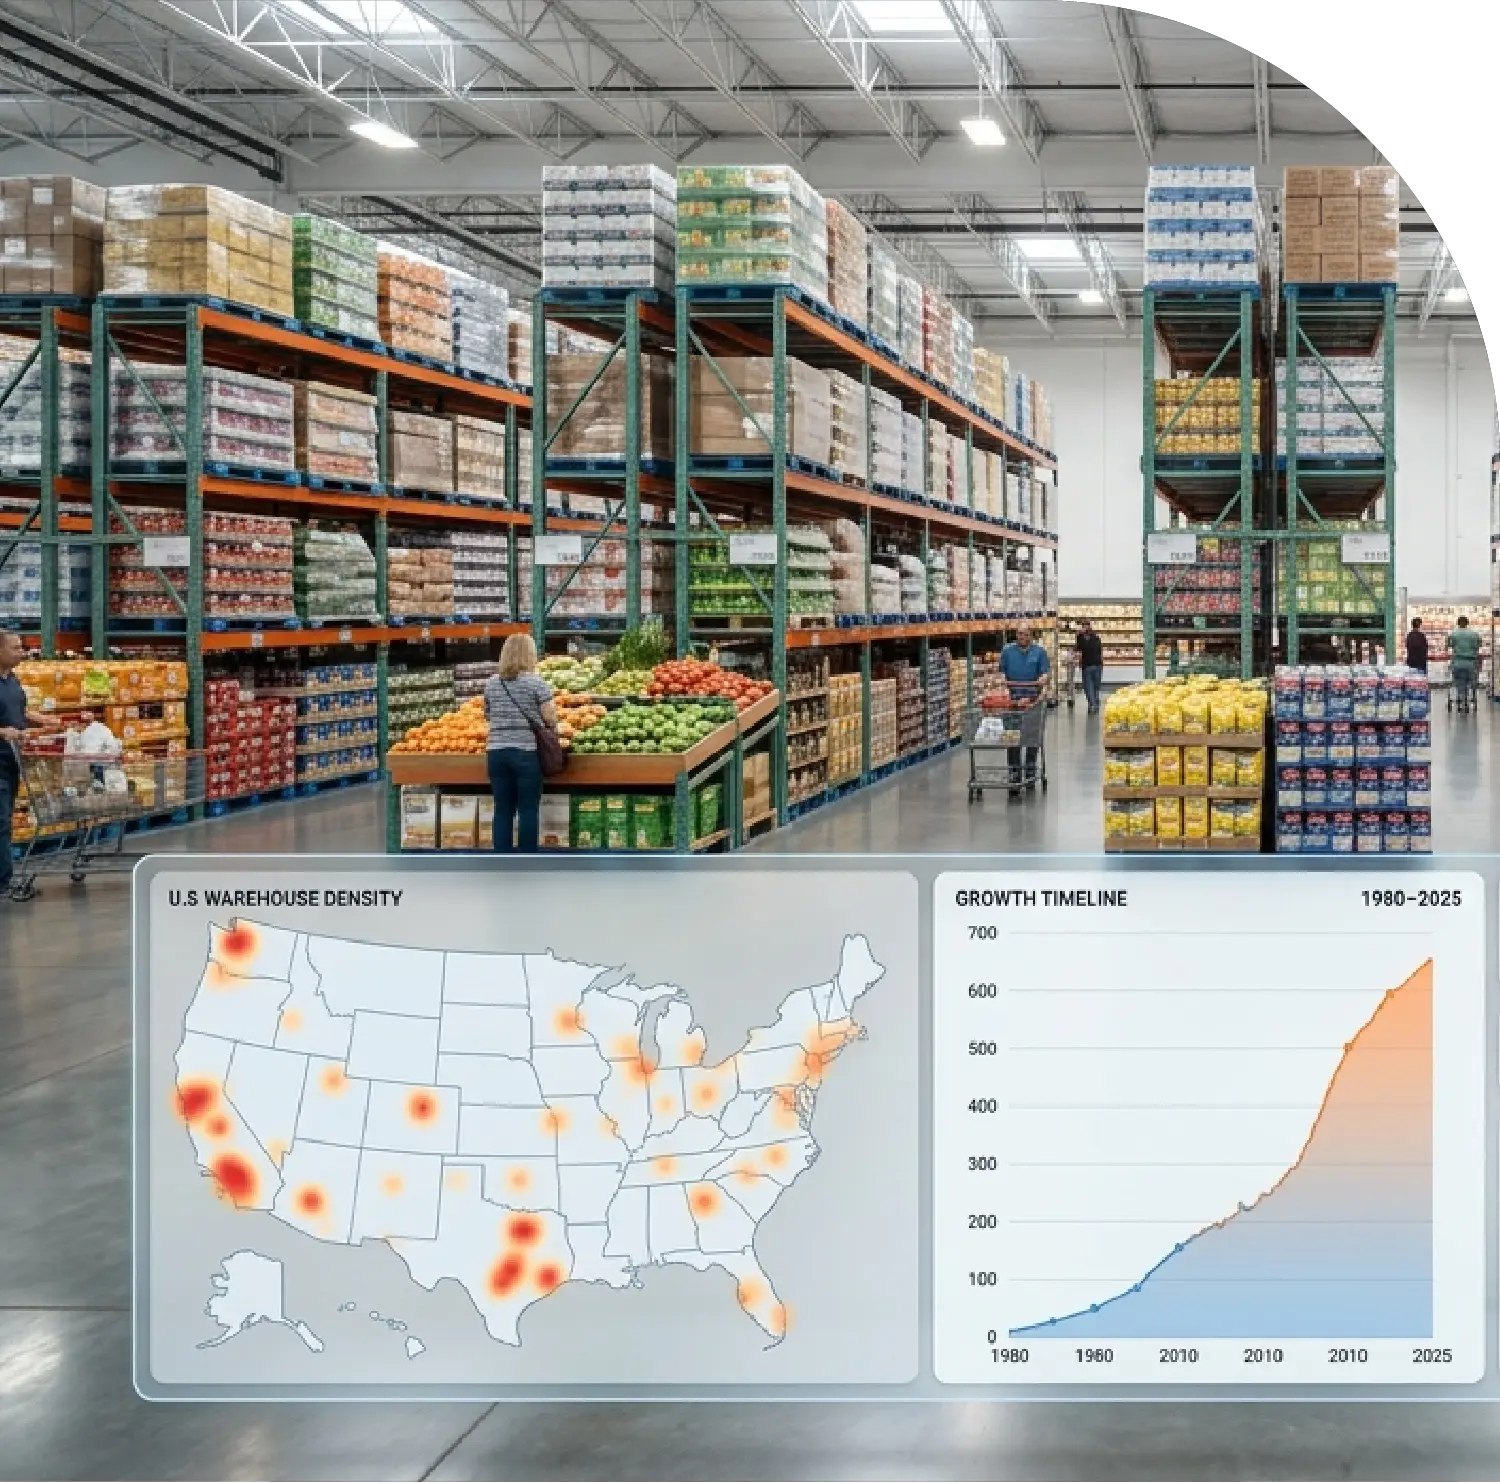
As of 2025, Costco operates 652 warehouses across 50 states and 555 cities, making it one of the most geographically diversified membership-based grocery retailers in the country. While the company runs fewer locations than many national chains, its warehouse model focuses on high-volume grocery turnover and premium private-label sales.
Table 1: Top 10 States by Number of Costco Locations
| Rank |
State |
Number of Stores |
Share of US Total |
| 1 |
California |
148 |
22.7% |
| 2 |
Texas |
48 |
7.3% |
| 3 |
Florida |
37 |
5.7% |
| 4 |
Washington |
36 |
5.5% |
| 5 |
Illinois |
25 |
3.8% |
| 6 |
New Jersey |
23 |
3.5% |
| 7 |
Arizona |
21 |
3.2% |
| 8 |
New York |
20 |
3.1% |
| 9 |
Michigan |
19 |
2.9% |
| 10 |
Georgia |
18 |
2.8% |
|
Virginia |
18 |
2.8% |
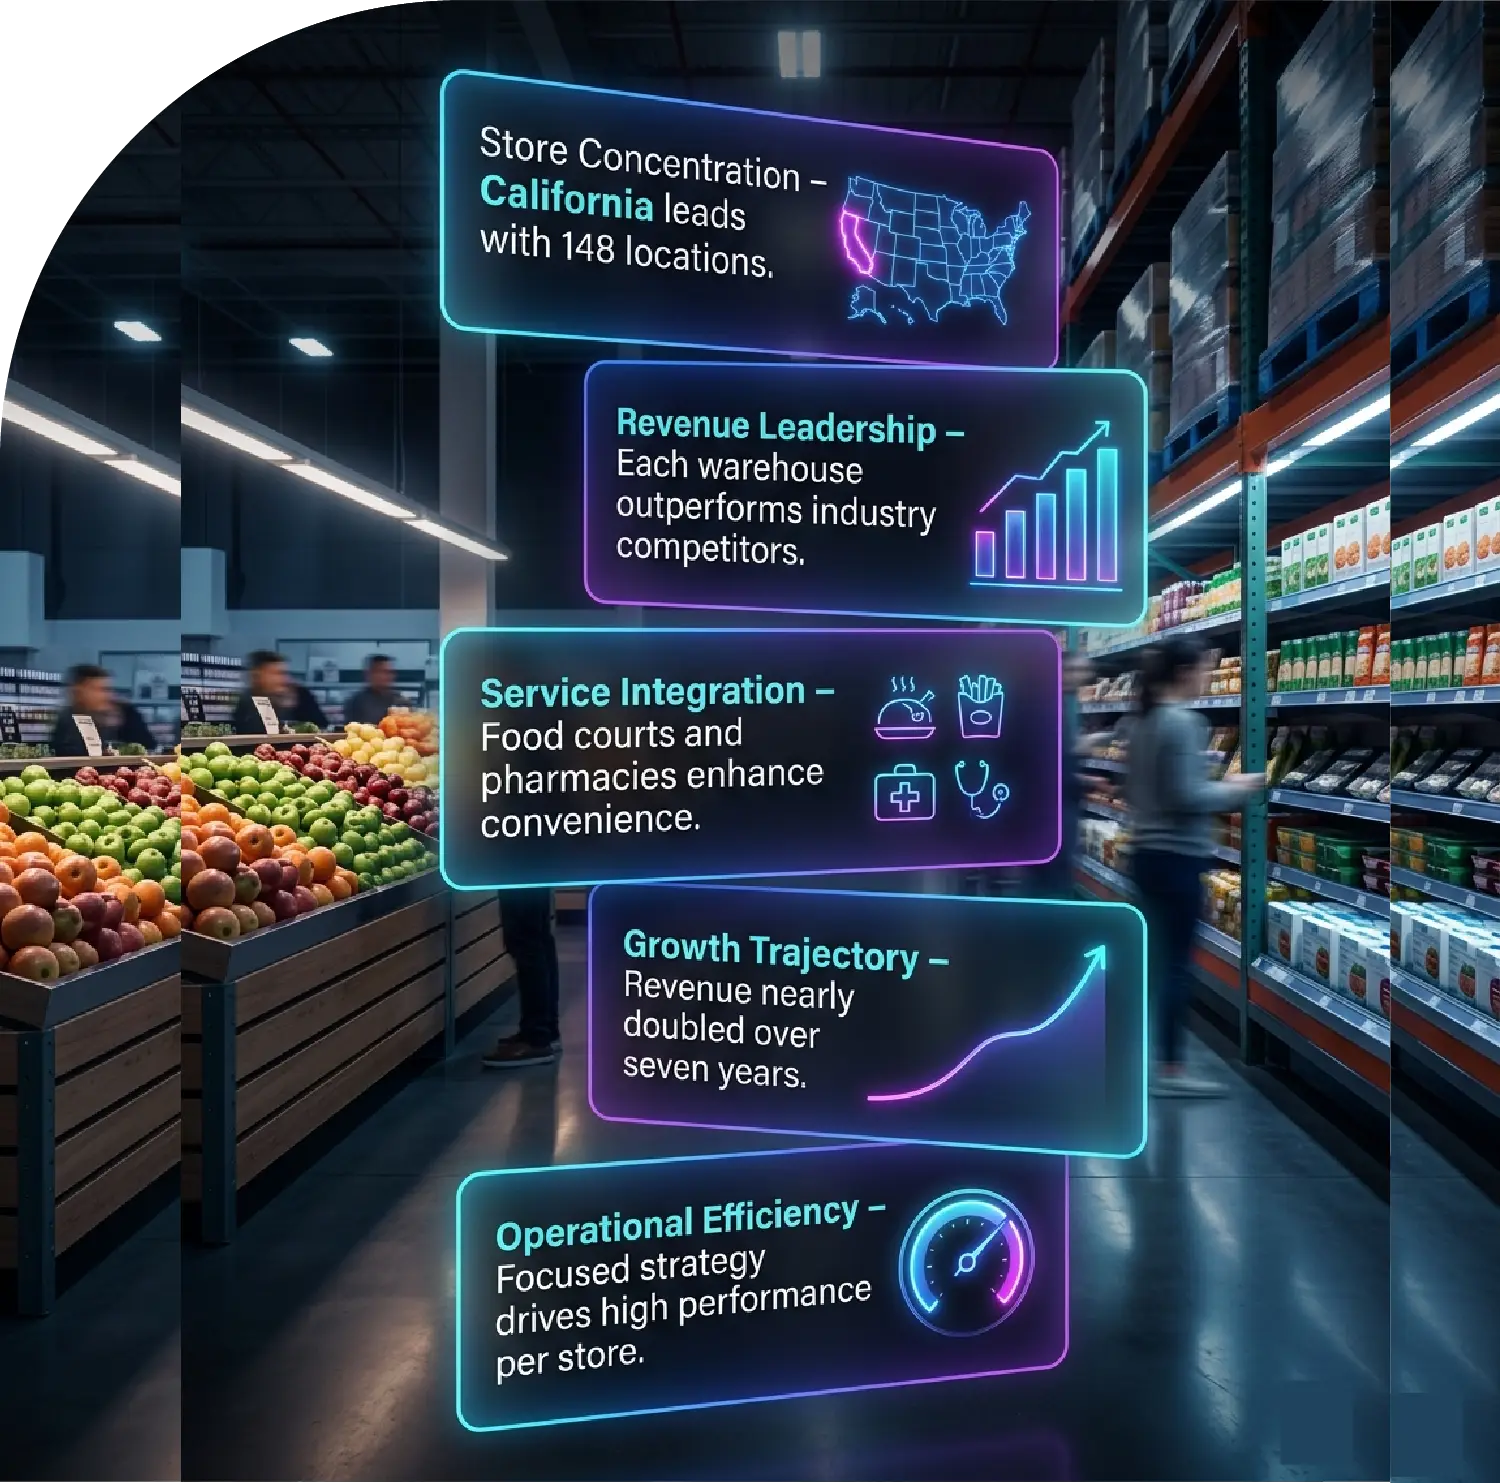
California continues to be the operational hub, accounting for nearly one-quarter of all US Costco warehouses.
Historical Grocery Expansion Strategy
Costco’s grocery growth in the United States can be divided into four major phases:
-
Early Foundations (Pre-1990)
By 1980, there were only 5 locations. During the 1980s, Costco added 90 stores nationwide, showing controlled initial growth.
-
The 1990s Acceleration
The 1990s brought 145 new warehouses, targeting suburban high-growth regions.
-
The Golden Era (2000–2009)
The most aggressive expansion occurred with 192 warehouse openings, emphasizing strategic urban-suburban coverage.
-
Sustained Modern Expansion (2010–2025)
From 2010 to 2025, Costco added 230 new locations (140 in the 2010s and 90 by 2025), proving the sustainability of its bulk-grocery model.
Service Infrastructure and Grocery Ecosystem
Costco’s grocery success is enhanced by multiple essential services that increase repeat visits and membership loyalty.
Table 2: Key Services Available at US Costco Locations
| Service Type |
Number of Locations |
% of Total Stores |
| Food Court |
620 |
95% |
| Optical Department |
618 |
94.7% |
| Pharmacy |
615 |
94.3% |
| Tire Service Center |
610 |
93.6% |
| Hearing Aid Center |
607 |
93% |
| Gas Stations |
582 |
89.3% |
| Diesel Pumps |
65 |
10% |
| Propane Refills |
28 |
4.3% |
| Car Wash |
18 |
2.8% |
High-utility services such as pharmacies, gas stations, and food courts transform Costco into a multi-functional grocery hub.
Competitive Benchmarking: Store Count vs Revenue
Costco’s efficiency outperforms competitors despite fewer store locations.
Competitor benchmarking includes:
- Target Corporation
- Kroger
- Sam's Club
- BJ's Wholesale Club
Table 3: Store Count vs Total Revenue (2025)
| Company |
US Stores |
Total Revenue (USD) |
Avg Revenue per Store |
| Costco |
652 |
$282.4B |
~$433M |
| Target |
2,010 |
$110.3B |
~$55M |
| Kroger |
1,265 |
$152.6B |
~$121M |
| Sam’s Club |
620 |
$95.8B |
~$155M |
| BJ’s Wholesale Club |
245 |
$22.7B |
~$93M |
Key Insight: A single Costco warehouse generates significantly higher revenue than competitors, validating the “less locations, higher productivity” model.
Revenue Growth Trajectory (2018–2025)
Costco’s grocery-driven revenue growth underscores strong consumer demand and efficient operations.
Table 4: Annual Revenue Growth (2018–2025)
| Year |
Revenue (USD Billions) |
| 2018 |
145.2 |
| 2019 |
158.4 |
| 2020 |
172.1 |
| 2021 |
198.7 |
| 2022 |
231.4 |
| 2023 |
247.6 |
| 2024 |
260.8 |
| 2025 |
282.4 |
Revenue grew nearly two-fold in seven years, reflecting strong membership renewals, private label adoption, and grocery demand.
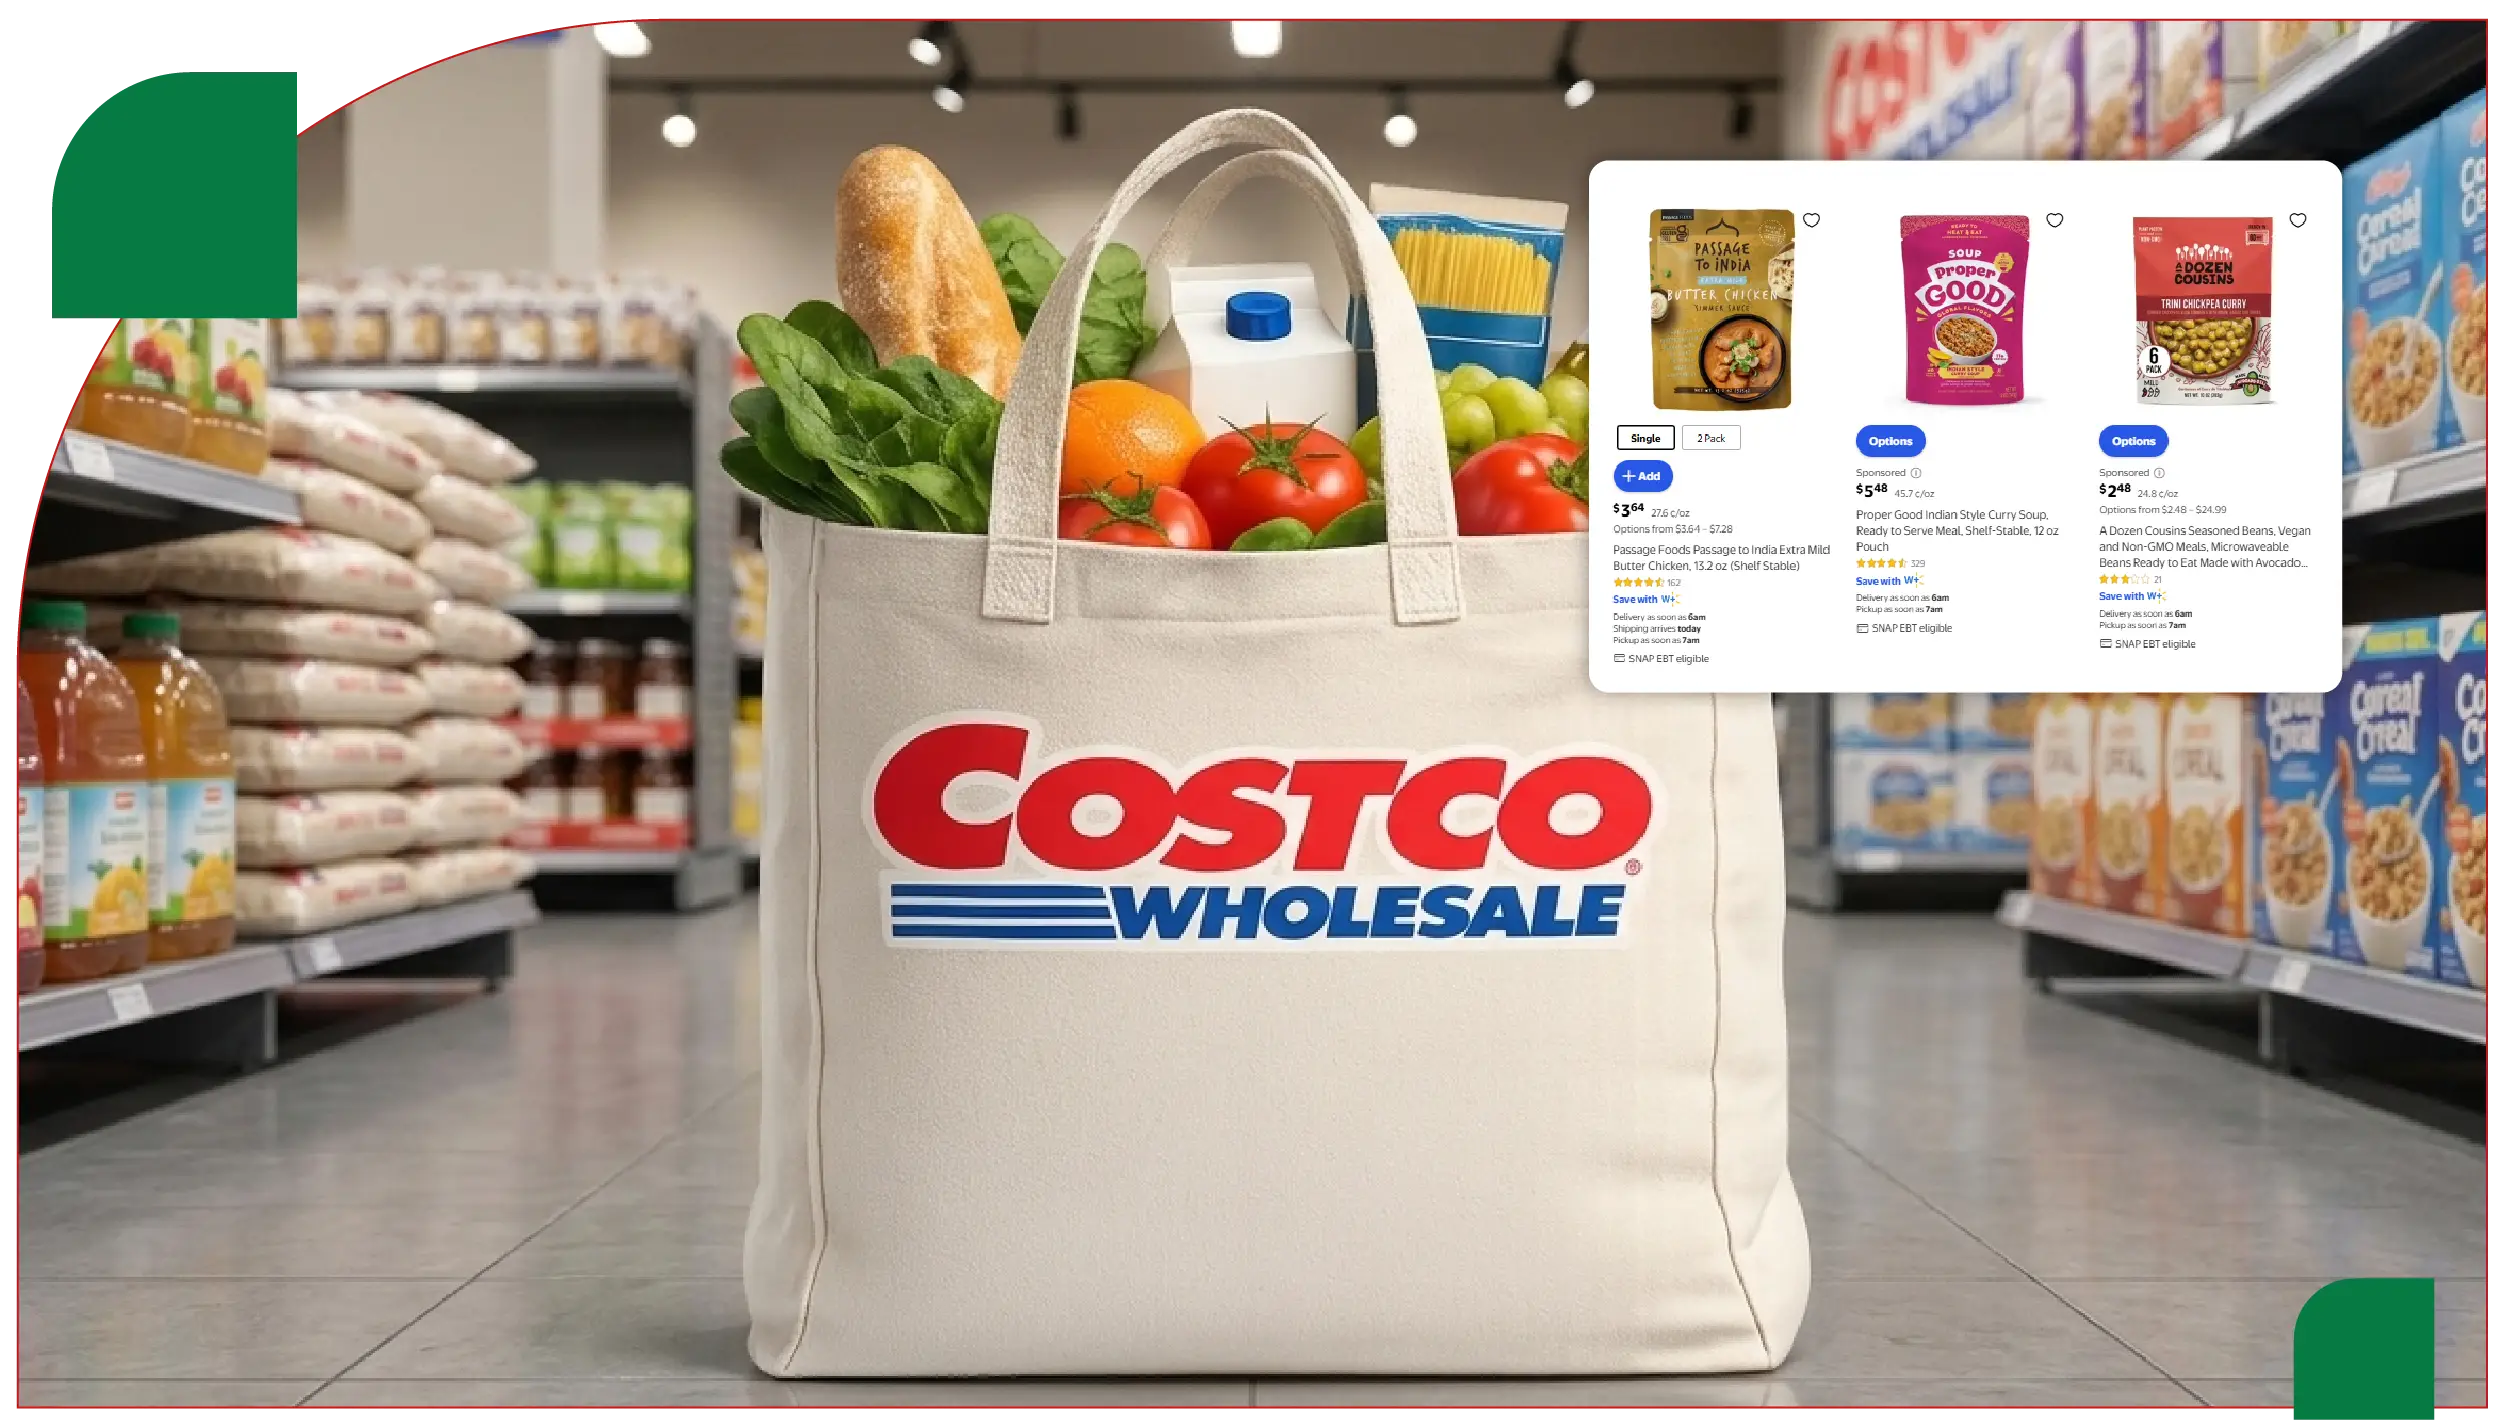
Digital Grocery and Data Extraction Opportunities
In today’s competitive grocery retail landscape, digital insights have become essential for understanding trends, pricing, and inventory management. Modern grocery analytics increasingly relies on structured digital data to provide actionable intelligence for decision-makers. For instance, monitoring Costco’s grocery operations requires capturing detailed product-level information from their stores and online platforms. Analysts can Scrape Costco US Grocery Market Data to track item prices, availability, and category assortment directly from Costco’s online and in-store sources, creating datasets that reflect real-time market conditions.
Specialized approaches allow for compiling comprehensive Web Scraping Grocery Data from Costco US, enabling analysts to understand product movement and category performance. At the same time, Grocery Product Data Extraction from Costco US provides visibility into seasonal demand shifts and regional pricing variations.
By organizing a Costco Grocery Dataset From USA, businesses can track inventory levels and assortment across multiple warehouses. Accessing delivery-specific details through Costco Grocery Delivery Scraping API offers insights into online order availability, fulfillment patterns, and service efficiency.
These methods collectively allow companies to make data-driven decisions, optimize inventory, and enhance pricing and promotional strategies across the entire grocery network.
Additionally, teams can Scrape Online Costco Grocery Delivery App Data to monitor real-time availability and pricing trends, while Web Scraping Grocery Data techniques provide consistent, structured information across multiple locations. Using these methods in combination with Grocery Delivery Extraction API tools allows retailers and suppliers to optimize inventory, promotions, and pricing strategies efficiently, transforming raw data into actionable business intelligence.
These approaches enable businesses to monitor:
- SKU-level price changes
- Category assortment trends
- Regional pricing differences
- Inventory and promotion tracking
Structured datasets empower analytics for competitive benchmarking, inventory management, and pricing optimization.
Strategic Insights
- Geographic Concentration
High-density stores in California optimize logistics and revenue per warehouse.
- Membership Revenue
Recurring fees stabilize margins and support high-value grocery operations.
- Service Integration
Food courts, gas stations, and pharmacies boost basket size and repeat visits.
- Revenue per Store Leadership
Fewer warehouses generate substantially more revenue than typical retail chains.
- Controlled Expansion
New openings are strategically located to maintain high performance.
Conclusion
Costco’s US grocery model demonstrates that operational excellence, focused expansion, and integrated services outperform a high-volume store strategy. Revenue nearly doubled from $145.2B in 2018 to $282.4B in 2025, highlighting consistent consumer demand.
Access to structured Grocery Price Tracking Dashboard enables real-time visibility into regional pricing. Integrated Grocery Data Intelligence supports competitive insights, while comprehensive Grocery Datasets empower strategic decision-making across retail and supply chain operations.
In short, Costco’s US grocery footprint from Grocery Price Dashboard proves that strategic concentration and operational precision outperform sheer scale, establishing it as one of the most efficient grocery retailers in the country.
Are you in need of high-class scraping services? Food Data Scrape should be your first point of call. We are undoubtedly the best in Food Data Aggregator and Mobile Grocery App Scraping service and we render impeccable data insights and analytics for strategic decision-making. With a legacy of excellence as our backbone, we help companies become data-driven, fueling their development. Please take advantage of our tailored solutions that will add value to your business. Contact us today to unlock the value of your data.